
1852 United States presidential election
| |||||||||||||||||||||||||||||
296 members of the Electoral College 149 electoral votes needed to win | |||||||||||||||||||||||||||||
|---|---|---|---|---|---|---|---|---|---|---|---|---|---|---|---|---|---|---|---|---|---|---|---|---|---|---|---|---|---|
| Turnout | 69.5%[1] | ||||||||||||||||||||||||||||
| |||||||||||||||||||||||||||||
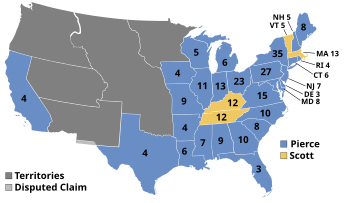 Presidential election results map. Blue denotes states won by Pierce/King and Yellow by Scott/Graham. Numbers indicate the number of electoral votes cast by each state. | |||||||||||||||||||||||||||||
| |||||||||||||||||||||||||||||
.jpg)
.jpg)
The 1852 United States presidential election was the 17th quadrennial
Incumbent Whig President
With few policy differences between the two major candidates, the election became a personality contest. Though Scott had commanded in the Mexican–American War, Pierce also served. Scott strained Whig Party unity as his anti-slavery reputation gravely damaged his campaign in the South. A group of Southern Whigs and a separate group of Southern Democrats each nominated insurgent tickets, but both efforts failed to attract support.
Pierce and running mate William R. King won a comfortable popular majority, carrying 27 of the 31 states. Pierce won the highest share of the electoral vote since James Monroe's uncontested 1820 re-election. The Free Soil Party regressed to less than five percent of the national popular vote, down from more than ten percent in 1848, while overwhelming defeat and disagreement about slavery soon drove the Whig Party to disintegrate. Anti-slavery Whigs and Free Soilers would ultimately coalesce into the new Republican Party, which would quickly become a formidable movement in the free states.
Not until 1876 would Democrats again win a majority of the popular vote for president, and not until 1932 would they win a majority in both the popular vote and the electoral college.
Nominations
Democratic Party nomination
| 1852 Democratic Party ticket | |||||||||||||||||||||||||||||
| Franklin Pierce | William R. King | ||||||||||||||||||||||||||||
|---|---|---|---|---|---|---|---|---|---|---|---|---|---|---|---|---|---|---|---|---|---|---|---|---|---|---|---|---|---|
| for President | for Vice President | ||||||||||||||||||||||||||||
.jpg) |
 | ||||||||||||||||||||||||||||
| U.S. senator from New Hampshire (1837–1842) |
U.S. senator from Alabama (1819–1844 & 1848–1852) | ||||||||||||||||||||||||||||
- Franklin Pierce, former U.S. senator from New Hampshire
- Lewis Cass, U.S. senator from Michigan
- James Buchanan, former U.S. secretary of state from Pennsylvania
- William L. Marcy, former U.S. secretary of war from New York
- Stephen Douglas, U.S. senator from Illinois

.jpg)


The Democratic Party held its national convention in Baltimore, Maryland, in June 1852. Benjamin F. Hallett, the chair of the Democratic National Committee, limited the sizes of the delegations to their electoral votes and a vote to maintain the two-thirds requirement for the presidential and vice-presidential nomination was passed by a vote of 269 to 13.[2]
James Buchanan, Lewis Cass, William L. Marcy, and Stephen A. Douglas were the main candidates for the nomination. All of the candidates led the ballot for the presidential nomination at one point, but all of them failed to meet the two-thirds requirement. Franklin Pierce was put up for the nomination by the Virginia delegation. Pierce won the nomination when the delegates switched their support to him after he had received the unanimous support of the delegates from New England. He won on the second day of balloting after forty-nine ballots.[2][3]
The delegation from Maine proposed that the vice-presidential nomination should be given to somebody from the Southern United States with William R. King being specifically named. King led on the first ballot before winning on the second ballot.[2]
Whig Party nomination
| 1852 Whig Party ticket | |||||||||||||||||||||||||||||
| Winfield Scott | William A. Graham | ||||||||||||||||||||||||||||
|---|---|---|---|---|---|---|---|---|---|---|---|---|---|---|---|---|---|---|---|---|---|---|---|---|---|---|---|---|---|
| for President | for Vice President | ||||||||||||||||||||||||||||
 |
.jpg) | ||||||||||||||||||||||||||||
| 3rd Commanding General of the U.S. Army (1841–1861) |
20th U.S. Secretary of the Navy (1850–1852) | ||||||||||||||||||||||||||||

- Winfield Scott, commanding general of the U.S. Army from New Jersey
- Millard Fillmore, president of the United States from New York
- Daniel Webster, U.S. secretary of state from Massachusetts
-
 Commanding General
Winfield Scott -
 President
Millard Fillmore -
 U.S. Secretary of State
Daniel Webster


The Whig Party held its national convention in Baltimore, Maryland, in June 1852. The call for the convention had been made by Whig members of the United States Congress and thirty-one states were represented. A vote to have each state's vote be based on its electoral college strength was passed by a vote of 149 to 144, but it was rescinded due to disagreements from the Southern states and smaller Northern states.[2]
The party had been divided by the Compromise of 1850 and was divided over the presidential nomination between incumbent President Millard Fillmore, who received support from the South, and Winfield Scott, who received his support from the North. William H. Seward, who had been the main opponent of the compromise in the United States Senate and advised President Zachary Taylor against it, supported Scott. Fillmore offered to give his delegates to Daniel Webster if he received the support of forty-one delegates on his own, but Webster was unsuccessful. Scott won the nomination on the 53rd ballot. William Alexander Graham won the vice-presidential nomination without a formal vote.[2][4]
Nine southern Whig members of Congress, including Alexander H. Stephens and Robert Toombs, refused to support Scott.[5]
Free Soil Party nomination

The
Union Party nomination
The Union party was formed in 1850, an offshoot of the Whig party in several Southern states, including Georgia. As the 1852 presidential election approached, Union party leaders decided to wait and see who was nominated by the two major parties. The movement to nominate Daniel Webster as a third-party candidate began in earnest following the Whig Convention, largely driven by those who had been strenuously opposed to Winfield Scott's nomination for president, among them Alexander Stephens, Robert Toombs, and George Curtis. While Webster was against what he perceived as a "revolt" from the Whig Party and preferred not to be nominated, he let Americans vote for him should the party choose to nominate him.
The Union Party held its Georgia state convention on August 9, 1852, and nominated Webster for president and Charles J. Jenkins of Georgia for vice president. A formal convention was held at Faneuil Hall in Boston, Massachusetts, on September 15, affirming the nominations made at the state convention in Georgia and rejecting Winfield Scott as nothing more than a military figure. The Webster/Jenkins ticket received nationwide support, particularly among Southern Whigs, but also in Massachusetts and New York, but it was largely perceived by many as nothing more than getting voters who would, in different circumstances, support Scott.
Webster had no real chance of winning the election, but even the new
Native American (Know-Nothing) Party nomination
Around the mid-1830s,
Southern Rights Party nomination
- Georgia
-
 Former senatorGeorgia

The Southern Rights Party was an offshoot of the Democratic party in several Southern states which advocated secession from the Union, electing a number of Congressmen and holding referendums on secession in a number of southern states, none of which were successful.
It was unclear in early 1852 if the Party would contest the presidential election. When the Alabama state convention was held in early March, only nine counties were represented. The party decided to see who was nominated by the two major national parties and support one of them if possible. When Georgia held its state convention, it acted as the state Democratic Party and sent delegates to the national convention.
After the Democratic National Convention, the Party was not sure that it wanted to support Franklin Pierce and William R. King, the Democratic nominees. Alabama held a state convention from July 13–15 and discussed at length the options of running a separate ticket or supporting Pierce and King. The convention was unable to arrive at a decision, deciding to appoint a committee to review the positions of Scott/Graham and Pierce/King with the option of calling a "national" convention if the two major-party tickets appeared deficient. The committee took its time reviewing the positions of Pierce and Scott, finally deciding on August 25 to call a convention for a Southern Rights Party ticket.
The convention assembled in Montgomery, Alabama, with 62 delegates present, a committee to recommend a ticket being appointed while the delegates listened to speeches in the interim. The committee eventually recommended former senator George Troup of Georgia for president, and former Governor John Quitman of Mississippi for vice president; they were unanimously nominated.
The two nominees accepted their nominations soon after the convention, which was held rather late in the season. Troup stated in a letter, dated September 27 and printed in the New York Times on October 16, that he had planned to vote for Pierce/King and had always wholeheartedly supported William R.D. King. He indicated in the letter that he preferred to decline the honor, as he was rather ill at the time and feared that he would die before the election. The Party's executive committee edited the letter to excise those portions which indicated that Troup preferred to decline, a fact which was revealed after the election.
Liberty Party nomination
The
General election
Fall campaign

The Whigs' platform was almost indistinguishable from that of the Democrats, reducing the campaign to a contest between the personalities of the two candidates. The lack of clearcut issues between the two parties helped drive voter turnout down to its lowest level since 1836. The decline was further exacerbated by Scott's antislavery reputation, which decimated the Southern Whig vote at the same time as the pro-slavery Whig platform undermined the Northern Whig vote. After the Compromise of 1850 was passed, many of the southern Whig Party members broke with the party's key figure, Henry Clay.[8]
Finally, Scott's status as a war hero was somewhat offset by the fact that Pierce was himself a Mexican–American War brigadier general.
The Democrats adopted the slogan: The Whigs we Polked in forty-four, We'll Pierce in fifty-two, playing on the names of Pierce and former President James K. Polk.[9]
Just nine days before the election, Webster died, causing many Union state parties to remove their slates of electors. The Union ticket appeared on the ballot in Georgia and Massachusetts, however.
Results

When American voters went to the polls, Pierce won the electoral college in a landslide; Scott won only the states of Kentucky, Tennessee, Massachusetts, and Vermont, while the Free Soil vote collapsed to less than half of what Martin Van Buren had earned in the previous election, with the party taking no states. The fact that Daniel Webster received a substantial share of the vote in Georgia and Massachusetts, even though he was dead, shows how disenchanted voters were with the two main candidates.
In the popular vote, while Pierce outpolled Scott by 220,000 votes, 17 states were decided by less than 10%, and eight by less than 5%. A shift of 69,000 votes to Scott in Delaware, Maryland, New York, North Carolina, Ohio and Pennsylvania would have left the electoral college in a 148–148 tie, forcing a contingent election in the House of Representatives.
As a result of the devastating defeat and the growing tensions within the party between pro-slavery Southerners and anti-slavery Northerners, the Whig Party quickly fell apart after the 1852 election and ceased to exist. Some Southern Whigs would join the Democratic Party, and many Northern Whigs would help to form the new Republican Party in 1854.
Some Whigs in both sections would support the so-called "
The Southern Rights Party effectively collapsed following the election, attaining only five percent of the vote in Alabama, and a few hundred in its nominee's home state of Georgia. It would elect a number of Congressmen in 1853, but they would rejoin the Democratic Party upon taking their seats in Congress.
Kentucky and Tennessee were the only slave states that Scott won. None of the future Confederate states elected governors in the 1852 and 1853 gubernatorial elections and only Whigs only won 14 of the south's 65 seats in the U.S. House. The party held no state legislatures in the south except for in Tennessee.[5] The Democrats, who carried all but two northern states, would see a decline in the north following the 1854 elections due to controversy around the Kansas–Nebraska Act. They lost control of all free state legislatures except for two and their seats in the U.S. House from the north fell from 93 to 23.[10]

| Presidential candidate | Party | Home state | Popular vote[a] | Electoral vote |
Running mate | |||
|---|---|---|---|---|---|---|---|---|
| Count | Percentage | Vice-presidential candidate | Home state | Electoral vote | ||||
| Franklin Pierce | Democratic
|
New Hampshire | 1,607,510 | 50.84% | 254 | William R. King | Alabama | 254 |
| Winfield Scott | Whig
|
New Jersey | 1,386,942 | 43.87% | 42 | William Alexander Graham | North Carolina | 42 |
| John P. Hale | Free Soil
|
New Hampshire | 155,210 | 4.91% | 0 | George Washington Julian
|
Indiana | 0 |
| Daniel Webster[b] | Union[c] | Massachusetts | 6,994 | 0.22% | 0 | Charles J. Jenkins | Georgia | 0 |
| Jacob Broom | Native American
|
Pennsylvania | 2,566 | 0.08% | 0 | Reynell Coates | New Jersey | 0 |
| George Troup | Southern Rights | Georgia | 2,331 | 0.07% | 0 | John A. Quitman | Mississippi | 0 |
| Other | 277 | 0.00% | — | Other | — | |||
| Total | 3,161,830 | 100% | 296 | 296 | ||||
| Needed to win | 149 | 149 | ||||||
Source (Popular Vote): Leip, David. "1852 Presidential Election Results". Dave Leip's Atlas of U.S. Presidential Elections. Retrieved July 27, 2005.
Source (Electoral Vote): "Electoral College Box Scores 1789–1996". National Archives and Records Administration. Retrieved July 31, 2005.
- The leading candidates for vice president were both born in North Carolina and in fact both attended the University of North Carolina at Chapel Hill, albeit two decades apart. While there, they were members of opposing debate societies: the Dialectic and Philanthropic Societies. Both also served in North Carolina politics: King was a representative from North Carolina before he moved to Alabama, and Graham was a governor of North Carolina.
Records
This was the last election in which the Democrats won Michigan until 1932,[d] the last in which the Democrats won Iowa, Maine, New Hampshire, Ohio[e] or Rhode Island until 1912, the last in which the Democrats won Wisconsin until 1892, the last in which the Democrats won Connecticut until 1876 and the last in which the Democrats won New York until 1868. It was, however, the last election in which the Democrats' chief opponent won Kentucky until 1896,[f][11] and the last until 1928 in which the Democrats' opponent obtained an absolute majority in Kentucky.
Geography of results
Cartographic gallery
-
 Map of presidential election results by county
 -
 Map of Democratic presidential election results by county
 -
 Map of Whig presidential election results by county
 -
 Map of Free Soil presidential election results by county
 -
 Map of "Other" presidential election results by county


Results by state
Source: Data from Walter Dean Burnham, Presidential ballots, 1836–1892 (Johns Hopkins University Press, 1955) pp 247–57.
| States/districts won by Pierce/King |
| States/districts won by Scott/Graham |
| Franklin Pierce Democratic |
Winfield Scott Whig |
John P. Hale Free Soil |
Margin | State Total | ||||||||||||||
|---|---|---|---|---|---|---|---|---|---|---|---|---|---|---|---|---|---|---|
| State | electoral votes |
# | % | electoral votes |
# | % | electoral votes |
# | % | electoral votes |
# | % | # | |||||
| Alabama | 9 | 26,881 | 60.89 | 9 | 15,061 | 34.12 | - | no ballots | 11,280 | 26.77 | 44,147 | AL | ||||||
| Arkansas | 4 | 12,173 | 62.18 | 4 | 7,404 | 37.82 | - | no ballots | 4,769 | 24.36 | 19,577 | AR | ||||||
| California | 4 | 40,721 | 53.02 | 4 | 35,972 | 46.83 | - | 61 | 0.08 | - | 4,749 | 6.19 | 76,810 | CA | ||||
| Connecticut | 6 | 33,249 | 49.79 | 6 | 30,359 | 45.56 | - | 3,161 | 4.73 | - | 2,890 | 4.23 | 66,781 | CT | ||||
| Delaware | 3 | 6,318 | 49.85 | 3 | 6,293 | 49.66 | - | 62 | 0.49 | - | 25 | 0.19 | 12,673 | DE | ||||
| Florida | 3 | 4,318 | 60.03 | 3 | 2,875 | 39.97 | - | no ballots | 1,443 | 20.06 | 7,193 | FL | ||||||
| Georgia | 10 | 40,516 | 64.70 | 10 | 16,660 | 26.60 | - | no ballots | 23,856 | 38.10 | 62,626 | GA | ||||||
| Illinois | 11 | 80,378 | 51.87 | 11 | 64,733 | 41.77 | - | 9,863 | 6.36 | - | 15,645 | 10.10 | 154,974 | IL | ||||
| Indiana | 13 | 95,340 | 52.05 | 13 | 80,901 | 44.17 | - | 6,929 | 3.78 | - | 14,439 | 7.88 | 183,170 | IN | ||||
| Iowa | 4 | 17,763 | 50.23 | 4 | 15,856 | 44.84 | - | 1,606 | 4.54 | - | 1,907 | 5.39 | 35,364 | IA | ||||
| Kentucky | 12 | 53,494 | 48.32 | - | 57,428 | 51.44 | 12 | 266 | 0.24 | - | -3,934 | -3.12 | 111,643 | KY | ||||
| Louisiana | 6 | 18,647 | 51.94 | 6 | 17,255 | 48.06 | - | no ballots | 1,392 | 3.88 | 35,902 | LA | ||||||
| Maine | 8 | 41,609 | 50.63 | 8 | 32,543 | 39.60 | - | 8,030 | 9.77 | - | 9,066 | 11.03 | 82,182 | ME | ||||
| Maryland | 8 | 40,022 | 53.28 | 8 | 35,077 | 46.69 | - | 21 | 0.03 | - | 4,945 | 6.59 | 75,120 | MD | ||||
| Massachusetts | 13 | 44,569 | 35.07 | - | 52,683 | 41.45 | 13 | 28,203 | 22.19 | - | -8,114 | -6.38 | 127,103 | MA | ||||
| Michigan | 6 | 41,842 | 50.45 | 6 | 33,860 | 40.83 | - | 7,237 | 8.73 | - | 7,982 | 9.62 | 82,939 | MI | ||||
| Mississippi | 7 | 26,896 | 60.50 | 7 | 17,558 | 39.50 | - | no ballots | 9,338 | 21.00 | 44,454 | MS | ||||||
| Missouri | 9 | 38,817 | 56.42 | 9 | 29,984 | 43.58 | - | no ballots | 8,833 | 12.84 | 68,801 | MO | ||||||
| New Hampshire | 5 | 28,503 | 56.40 | 5 | 15,486 | 30.64 | - | 6,546 | 12.95 | - | 13,017 | 25.76 | 50,535 | NH | ||||
| New Jersey | 7 | 44,305 | 53.24 | 7 | 38,556 | 46.33 | - | 359 | 0.43 | - | 5,749 | 6.91 | 83,220 | NJ | ||||
| New York | 35 | 262,083 | 50.18 | 35 | 234,882 | 44.97 | - | 25,329 | 4.85 | - | 27,201 | 5.21 | 522,294 | NY | ||||
| North Carolina | 10 | 39,778 | 50.43 | 10 | 39,043 | 49.49 | - | no ballots | 735 | 0.94 | 78,891 | NC | ||||||
| Ohio | 23 | 168,933 | 47.83 | 23 | 152,523 | 43.18 | - | 31,732 | 8.98 | - | 16,410 | 4.65 | 353,188 | OH | ||||
| Pennsylvania | 27 | 198,562 | 51.20 | 27 | 179,104 | 46.18 | - | 8,495 | 2.19 | - | 19,458 | 5.02 | 387,389 | PA | ||||
| Rhode Island | 4 | 8,735 | 51.37 | 4 | 7,626 | 44.85 | - | 644 | 3.79 | - | 1,109 | 6.52 | 17,005 | RI | ||||
| South Carolina | 8 | no popular vote | 8 | no popular vote | no popular vote | - | - | - | SC | |||||||||
| Tennessee | 12 | 56,900 | 49.27 | - | 58,586 | 50.73 | 12 | no ballots | -1,686 | -1.46 | 115,486 | TN | ||||||
| Texas | 4 | 13,552 | 73.07 | 4 | 4,995 | 26.93 | - | no ballots | 8,557 | 46.14 | 18,547 | TX | ||||||
| Vermont | 5 | 13,044 | 29.72 | - | 22,173 | 50.52 | 5 | 8,621 | 19.64 | - | -9,129 | -20.80 | 43,890 | VT | ||||
| Virginia | 15 | 73,872 | 55.71 | 15 | 58,732 | 44.29 | - | no ballots | 15,140 | 11.42 | 132,604 | VA | ||||||
| Wisconsin | 5 | 33,658 | 52.04 | 5 | 22,210 | 34.34 | - | 8,814 | 13.63 | - | 11,448 | 17.70 | 64,682 | WI | ||||
| TOTALS: | 296 | 1,605,943 | 50.83 | 254 | 1,386,418 | 43.88 | 42 | 155,799 | 4.93 | - | 3,159,640 | the US | ||||||
| TO WIN: | 149 | |||||||||||||||||
States that flipped from Whig to Democratic
- Connecticut
- Delaware
- Georgia
- Florida
- Louisiana
- Maryland
- New Jersey
- New York
- North Carolina
- Pennsylvania
- Rhode Island
Close states
States where the margin of victory was under 1%:
- Delaware 0.19% (25 votes)
- North Carolina 0.90% (735 votes)
States where the margin of victory was under 5%:
- Tennessee 1.46% (1,686 votes)
- Kentucky 3.12% (3,934 votes)
- Louisiana 3.88% (1,392 votes)
- Connecticut 4.23% (2,890 votes)
- Ohio 4.65% (16,410 votes)
States where the margin of victory was under 10%:
- Pennsylvania 5.02% (19,458 votes)
- New York 5.21% (27,201 votes) (tipping point state)
- Iowa 5.39% (1,907 votes)
- California 6.19% (4,749 votes)
- Massachusetts 6.38% (8,114 votes)
- Rhode Island 6.52% (1,109 votes)
- Maryland 6.59% (4,945 votes)
- New Jersey 6.91% (5,749 votes)
- Indiana 7.88% (14,439 votes)
- Michigan 9.62% (7,982 votes)
Electoral college selection
| Method of choosing electors | State(s) |
|---|---|
| Each Elector appointed by state legislature | South Carolina |
| Each Elector chosen by voters statewide | (all other States) |
See also
- History of the United States (1849–65)
- Inauguration of Franklin Pierce
- Second Party System
- 1852–53 United States House of Representatives elections
- 1852–53 United States Senate elections
Notes
- ^ The popular vote figures exclude South Carolina where the Electors were chosen by the state legislature rather than by popular vote.
- Native American Party but was replaced on his death by Jacob Broom.
- ^ For a detailed discussion of the Union Party formed by Pro-Union Whigs, see Michael F. Holt, The Rise and Fall of the Whig Party: Jacksonian Politics and the Onset of the Civil War (New York: Oxford University Press, 1999), Chapters 19 and 20.
- ^ In 1892 Democrat Grover Cleveland did win one electoral vote from each of five Michigan congressional districts he carried despite losing the state
- ^ In 1892 the direct election of presidential electors meant Grover Cleveland received one Ohio electoral vote
- ^ Constitutional Union Party candidate John Bell won Kentucky in 1860; however, Bell was surpassed in the popular vote by two Democratic factions and Republican Abraham Lincoln. Apart from this, the Democrats won Kentucky in all ten elections between 1856 and 1892.
References
- ^ "National General Election VEP Turnout Rates, 1789-Present". United States Election Project. CQ Press.
- ^ a b c d e National Party Conventions, 1831-1976. Congressional Quarterly. 1979.
- ^ William DeGregorio, The Complete Book of U.S. Presidents, Gramercy 1997
- ^ Gienapp, William (1984). The Whig Party, the Compromise of 1850, and the Nomination of Winfield Scott. Presidential Studies Quarterly.
- ^ a b McPherson 1988, p. 117.
- ^ Charles O. Paullin, "The National Ticket of Broom and Coates, 1852." American Historical Review 25.4 (1920): 689–691. online
- ^ Dubin, Michael J. (2002). United States Presidential Elections, 1788-1860. Jefferson, North Carolina: McFarland & Company. p. 128.
- National Archives.
- ^ "Democratic Rallying Song for 1852". The Mountain Sentinel. Ebensburg, PA: 1. October 7, 1852.
- ^ McPherson 1988, p. 129-130.
- ^ Counting the Votes; Kentucky Archived November 20, 2017, at the Wayback Machine
Works cited
- ISBN 9780195038637.
Further reading
- Blue, Frederick J. The Free Soilers: Third-Party Politics, 1848-54 (U of Illinois Press, 1973).
- Chambers, William N., and Philip C. Davis. "Party, Competition, and Mass Participation: The Case of the Democratizing Party System, 1824–1852." in The history of American electoral behavior (Princeton University Press, reprinted 2015) pp. 174–197.
- Foner, Eric. "Politics and prejudice: The Free Soil party and the Negro, 1849–1852." Journal of Negro History 50.4 (1965): 239–256. online
- Gara, Larry. The Presidency of Franklin Pierce (UP of Kansas, 1991).
- Gienapp, William E. The origins of the Republican Party, 1852-1856 (Oxford UP, 1987).
- Holt, Michael F. The Rise and Fall of the American Whig Party: Jacksonian Politics and the Onset of the Civil War. (Oxford University Press, 1999).
- Holt, Michael F. Franklin Pierce: The American Presidents Series: The 14th President, 1853-1857 (Macmillan, 2010).
- Marshall, Schuyler C. "The Free Democratic Convention of 1852." Pennsylvania History 22.2 (1955): 146–167. online
- Morrison, Michael A. "The Election of 1852." American Presidential Campaigns and Elections (Routledge, 2020) pp. 349–366.
- Nevins, Allan. Ordeal of the Union: A house dividing, 1852–1857. Vol. 2 (1947) pp 3–42.
- Nichols, Roy Franklin. The Democratic Machine, 1850–1854 (1923) online
- Riddle, Wesley Allen. "Unrestraint Begets Calamity: The American Whig Review, 1845–1852." Humanitas 11.2 (1998). online
- Wilentz, Sean. The rise of American democracy: Jefferson to Lincoln (2006) pp 659–667.
States
- Baum, Dale. "Know-Nothingism and the Republican majority in Massachusetts: The political realignment of the 1850s." Journal of American History 64.4 (1978): 959–986. online
- Beeler, Dale. "The Election of 1852 in Indiana." Indiana Magazine of History (1915): 301–323. online
- Campbell, Randolph. "The Whig Party of Texas in the Elections of 1848 and 1852." Southwestern Historical Quarterly 73.1 (1969): 17–34. online
- Huston, James L. "The Illinois Political Realignment of 1844–1860: Revisiting the Analysis." Journal of the Civil War Era 1.4 (2011): 506–535. online
- Morrill, James R. "The Presidential Election of 1852: Death Knell of the Whig Party of North Carolina." North Carolina Historical Review 44.4 (1967): 342–359 online.
- Rosenberg, Morton M. "The Iowa Elections of 1852." Annals of Iowa 38.4 (1966). online
- Solomon, Irvin D. "The Grass Roots Appearance of a National Party: The Formation of the Republican Party in Erie, Pennsylvania, 1852–1856." Western Pennsylvania History (1983): 209–222. online
- Sweeney, Kevin. "Rum, Romanism, Representation, and Reform: Coalition Politics in Massachusetts, 1847–1853." Civil War History 22.2 (1976): 116–137.
- Walton, Brian G. "Arkansas Politics during the Compromise Crisis, 1848–1852." Arkansas Historical Quarterly 36.4 (1977): 307–337. online
Primary sources
- Chester, Edward W A guide to political platforms (1977) online
- Porter, Kirk H. and Donald Bruce Johnson, eds. National party platforms, 1840-1964 (1965) online 1840-1956
Web sites
- "A Historical Analysis of the Electoral College". The Green Papers. Retrieved September 17, 2005.
External links
- Presidential Election of 1852: A Resource Guide from the Library of Congress
- 1852 popular vote by counties
- 1852 state-by-state popular vote Archived May 17, 2008, at the Wayback Machine
- Election of 1852 in Counting the Votes Archived October 23, 2017, at the Wayback Machine
| ||
| Life |  | |
| Presidency | ||
| Public image | ||
| Family |
| |
