1935 United Kingdom general election
| |||||||||||||||||||||||||||||||||||||||||||||||||||||||||||||||||||||||||||||||||||||||||||||||||||||
All 615 seats in the House of Commons 308 seats needed for a majority | |||||||||||||||||||||||||||||||||||||||||||||||||||||||||||||||||||||||||||||||||||||||||||||||||||||
|---|---|---|---|---|---|---|---|---|---|---|---|---|---|---|---|---|---|---|---|---|---|---|---|---|---|---|---|---|---|---|---|---|---|---|---|---|---|---|---|---|---|---|---|---|---|---|---|---|---|---|---|---|---|---|---|---|---|---|---|---|---|---|---|---|---|---|---|---|---|---|---|---|---|---|---|---|---|---|---|---|---|---|---|---|---|---|---|---|---|---|---|---|---|---|---|---|---|---|---|---|---|
| Turnout | 71.1%, | ||||||||||||||||||||||||||||||||||||||||||||||||||||||||||||||||||||||||||||||||||||||||||||||||||||
| |||||||||||||||||||||||||||||||||||||||||||||||||||||||||||||||||||||||||||||||||||||||||||||||||||||
 Colours denote the winning party—as shown in § Results | |||||||||||||||||||||||||||||||||||||||||||||||||||||||||||||||||||||||||||||||||||||||||||||||||||||
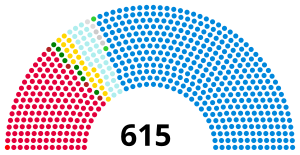
 Composition of the House of Commons after the election | |||||||||||||||||||||||||||||||||||||||||||||||||||||||||||||||||||||||||||||||||||||||||||||||||||||
| |||||||||||||||||||||||||||||||||||||||||||||||||||||||||||||||||||||||||||||||||||||||||||||||||||||
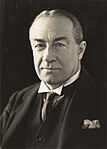
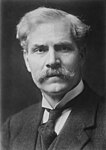
The 1935 United Kingdom general election was held on Thursday 14 November, and resulted in a large, albeit reduced, majority for the National Government now led by Stanley Baldwin of the Conservative Party. The greatest number of members, as before, were Conservatives, while the National Liberal vote held steady. The much smaller National Labour vote also held steady but the resurgence in the main Labour vote caused over a third of their MPs, including National Labour leader (and former Prime Minister) Ramsay MacDonald, to lose their seats. It was the last election in which a party or alliance won a majority of the votes cast.
The Independent Labour Party stood entirely separately from Labour for the first time since 1895, having stood candidates unendorsed by Labour at the 1931 general election and having disaffiliated fully from Labour in 1932. The Scottish National Party contested their first general election, and the Communist Party gained the West Fife seat, their first in ten years. Major election issues were stubborn unemployment and the role of the League of Nations, particularly regarding the Empire of Japan. Parliament was dissolved on 25 October.[1]
No general elections were held during the
This was the last election to be held during the reign of George V, who died two months after the election.
Results

| Candidates | Votes | ||||||||||
|---|---|---|---|---|---|---|---|---|---|---|---|
| Party | Leader | Stood | Elected | Gained | Unseated | Net | % of total | % | No. | Net % | |
| National Government | |||||||||||
| Conservative | Stanley Baldwin | 515 | 387 | 5 | 88 | −83 | 62.9 | 47.8 | 10,025,083 | −7.2 | |
| National Liberal | John Simon | 44 | 33 | 5 | 7 | −2 | 5.4 | 3.7 | 784,608 | 0.0 | |
| National Labour | Ramsay MacDonald | 20 | 8 | 1 | 6 | −5 | 1.3 | 1.5 | 321,028 | 0.0 | |
National
|
N/A | 4 | 1 | 1 | 4 | −3 | 0.2 | 0.3 | 53,189 | −0.2 | |
| National Government (total) | Stanley Baldwin | 583 | 429 | 12 | 139 | −125 | 69.8 | 51.8 | 11,183,908 | −15.4 | |
| Opposition | |||||||||||
| Labour | Clement Attlee | 552 | 154 | 105 | 3 | +102 | 25.0 | 38.0 | 7,984,988 | +7.4 | |
| Liberal | Herbert Samuel | 161 | 21 | 3 | 15 | −12 | 3.4 | 6.7 | 1,414,010 | −0.3 | |
| Ind. Labour Party | James Maxton | 17 | 4 | 4 | 0 | +4 | 0.7 | 0.7 | 136,208 | N/A | |
| Independent Liberals (UK, 1931) | David Lloyd George | 5[2] | 4 | 0 | 0 | 0 | 0.7 | 0.3 | 67,653 | −0.2 | |
| Nationalist | Thomas J. Campbell | 2 | 2 | 0 | 0 | 0 | 0.3 | 0.2 | 50,747 | −0.1 | |
| Independent Republican | N/A | 3 | 0 | 0 | 0 | 0 | 0.0 | 0.2 | 46,715 | N/A | |
Independent National
|
N/A | 2 | 2 | 0 | 0 | 0 | 0.3 | 0.2 | 33,527 | N/A | |
| SNP | Alexander MacEwen | 8 | 0 | 0 | 0 | 0 | 0.0 | 0.2 | 29,517 | 0.0 | |
Ind. Conservative
|
N/A | 3 | 0 | 0 | 0 | 0 | 0.0 | 0.1 | 29,475 | N/A | |
| Communist | Harry Pollitt | 2 | 1 | 1 | 0 | 0 | 0.2 | 0.1 | 27,177 | −0.2 | |
Independent
|
N/A | 5 | 2 | 1 | 0 | 0 | 0.3 | 0.1 | +0.1 | ||
Independent Labour
|
N/A | 1 | 0 | 0 | 0 | 0 | 0.0 | 0.1 | 14,867 | 0.0 | |
| Liverpool Protestant | Harry Longbottom | 1 | 0 | 0 | 0 | 0 | 0.0 | 0.0 | 6,677 | 0.0 | |
Independent Progressive
|
N/A | 1 | 0 | 0 | 0 | 0 | 0.0 | 0.0 | 6,421 | N/A | |
| Social Credit | John Hargrave | 3 | 0 | 0 | 0 | 0 | 0.0 | 0.0 | 10,376 | N/A | |
| Plaid Cymru | Saunders Lewis | 1
|
0 | 0 | 0 | 0 | 0.0 | 0.0 | 2,534 | 0.0 | |
| Agriculturalist | N/A | 1 | 0 | 0 | 0 | 0 | 0.0 | 0.0 | 1,771 | N/A | |
Christian Socialist
|
N/A | 1 | 0 | 0 | 0 | 0 | 0.0 | 0.0 | 1,480 | N/A | |
Votes summary
Seats summary
Transfers of seats
- All comparisons are with the 1931 election.
- In some cases the change is due to the MP defecting to the gaining party. Such circumstances are marked with a *.
- In other circumstances the change is due to the seat having been won by the gaining party in a by-election in the intervening years, and then retained in 1935. Such circumstances are marked with a †.
Constituency results
These are available on the Political Science Resources Elections Database, a link to which is given below.
See also
- List of MPs elected in the 1935 United Kingdom general election
- 1935 United Kingdom general election in Northern Ireland
References
- ^ "Parliamentary Election Timetables" (PDF) (3rd ed.). House of Commons Library. 25 March 1997. Retrieved 3 July 2022.
- ^ Includes Percy McDougall, who was not formally endorsed by Lloyd George's group, but used the same Independent Liberal label while running in Manchester Rusholme
- ^ Tetteh, Edmund (1 February 2008). "Election Statistics: UK 1918–2007". parliament.uk. Retrieved 5 May 2018.
- ^ The seat and vote count figures for the Conservatives given here include the Speaker of the House of Commons
Further reading
- ISBN 0900178302
- Fry, Geoffrey K. (1991), "A Reconsideration of the British General Election of 1935 and the Electoral Revolution of 1945", History, 76 (246): 43–55,
- ISBN 0709903413


