1968 Swedish general election
| ||||||||||||||||||||||||||||||||||||||||||||||||||||||||||||||||||||
All 233 seats in the Andra kammaren of the Riksdag 117 seats needed for a majority | ||||||||||||||||||||||||||||||||||||||||||||||||||||||||||||||||||||
|---|---|---|---|---|---|---|---|---|---|---|---|---|---|---|---|---|---|---|---|---|---|---|---|---|---|---|---|---|---|---|---|---|---|---|---|---|---|---|---|---|---|---|---|---|---|---|---|---|---|---|---|---|---|---|---|---|---|---|---|---|---|---|---|---|---|---|---|---|
| ||||||||||||||||||||||||||||||||||||||||||||||||||||||||||||||||||||
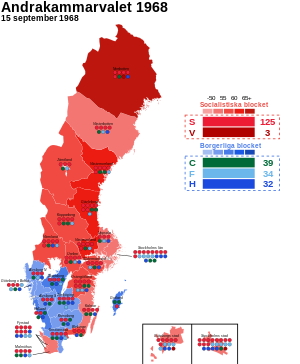
 Largest bloc and seats won by constituency | ||||||||||||||||||||||||||||||||||||||||||||||||||||||||||||||||||||
| ||||||||||||||||||||||||||||||||||||||||||||||||||||||||||||||||||||
General elections were held in
Prague spring, it resulted in a landslide victory for the Social Democratic government and Prime Minister Tage Erlander. It is one of two general elections in Swedish history where a single party received more than half of the vote (the other being the election of 1940
). Erlander would resign the following year after an uninterrupted tenure of 23 years as head of government.
The Social Democrats had held the office of Prime Minister since 1932 except a three-month "holiday cabinet" in 1936. This was due to the Social Democrats'
county council elections. The latter gave them the majority in the upper house, the First Chamber. When they did not have an absolute majority, the Social Democrats could rely on a passive support from the Communists as the Social Democrats almost always nearly had half of the seats. The two socialist parties in the Riksdag did not however win a majority in the general elections of 1952 and 1956
.
Results
 | |||||
|---|---|---|---|---|---|
| Party | Votes | % | Seats | +/– | |
| Swedish Social Democratic Party | 2,420,277 | 50.12 | 125 | +12 | |
| Centre Party | 757,215 | 15.68 | 39 | +3 | |
| People's Party | 688,456 | 14.26 | 34 | –9 | |
| Right Party | 621,031 | 12.86 | 32 | –1 | |
| Left Party Communists | 145,172 | 3.01 | 3 | –5 | |
| Civic Unity[a] | 82,082 | 1.70 | – | – | |
| Christian Democratic Unity | 72,377 | 1.50 | 0 | 0 | |
| Middle Parties[b] | 41,307 | 0.86 | – | – | |
| Other parties | 1,462 | 0.03 | 0 | 0 | |
| Total | 4,829,379 | 100.00 | 233 | 0 | |
| Valid votes | 4,829,379 | 99.33 | |||
| Invalid/blank votes | 32,522 | 0.67 | |||
| Total votes | 4,861,901 | 100.00 | |||
| Registered voters/turnout | 5,445,333 | 89.29 | |||
| Source: Nohlen & Stöver | |||||
Notes
References
- ISBN 978-3-8329-5609-7
- ^ Nohlen & Stöver, p1861


