
1973 Swedish general election
| ||||||||||||||||||||||||||||||||||||||||||||||||||||||||||||||||||||
All 350 seats in the Riksdag 176 seats needed for a majority | ||||||||||||||||||||||||||||||||||||||||||||||||||||||||||||||||||||
|---|---|---|---|---|---|---|---|---|---|---|---|---|---|---|---|---|---|---|---|---|---|---|---|---|---|---|---|---|---|---|---|---|---|---|---|---|---|---|---|---|---|---|---|---|---|---|---|---|---|---|---|---|---|---|---|---|---|---|---|---|---|---|---|---|---|---|---|---|
| ||||||||||||||||||||||||||||||||||||||||||||||||||||||||||||||||||||
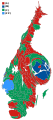
 Map of the election, showing the distribution of constituency and levelling seats, as well as the largest political bloc within each constituency. | ||||||||||||||||||||||||||||||||||||||||||||||||||||||||||||||||||||
| ||||||||||||||||||||||||||||||||||||||||||||||||||||||||||||||||||||
.jpg)

.jpg)

General elections were held in Sweden on 16 September 1973.[1] The Social Democrats remained the largest party, winning 156 of the 350 seats.
For most of the campaign, the opposition parties had led the socialist parties in the polls. It has been speculated that several events influenced the outcome of the election in favour of the government: the death of King Gustaf VI Adolf the previous day, the Norrmalmstorg robbery and the 1973 Chilean coup d'état. Prime Minister Olof Palme had delivered an impassioned speech on Salvador Allende's legacy on the eve of the election, in which he praised the democratic system.
The elections instead produced a draw, with the socialist and liberal-conservative blocs each winning 175 seats.[2] Since the opposition could not pass a motion of no confidence against Palme's government, he was able to remain in power. In order to pass legislation the Social Democrats had to draw lots or seek support from the opposition. To prevent this scenario from reoccurring, the number of seats in the Riksdag was adjusted to an odd number for subsequent elections. In the popular vote, while winning an equal number of seats the socialist bloc won 2,522,656 votes to the 2,518,858 for the liberal-conservative bloc, a net difference of 3,798 votes or 48.80% versus 48.73%, although the seats ended up being shared equally because of the narrow margin.
Results
 | |||||
|---|---|---|---|---|---|
| Party | Votes | % | Seats | +/– | |
| Swedish Social Democratic Party | 2,247,727 | 43.56 | 156 | –7 | |
| Centre Party | 1,295,246 | 25.10 | 90 | +19 | |
| Moderate Party | 737,584 | 14.29 | 51 | +10 | |
| People's Party | 486,028 | 9.42 | 34 | –24 | |
| Left Party Communists | 274,929 | 5.33 | 19 | +2 | |
| Christian Democratic Unity | 90,388 | 1.75 | 0 | 0 | |
| Communist Party | 18,923 | 0.37 | 0 | 0 | |
| Communist League Marxist-Leninist (Revolutionaries) | 8,014 | 0.16 | 0 | New | |
| Other parties | 1,307 | 0.03 | 0 | 0 | |
| Total | 5,160,146 | 100.00 | 350 | 0 | |
| Valid votes | 5,160,146 | 99.83 | |||
| Invalid/blank votes | 8,850 | 0.17 | |||
| Total votes | 5,168,996 | 100.00 | |||
| Registered voters/turnout | 5,690,333 | 90.84 | |||
| Source: Nohlen & Stöver | |||||
Seat distribution
| Constituency | Total seats |
Seats won | |||||||
|---|---|---|---|---|---|---|---|---|---|
| By party | By coalition | ||||||||
| S | C | M | F | V | Left | Right | |||
Älvsborg North
|
9 | 4 | 3 | 1 | 1 | 4 | 5 | ||
Älvsborg South
|
7 | 3 | 2 | 2 | 3 | 4 | |||
| Blekinge | 7 | 3 | 2 | 1 | 1 | 3 | 4 | ||
Bohus
|
11 | 4 | 3 | 2 | 2 | 4 | 7 | ||
| Fyrstadskretsen | 21 | 10 | 4 | 4 | 2 | 1 | 11 | 10 | |
| Gävleborg | 13 | 7 | 3 | 1 | 1 | 1 | 8 | 5 | |
| Gothenburg | 20 | 8 | 3 | 3 | 4 | 2 | 10 | 10 | |
| Gotland | 2 | 1 | 1 | 1 | 1 | ||||
| Halland | 8 | 3 | 3 | 1 | 1 | 3 | 5 | ||
| Jämtland | 5 | 3 | 2 | 3 | 2 | ||||
| Jönköping | 13 | 5 | 4 | 2 | 2 | 5 | 8 | ||
| Kalmar | 10 | 5 | 3 | 2 | 5 | 5 | |||
Kopparberg
|
13 | 6 | 4 | 1 | 1 | 1 | 7 | 6 | |
| Kristianstad | 12 | 5 | 4 | 2 | 1 | 5 | 7 | ||
| Kronoberg | 7 | 3 | 3 | 1 | 3 | 4 | |||
| Malmöhus | 12 | 5 | 4 | 2 | 1 | 5 | 7 | ||
| Norrbotten | 11 | 6 | 2 | 1 | 2 | 8 | 3 | ||
| Örebro | 12 | 6 | 3 | 1 | 1 | 1 | 7 | 5 | |
| Östergötland | 16 | 8 | 4 | 2 | 1 | 1 | 9 | 7 | |
Skaraborg
|
11 | 4 | 4 | 2 | 1 | 4 | 7 | ||
| Södermanland | 11 | 5 | 2 | 1 | 1 | 5 | 4 | ||
| Stockholm County | 32 | 12 | 7 | 6 | 4 | 3 | 15 | 17 | |
| Stockholm Municipality | 34 | 13 | 5 | 8 | 4 | 4 | 17 | 17 | |
| Uppsala | 9 | 4 | 3 | 1 | 1 | 4 | 5 | ||
Värmland
|
12 | 6 | 3 | 1 | 1 | 1 | 7 | 5 | |
| Västerbotten | 10 | 5 | 3 | 1 | 1 | 5 | 5 | ||
| Västernorrland | 12 | 6 | 3 | 1 | 1 | 1 | 7 | 5 | |
| Västmanland | 12 | 6 | 3 | 1 | 1 | 1 | 7 | 5 | |
| Total | 350 | 156 | 90 | 51 | 34 | 19 | 175 | 175 | |
| Source: Statistics Sweden | |||||||||
By municipality
-
 Votes by municipality. The municipalities are the color of the party that got the most votes within the coalition that won relative majority.
 -
 Cartogram of the map to the left with each municipality rescaled to the number of valid votes cast.
 -
 Votes by municipality as a scale from red/Left-wing bloc to blue/Centre-right bloc.
 -
 Cartogram of vote with each municipality rescaled in proportion to number of valid votes cast. Deeper blue represents a greater relative majority for the centre-right coalition, brighter red represents a greater relative majority for the left-wing coalition.


References
- ISBN 978-3-8329-5609-7
- ^ 1976 Inter-Parliamentary Union
| General elections | |
|---|---|
| Local elections | |
| European elections | |
| Referendums | |