Antarctic ice sheet
| Antarctic Ice Sheet | |
|---|---|
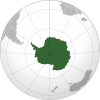
ice shelves in gray, and ice-free land in brown. | |
| Type | Ice sheet |
| Location | Antarctica |
| Area | 14×106 km2 (5.4×10⁶ sq mi)[3] |
| Thickness | 2.2 km (1.4 mi) on average,[3] 4.9 km (3.0 mi) at maximum[2] |
| Status | Ongoing net loss of ice, regionally variable[4][5] |
The Antarctic ice sheet is a
Because the East Antarctic ice sheet is over 10 times larger than the West Antarctic ice sheet and located at a higher elevation, it is less vulnerable to climate change than the WAIS. In the 20th century, EAIS had been one of the only places on Earth which displayed limited cooling instead of warming, even as the WAIS warmed by over 0.1 °C/decade from 1950s to 2000, with an average warming trend of >0.05 °C/decade since 1957 across the whole continent. As of early 2020s, there is still net mass gain over the EAIS (due to increased precipitation freezing on top of the ice sheet), yet the ice loss from the WAIS glaciers such as Thwaites and Pine Island Glacier is far greater.
By 2100, net ice loss from Antarctica alone would add around 11 cm (5 in) to the global
Geography

The Antarctic ice sheet covers an area of almost 14 million square kilometres (5.4 million square miles) and contains 26.5 million cubic kilometres (6,400,000 cubic miles) of ice.[6] A cubic kilometer of ice weighs approximately 0.92 metric gigatonnes, meaning that the ice sheet weighs about 24,380,000 gigatonnes. This ice is equivalent to around 61% of all fresh water on Earth.[7] The only other currently existing ice sheet on Earth is the Greenland ice sheet in the Arctic.[8]
The Antarctic ice sheet is divided by the Transantarctic Mountains into two unequal sections called the East Antarctic Ice Sheet (EAIS) and the smaller West Antarctic Ice Sheet (WAIS). Some glaciologists consider ice cover over the relatively small Antarctic Peninsula (also in West Antarctica) to be the third ice sheet in Antarctica,[9][10]: 2234 in part because its drainage basins are very distinct from the WAIS.[5] Collectively, these ice sheets have an average thickness of around 2 kilometres (1.2 mi),[3] Even the Transantarctic Mountains are largely covered by ice, with only some mountain summits and the McMurdo Dry Valleys being ice-free in the present. Some coastal areas also have exposed bedrock that is not covered by ice.[11] During the Late Cenozoic Ice Age, many of those areas had been covered by ice as well.[12][13]
The EAIS rests on a major land mass, but the bed of the WAIS is, in places, more than 2,500 meters (8,200 feet) below
Warming over the ice sheet


Antarctica is the coldest and driest continent on Earth, as well as the one with the highest average elevation.[19] Because Antarctica is so dry, there is little water vapor, so its air doesn't conduct heat well.[18] Further, it is surrounded by the Southern Ocean, which is far more effective at absorbing heat than any other ocean.[20] It also has extensive year-around sea ice, which has a high albedo (reflectivity) and adds to the albedo of the ice's sheet own bright, white surface.[19] Antarctica is so cold that it is the only place on Earth where atmospheric temperature inversion occurs every winter.[19] Elsewhere, the atmosphere on Earth is at its warmest near the surface and it becomes cooler as elevation increases. During the Antarctic winter, the surface of central Antarctica instead becomes cooler than middle layers of the atmosphere.[18] This means that greenhouse gases trap heat in the middle atmosphere and reduce its flow towards the surface and towards space, instead of simply preventing the flow of heat from the lower atmosphere to the upper layers. This effect lasts until the end of the Antarctic winter.[18][19] Thus, even the early climate models predicted that temperature trends over Antarctica would emerge slower and be more subtle than they are elsewhere.[21]
Moreover, there were fewer than twenty permanent

A 2002 analysis led by
By 2009, research was finally able to combine historical weather station data with satellite measurements to create consistent temperature records going back to 1957, which demonstrated warming of >0.05 °C/decade since 1957 across the continent, with cooling in East Antractica offset by the average temperature increase of at least 0.176 ± 0.06 °C per decade in West Antarctica.[27][43] Subsequent research confirmed clear warming over West Antarctica in the 20th century with the only uncertainty being the magnitude.[44] Over 2012-2013, estimates based on WAIS Divide ice cores and the revised Byrd Station temperature record even suggested a much larger West Antarctica warming of 2.4 °C (4.3 °F) since 1958, or around 0.46 °C (0.83 °F) per decade,[45][46][47][48] although there has been some uncertainty about it.[49] In 2022, a study narrowed the warming of the Central area of the West Antarctic Ice Sheet between 1959 and 2000 to 0.31 °C (0.56 °F) per decade, and conclusively attributed it to increases in greenhouse gas concentrations caused by human activity.[50]

Local changes in atmospheric circulation patterns like the
Ice loss and accumulation
Near-future sea level rise

Weakening Antarctic circulation

Ice loss from Antarctica also generates more fresh

While these effects weren't fully caused by climate change, with some role played by the natural cycle of
It is possible that the South Ocean overturning circulation may not simply continue to weaken in response to increased warming and freshening, but will eventually collapse outright, in a way which would be difficult to reverse and constitute an example of
Long-term future

Sea level rise will continue well after 2100, but potentially at very different rates. According to the most recent reports of the
Over even longer timescales,
The only way to reverse ice loss from West Antarctica once triggered is by lowering the global temperature to 1 °C (1.8 °F) below the preindustrial level. This would be 2 °C (3.6 °F) below the temperature of 2020.
If global warming were to reach higher levels, then the EAIS would play an increasingly larger role in sea level rise occurring after 2100. According to the most recent reports of the
Sustained ice loss from the EAIS would begin with the significant erosion of the so-called subglacial basins, such as
The entire East Antarctic Ice Sheet holds enough ice to raise global sea levels by 53.3 m (175 ft).
Situation during geologic time scales
The icing of Antarctica began in the Late Palaeocene or middle
The Western Antarctic ice sheet declined somewhat during the warm early Pliocene epoch, approximately five to three million years ago; during this time the Ross Sea opened up.[128] But there was no significant decline in the land-based Eastern Antarctic ice sheet.[129]
See also
- Bibliography of Antarctica
- Filchner-Ronne Ice Shelf
- Geography of Antarctica
- List of glaciers in the Antarctic
- Ross Ice Shelf
- Subglacial lake
References
- ^ a b Starr, Cindy (4 June 2013). "Antarctic Bedrock: Bedmap2 Surface Elevation". Scientific Visualization Studio. NASA.
Since 2009, NASA's mission Operation IceBridge (OIB) has flown aircraft over the Antarctic Ice Sheet carrying laser and ice-penetrating radar instruments to collect data about the surface height, bedrock topography and ice thickness.
- ^ ISSN 1994-0424.
- ^ a b c "Ice Sheets". National Science Foundation.
- .
- ^ PMC 6347714.
- ^ Amos, Jonathan (2013-03-08). "Antarctic ice volume measured". BBC News. Retrieved 2014-01-28.
- ^ (PDF) from the original on 16 February 2020. Retrieved 6 January 2014.
- The University of Manchester. Archivedfrom the original on 7 December 2023. Retrieved 7 December 2023.
- ^ Shepherd, Andrew (18 January 2024). "Antarctica and Greenland Ice Sheet Drainage Basins". imbie.org. Retrieved 31 January 2024.
Antarctica is divided into the West Antarctic Ice Sheet, East Antarctic Ice Sheet and Antarctic Peninsula based on historical definitions plus information from modern-day DEM and ice velocity data.
- ^ IPCC, 2021: Annex VII: Glossary [Matthews, J.B.R., V. Möller, R. van Diemen, J.S. Fuglestvedt, V. Masson-Delmotte, C. Méndez, S. Semenov, A. Reisinger (eds.)]. In Climate Change 2021: The Physical Science Basis. Contribution of Working Group I to the Sixth Assessment Report of the Intergovernmental Panel on Climate Change [Masson-Delmotte, V., P. Zhai, A. Pirani, S.L. Connors, C. Péan, S. Berger, N. Caud, Y. Chen, L. Goldfarb, M.I. Gomis, M. Huang, K. Leitzell, E. Lonnoy, J.B.R. Matthews, T.K. Maycock, T. Waterfield, O. Yelekçi, R. Yu, and B. Zhou (eds.)]. Cambridge University Press, Cambridge, United Kingdom and New York, NY, USA, pp. 2215–2256, doi:10.1017/9781009157896.022.
- doi:10.3133/pp1386B.
- ISBN 9781118668313.
- ISSN 0277-3791.
- ^ Hale, George (19 November 2014). "East and West: The Geography of Antarctica". Operation IceBridge. National Aeronautics and Space Administration. Retrieved 31 January 2024.
- ^ "Antarctic and Greenland Drainage Systems". NASA Earth Sciences. Goddard Earth Sciences Division Projects: Cryospheric Sciences. 19 January 2024. Retrieved 31 January 2024.
Our definitions of the West Antarctic ice sheet (systems 18-23 and 1), the East Antarctic ice sheet (systems 2-17), and the Antarctic Peninsula (systems 24-27) allocate the drainage systems according to ice provenance with separation of East and West Antarctica approximately along the Transantarctic Mountains.
- ^ "The "Unstable" West Antarctic Ice Sheet: A Primer". NASA. 12 May 2014. Retrieved 8 July 2023.
- Earth Observatory Newsroom. Archived from the originalon 20 September 2008. Retrieved 2008-08-14.
- ^ PMC 7580794.
- ^ S2CID 222179485.
- S2CID 229063736.
- ISBN 978-0-521-80767-8. Archived from the originalon 2016-03-30. Retrieved 2019-12-18.
- ^ J. H. Christensen; B. Hewitson; A. Busuioc; A. Chen; X. Gao; I. Held; R. Jones; R.K. Kolli; W.-T. Kwon; R. Laprise; V. Magaña Rueda; L. Mearns; C. G. Menéndez; J. Räisänen; A. Rinke; A. Sarr; P. Whetton (2007). Regional Climate Projections (In: Climate Change 2007: The Physical Science Basis. Contribution of Working Group I to the Fourth Assessment Report of the Intergovernmental Panel on Climate Change) (PDF) (Report). Archived from the original (PDF) on 15 December 2007. Retrieved 2007-11-05.
- .
- ^ "Impacts of climate change". Discovering Antarctica. Retrieved 15 May 2022.
- . PDF available at AMS Online
- S2CID 7732719. Archived from the original(PDF) on 2011-08-11. Retrieved 14 August 2008. PDF available at Annular Modes Website
- ^ a b Steig, Eric; Schneider, David; Rutherford, Scott; Mann, Michael E.; Comiso, Josefino; Shindell, Drew (1 January 2009). "Warming of the Antarctic ice-sheet surface since the 1957 International Geophysical Year". Arts & Sciences Faculty Publications.
- ^ S2CID 387284. Archived from the original(PDF) on 11 December 2004.
- S2CID 219738421.
- ^ "Scientific winds blow hot and cold in Antarctica". CNN. 2002-01-25. Retrieved 2013-04-13.
- ^ Chang, Kenneth (2002-04-02). "The Melting (Freezing) of Antarctica; Deciphering Contradictory Climate Patterns Is Largely a Matter of Ice". The New York Times. Retrieved 2013-04-13.
- ^ Derbyshire, David (2002-01-14). "Antarctic cools in warmer world". The Daily Telegraph. London. Archived from the original on 2014-06-02. Retrieved 2013-04-13.
- ^ Peter N. Spotts (2002-01-18). "Guess what? Antarctica's getting colder, not warmer". The Christian Science Monitor. Retrieved 2013-04-13.
- National Geographic. Archived from the originalon January 28, 2002. Retrieved 13 April 2013.
- ^ "Antarctic cooling pushing life closer to the edge". USA Today. 16 January 2002. Retrieved 13 April 2013.
- ^ a b Peter Doran (2006-07-27). "Cold, Hard Facts". The New York Times. Archived from the original on April 11, 2009. Retrieved 2008-08-14.
- ^ Davidson, Keay (2002-02-04). "Media goofed on Antarctic data / Global warming interpretation irks scientists". San Francisco Chronicle. Retrieved 2013-04-13.
- ISBN 978-0-06-621413-9.huge icebergs. That's what gets reported year after year. But the continent as a whole is getting colder, and the ice is getting thicker. First Edition
The data show that one relatively small area called the Antarctic Peninsula is melting and calving
- Real Climate. Retrieved 2008-08-14.
At first glance this seems to contradict the idea of "global" warming, but one needs to be careful before jumping to this conclusion. A rise in the global mean temperature does not imply universal warming. Dynamical effects (changes in the winds and ocean circulation) can have just as large an impact, locally as the radiative forcing from greenhouse gases. The temperature change in any particular region will in fact be a combination of radiation-related changes (through greenhouse gases, aerosols, ozone and the like) and dynamical effects. Since the winds tend to only move heat from one place to another, their impact will tend to cancel out in the global mean.
- ^ "America Reacts To Speech Debunking Media Global Warming Alarmism". U.S. Senate Committee on Environment and Public Works. 2006-09-28. Archived from the original on 2013-03-05. Retrieved 2013-04-13.
- ^ "Climate Change—Our Research". British Antarctic Survey. Archived from the original on 2006-02-07.
- ^ NASA (2007). "Two Decades of Temperature Change in Antarctica". Earth Observatory Newsroom. Archived from the original on 20 September 2008. Retrieved 2008-08-14. NASA image by Robert Simmon, based on data from Joey Comiso, GSFC.
- ^ Kenneth Chang (21 January 2009). "Warming in Antarctica Looks Certain". The New York Times. Archived from the original on 13 November 2014. Retrieved 13 April 2013.
- doi:10.1038/ngeo1129.
- .
- . RealClimate. Retrieved 20 January 2013.
- S2CID 21537289.
- ^ McGrath, Matt (23 December 2012). "West Antarctic Ice Sheet warming twice earlier estimate". BBC News. Retrieved 16 February 2013.
- S2CID 131723421.
- S2CID 251854055.
- ^ .
- S2CID 205249862.
- PMID 27443735.
- .
- ^ Chang, Kenneth (2002-05-03). "Ozone Hole Is Now Seen as a Cause for Antarctic Cooling". The New York Times. Retrieved 2013-04-13.
- .
- S2CID 40243634.
- ^ Meredith, M.; Sommerkorn, M.; Cassotta, S; Derksen, C.; et al. (2019). "Chapter 3: Polar Regions" (PDF). IPCC Special Report on the Ocean and Cryosphere in a Changing Climate. p. 212.
- S2CID 258777741.
- S2CID 220261150.
- S2CID 220260051.
- ^ Larson, Christina (8 February 2020). "Antarctica appears to have broken a heat record". phys.org.
- S2CID 236282417.
- PMID 31996825.
- .
Medium-range estimates of Arctic carbon emissions could result from moderate climate emission mitigation policies that keep global warming below 3°C (e.g., RCP4.5). This global warming level most closely matches country emissions reduction pledges made for the Paris Climate Agreement...
- Cosmos. Retrieved 30 September 2023.predicts 2.5 to 2.9°C of warming based on current policies and action, with pledges and government agreements taking this to 2.1°C.
"The IPCC doesn't make projections about which of these scenarios is more likely, but other researchers and modellers can. The Australian Academy of Science, for instance, released a report last year stating that our current emissions trajectory had us headed for a 3°C warmer world, roughly in line with the middle scenario. Climate Action Tracker
- S2CID 4414976.
- ^ S2CID 49188002.
- .
Although their methods of interpolation or extrapolation for areas with unobserved output velocities have an insufficient description for the evaluation of associated errors, such errors in previous results (Rignot and others, 2008) caused large overestimates of the mass losses as detailed in Zwally and Giovinetto (Zwally and Giovinetto, 2011).
- ^ a b c d Fox-Kemper, B.; Hewitt, H.T.; Xiao, C.; Aðalgeirsdóttir, G.; Drijfhout, S.S.; Edwards, T.L.; Golledge, N.R.; Hemer, M.; Kopp, R.E.; Krinner, G.; Mix, A. (2021). Masson-Delmotte, V.; Zhai, P.; Pirani, A.; Connors, S.L.; Péan, C.; Berger, S.; Caud, N.; Chen, Y.; Goldfarb, L. (eds.). "Chapter 9: Ocean, Cryosphere and Sea Level Change" (PDF). Climate Change 2021: The Physical Science Basis. Contribution of Working Group I to the Sixth Assessment Report of the Intergovernmental Panel on Climate Change. Cambridge University Press, Cambridge, UK and New York, NY, USA: 1270–1272.
- PMID 30013142.
- PMID 31285345.
- ^ Perkins, Sid (June 17, 2021). "Collapse may not always be inevitable for marine ice cliffs". ScienceNews. Retrieved 9 January 2023.
- .
- PMID 31110015.
- S2CID 218541055.
- S2CID 233868268.
- PMID 29724994.
- ^ ISBN 9781009157896.
- PMID 35013425.
- S2CID 205250191.
- ^ S2CID 257807573.
- S2CID 244726388.
- PMID 29675467.
- S2CID 237695196.
- PMID 32934273.
- ISSN 1758-6798.
- .
- ^ NOAA. 29 March 2023.
- .
- ^ Silvano, Alessandro; Meijers, Andrew J. S.; Zhou, Shenjie (17 June 2023). "Slowing deep Southern Ocean current may be linked to natural climate cycle—but melting Antarctic ice is still a concern". The Conversation.
- PMID 35039511.
- ^ a b Logan, Tyne (29 March 2023). "Landmark study projects 'dramatic' changes to Southern Ocean by 2050". ABC News.
- S2CID 133069692.
- ^ Lenton, T. M.; Armstrong McKay, D.I.; Loriani, S.; Abrams, J.F.; Lade, S.J.; Donges, J.F.; Milkoreit, M.; Powell, T.; Smith, S.R.; Zimm, C.; Buxton, J.E.; Daube, Bruce C.; Krummel, Paul B.; Loh, Zoë; Luijkx, Ingrid T. (2023). The Global Tipping Points Report 2023 (Report). University of Exeter.
- S2CID 255028552.
- ^ a b "Anticipating Future Sea Levels". EarthObservatory.NASA.gov. National Aeronautics and Space Administration (NASA). 2021. Archived from the original on 7 July 2021.
- (PDF) from the original on 16 February 2020. Retrieved 6 January 2014.
- S2CID 11083712.
- ^ Voosen, Paul (2018-12-18). "Discovery of recent Antarctic ice sheet collapse raises fears of a new global flood". Science. Retrieved 2018-12-28.
- PMID 32047039.
- ^ Carlson, Anders E; Walczak, Maureen H; Beard, Brian L; Laffin, Matthew K; Stoner, Joseph S; Hatfield, Robert G (10 December 2018). Absence of the West Antarctic ice sheet during the last interglaciation. American Geophysical Union Fall Meeting.
- S2CID 266436146.
- ^ AHMED, Issam. "Antarctic octopus DNA reveals ice sheet collapse closer than thought". phys.org. Retrieved 2023-12-23.
- S2CID 264476246.
- ^ Poynting, Mark (24 October 2023). "Sea-level rise: West Antarctic ice shelf melt 'unavoidable'". BBC. Retrieved 26 October 2023.
- S2CID 221885420.
- PMID 37007716.
- PMID 37091546.
- S2CID 252161375.
- ^ Armstrong McKay, David (9 September 2022). "Exceeding 1.5°C global warming could trigger multiple climate tipping points – paper explainer". climatetippingpoints.info. Retrieved 2 October 2022.
- PMID 33931453.
- PMID 36088458.
- ^ a b Fox-Kemper, B.; Hewitt, H.T.; Xiao, C.; Aðalgeirsdóttir, G.; Drijfhout, S.S.; Edwards, T.L.; Golledge, N.R.; Hemer, M.; Kopp, R.E.; Krinner, G.; Mix, A. (2021). Masson-Delmotte, V.; Zhai, P.; Pirani, A.; Connors, S.L.; Péan, C.; Berger, S.; Caud, N.; Chen, Y.; Goldfarb, L. (eds.). "Chapter 9: Ocean, Cryosphere and Sea Level Change" (PDF). Climate Change 2021: The Physical Science Basis. Contribution of Working Group I to the Sixth Assessment Report of the Intergovernmental Panel on Climate Change. Cambridge University Press, Cambridge, UK and New York, NY, USA: 1270–1272.
- ^ S2CID 252161375.
- hdl:10278/5003813.
- ^ a b c d Armstrong McKay, David (9 September 2022). "Exceeding 1.5°C global warming could trigger multiple climate tipping points – paper explainer". climatetippingpoints.info. Retrieved 2 October 2022.
- .
- ISSN 1994-0424.
- S2CID 221885420.
- PMID 36130952.
- ^ Sedimentological evidence for the formation of an East Antarctic ice sheet in Eocene/Oligocene time Archived 2012-06-16 at the Wayback Machine Palaeogeography, palaeoclimatology, & palaeoecology ISSN 0031-0182, 1992, vol. 93, no1-2, pp. 85–112 (3 p.)
- ^ "New CO2 data helps unlock the secrets of Antarctic formation". phys.org. September 13, 2009. Retrieved 2023-06-06.
- S2CID 206533232. Retrieved 2014-01-28.
- S2CID 830008.
- .
- S2CID 4326971.
- S2CID 15213187.
- S2CID 49185845.