
Galton board

The Galton board, also known as the Galton box or quincunx or bean machine, is a device invented by Sir Francis Galton[1] to demonstrate the central limit theorem, in particular that with sufficient sample size the binomial distribution approximates a normal distribution. Among its applications, it afforded insight into regression to the mean or "reversion to mediocrity".
Description
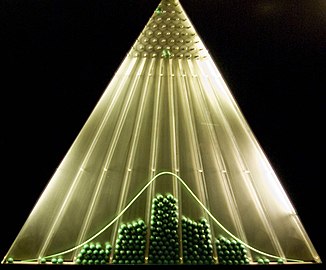
The Galton board consists of a vertical board with interleaved rows of pegs. Beads are dropped from the top and, when the device is level, bounce either left or right as they hit the pegs. Eventually they are collected into bins at the bottom, where the height of bead columns accumulated in the bins approximate a bell curve. Overlaying Pascal's triangle onto the pins shows the number of different paths that can be taken to get to each bin.[2]
Large-scale working models of this device created by
Boards can be constructed for other distributions by changing the shape of the pins or biasing them towards one direction, and even bimodal boards are possible.[7] A board for the log-normal distribution (common in many natural processes, particularly biological ones), which uses isosceles triangles of varying widths to 'multiply' the distance the bead travels instead of fixed sizes steps which would 'sum', was constructed by Jacobus Kapteyn while studying and popularizing the statistics of the log-normal in order to help visualize it and demonstrate its plausibility.[8] As of 1963, it was preserved in the University of Groningen.[9] There is also an improved log-normal machine that uses skewed triangles whose right sides are longer, and thus avoiding shifting the median of the beads to the left.[10]
Distribution of the beads
If a bead bounces to the right k times on its way down (and to the left on the remaining pegs) it ends up in the kth bin counting from the left. Denoting the number of rows of pegs in a Galton Board by n, the number of paths to the kth bin on the bottom is given by the binomial coefficient . Note that the leftmost bin is the 0-bin, next to it is the 1-bin, etc. and the furthest one to the right is the n-bin - making thus the total number of bins equal to n+1 (each row does not need to have more pegs than the number that identifies the row itself, e.g. the first row has 1 peg, the second 2 pegs, until the n-th row that has n pegs which correspond to the n+1 bins). If the probability of bouncing right on a peg is p (which equals 0.5 on an unbiased level machine) the probability that the ball ends up in the kth bin equals . This is the probability mass function of a binomial distribution. The number of rows correspond to the size of a binomial distribution in number of trials, while the probability p of each pin is the binomial's p.


According to the
Another interpretation more accurate from the physical view is given by the Entropy: since the energy that is carried by every falling bead is finite, so even that on any tip their collision are chaotic because the derivative is undefined (there is no way to previously figure out for which side is going to fall), the mean and variance of each bean is restricted to be finite (they will never bound out of the box), so the Gaussian shape arises because it is the maximum entropy probability distribution for a continuous process with defined mean and variance. So, the rise of the normal distribution could be interpreted as that all possible information carried by each bean related to which path it has travel have been already completely lost through their downhill collisions.
Examples
-
 Galton Board (7.5 in by 4.5 in)
 -
 Before and after the spin
 -
 A working replica of the machine (following a slightly modified design)
 -
 The quincunx, as drawn by Sir Francis Galton

.jpg)

_-_Galton_1889_diagram.png)
History
Order in Apparent Chaos: I know of scarcely anything so apt to impress the imagination as the wonderful form of cosmic order expressed by the Law of Frequency of Error. The law would have been personified by the Greeks and deified, if they had known of it. It reigns with serenity and in complete self-effacement amidst the wildest confusion. The huger the mob, and the greater the apparent anarchy, the more perfect is its sway. It is the supreme law of Unreason. Whenever a large sample of chaotic elements are taken in hand and marshalled in the order of their magnitude, an unsuspected and most beautiful form of regularity proves to have been latent all along.[1]: 66
Games
Several games have been developed utilizing the idea of pins changing the route of balls or other objects:
References
- ^ ISBN 978-1297895982
- ^ "The Galton Board". www.galtonboard.com. Four Pines Publishing, Inc. Retrieved 2018-03-06.
- ^ "Henry Ford museum acquires Eames' Mathematica exhibit". Auction Central News. LiveAuctioneers. 20 March 2015. Retrieved 2018-03-06.
- ^ "Pavilions & Attractions - IBM - Page Six". New York World's Fair. Retrieved 22 December 2011.
- ^ "Mathematica Exhibition from the Office of Charles and Ray Eames Opens inside Henry Ford Museum of American Innovation, Sept. 23" (press release). Henry Ford Museum of American Innovation. September 21, 2017.
- ^ Archived at Ghostarchive and the Wayback Machine: "IFA.tv - From Chaos to Order on the Galton Board -- A Random Walker". YouTube. 23 December 2009. Retrieved 2018-03-06.
- ^ Brehmer et al 2018, "Mining gold from implicit models to improve likelihood-free inference": "Simulator Mining Example"
- ^ Kapteyn 1903, Skew frequency curves in biology and statistics v1; Kapteyn & van Uven 1916, Skew frequency curves in biology and statistics v2
- ^ Aitchison & Brown 1963, The Lognormal Distribution, with Special Reference to its Uses in Economics Archived 2019-08-02 at the Wayback Machine
- ^ Limpert et al 2001, "Log-normal Distributions across the Sciences: Keys and Clues"
External links
- Galton Board informational website with resource links
- An 8-foot-tall (2.4 m) Sir Francis: the Probability Machine - From Chaos to Order - Randomness in Stock Prices from Index Fund Advisors IFA.com
- Quincunx and its relationship to normal distribution from Math Is Fun
- A multi-stage bean machine simulation (JS)
- Pascal's Marble Run: a deterministic Galton board
- Log-normal Galton board (animation)
- A music video featuring a Galton board by Carl McTague
| Authority control databases: National |
|---|