Cape Palinuro
Cape Palinuro | |
|---|---|
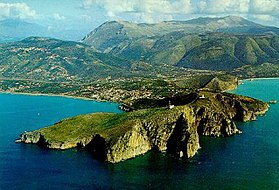
 A view of Capo Palinuro with the lighthouse on the top | |
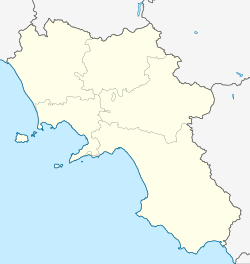
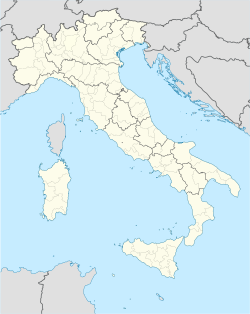
| Coordinates: 40°01′35″N 15°16′30″E / 40.02639°N 15.27500°E |
Cape Palinuro (Italian : Capo Palinuro) is located in southwestern Italy, approximately 50 miles (80 km) southeast of Salerno, in southern part of Cilento region. It is supposedly named after Palinurus, the helmsman of Aeneas' ship in Virgil's Aeneid.[1]
Geography
Located on the Tyrrhenian Sea, the northern side of the cape is the location of Palinuro, a touristic hamlet of Centola. Southern side faces in the Gulf of Policastro, and is 6 km from Marina di Camerota. It features a lighthouse that is the second highest (70 meters or 230 feet), in all of Italy.

Climate
| Climate data for Cabo Palinuro (1991-2020) [i] | |||||||||||||
|---|---|---|---|---|---|---|---|---|---|---|---|---|---|
| Month | Jan | Feb | Mar | Apr | May | Jun | Jul | Aug | Sep | Oct | Nov | Dec | Year |
| Mean daily maximum °C (°F) | 13.3 (55.9) |
13.55 (56.39) |
15.7 (60.3) |
18.5 (65.3) |
22.4 (72.3) |
26.6 (79.9) |
29.3 (84.7) |
29.9 (85.8) |
26.6 (79.9) |
22.6 (72.7) |
18.4 (65.1) |
14.7 (58.5) |
20.96 (69.73) |
| Daily mean °C (°F) | 10.5 (50.9) |
10.4 (50.7) |
12.35 (54.23) |
14.9 (58.8) |
18.7 (65.7) |
22.7 (72.9) |
25.4 (77.7) |
26.1 (79.0) |
22.8 (73.0) |
19.4 (66.9) |
15.4 (59.7) |
11.9 (53.4) |
17.55 (63.58) |
| Mean daily minimum °C (°F) | 7.8 (46.0) |
7.4 (45.3) |
9.2 (48.6) |
11.5 (52.7) |
15.1 (59.2) |
18.9 (66.0) |
21.6 (70.9) |
22.3 (72.1) |
19.1 (66.4) |
16.2 (61.2) |
12.5 (54.5) |
9.3 (48.7) |
14.2 (57.6) |
| Average precipitation mm (inches) | 84.5 (3.33) |
72.6 (2.86) |
67.8 (2.67) |
62.9 (2.48) |
35.9 (1.41) |
19.7 (0.78) |
13.6 (0.54) |
21.5 (0.85) |
59.0 (2.32) |
85.7 (3.37) |
114.5 (4.51) |
94.6 (3.72) |
732.3 (28.84) |
| Average precipitation days (≥ 1.0 mm) | 8.9 | 8.9 | 8.4 | 7.9 | 4.8 | 2.7 | 1.7 | 2.2 | 7.3 | 7.3 | 10.6 | 10.6 | 81.3 |
| Average relative humidity (%)
|
70.9 | 69.37 | 70.98 | 71.56 | 72.61 | 73.03 | 73.07 | 73.9 | 71.79 | 71.15 | 70.98 | 69.72 | 71.59 |
| Average dew point °C (°F) | 4.8 (40.6) |
3.9 (39.0) |
6.1 (43.0) |
8.6 (47.5) |
12.7 (54.9) |
16.1 (61.0) |
19.0 (66.2) |
19.6 (67.3) |
16.4 (61.5) |
12.9 (55.2) |
8.4 (47.1) |
5.4 (41.7) |
11.2 (52.1) |
| Mean monthly sunshine hours | 160.6 | 163.8 | 202.1 | 219.0 | 274.4 | 307.8 | 345.7 | 326.7 | 249.0 | 214.2 | 159.3 | 147.6 | 2,770.2 |
| Source: ) | |||||||||||||
- ^ Precipitation, precipitation days and dew point are for the 1981-2010 period.
See also
References
- ^ Virgil Aeneid, ed. and trans. Dryden, John Perseus Project Retrieved on 1 February 2011.
- )
- )
External links


