
Chino, California
Chino, California | ||
|---|---|---|
 | ||
|
FIPS code 06-13210 | | |
| GNIS feature IDs | 1660477, 2409453 | |
| Website | www | |
Chino (
Chino's surroundings have long been a center of agriculture and dairy farming, providing milk products in Southern California and much of the southwestern United States. Chino's agricultural history dates back to the Spanish land grant forming Rancho Santa Ana del Chino. The area specialized in fruit orchards, row crops, and dairy.
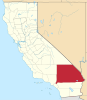
Chino is bounded by Chino Hills and Los Angeles County to the west, Pomona to the northwest, unincorporated San Bernardino County (near Montclair) to the north, including the unincorporated community of Narod, Ontario to the northeast, Eastvale to the southeast in Riverside County and Orange County to the southwest. It is easily accessible via the Chino Valley (71) and Pomona (60) freeways. The population was 91,403 at the 2020 census.[8]
Etymology
The land grant on which the town was founded was called Rancho Santa Ana del Chino. Santa Ana is Spanish for Saint Anne, but the exact meaning of "Chino" has been explained in different ways.[7] One explanation is that the "Chino" (curly-haired person or mixed-race person) was the chief of the local Native American village.[9] The president of the Chino Valley Historical Society, drawing on Civil War-era letters, designates the "curl" referenced in the toponym as that at the top of the grama grass that abounded in the valley.[10]
History
The
Some twenty years later,
Early in the
During the
.jpg)
Richard Gird was the next owner of the Rancho. Beginning in 1887, his land was subdivided and laid out. It became the "Town of Chino", and incorporated into a city in 1910.[12] Sugar beets, corn, and alfalfa were raised there.
The Chino Valley, located at the foot of an alluvial plain with fertile topsoil reaching depths of 4 feet (1.2 m), was an agricultural mecca from the 1890s up through the mid-20th century. Sugar beets were a significant part of the economy in the early 1900s, followed by sweet corn (marketed as "Chino corn" throughout the Pacific coast area), peaches, walnuts, tomatoes, and strawberries. The city's official logo/crest features an overflowing cornucopia.
.jpg)
The dairy industry flourished from the 1950s through the 1980s, with dairy-friendly zoning in the southwest corner of San Bernardino County encouraging many ethnic Dutch families to locate there and become the cornerstone of the industry. Chino's large, highly efficient dairies made it the largest milk-producing community in the nation's largest milk-producing state.
Because of its pastoral setting and rural flavor, Chino was a popular site for Hollywood crews to shoot "Midwestern" settings. 1960s movies included
In the 1970s, Chino developed into a small
On July 11, 2017, in a special election, Chino voters voted against Measure H, which would have allowed 30 acres (12 ha) of rural land located near
Economy
Top employers
According to the city's 2011 Comprehensive Annual Financial Report,[16] the top employers in the city are:
| # | Employer | # of employees |
|---|---|---|
| 1 | Chino Valley Unified School District | Over 1,000 |
| 2 | California Institution for Men | Over 1,000 |
| 3 | California Institution for Women | 500–1,000 |
| 4 | Chino Valley Medical Center | 500–1,000 |
| 5 | Wal-Mart
|
fewer than 500 |
| 6 | Hussmann | fewer than 500 |
| 7 | Best Buy | fewer than 500 |
| 8 | Nature's Best | fewer than 500 |
| 9 | Mission Linen Supply | fewer than 500 |
| 10 | Target | fewer than 500 |
| 11 | Omnia Furniture | fewer than 500 |
| 12 | AEP Industries | fewer than 500 |
| 13 | J. C. Penney
|
fewer than 500 |
| 14 | Farmers Insurance Group | fewer than 500 |
| 15 | ClosetMaid
|
fewer than 500 |
Two California state prisons for adults (California Institution for Men and California Institution for Women[17]), as well as the Heman G. Stark Youth Correctional Facility, lie within the city limits.[18]
Education
Chino is a part of the Chino Valley Unified School District.
Elementary schools
Chino has had 11 elementary schools:
- El Rancho Elementary (closed in 2008–2009 school year[19])
- Alicia Cortez Elementary
- Newman Elementary
- E.J. Marshall Elementary
- Dickson Elementary
- Anna Borba Fundamental
- Howard Cattle Elementary
- Richard Gird Elementary (closed in 2008–2009 school year[20])
- Edwin Rhodes Elementary
- Walnut Avenue Elementary
- Liberty Elementary
Junior High Schools
Chino has four junior high schools:
- Briggs Junior High School
- Ramona Junior High School
- Magnolia Junior High School
- Woodcrest Junior High School
High schools
Chino has three high schools:
- Don Lugo High School
- Buena Vista High School
- Chino High School
Charter Schools
Chino has one charter school:
- Oxford Preparatory Academy (Closed)
- Allegiance STEAM Academy
K-8 Schools
Chino has three K-8 schools:
- Lyle S. Briggs Fundamental School
- Cal Aero Preserve Academy
- Legacy Academy (opening in 2024-2025 school year)
Chino is serviced by a satellite center of
Geography
According to the United States Census Bureau, the city has a total area of 29.7 square miles (77 km2). 29.6 square miles (77 km2) of it is land and 0.04% is water.
- Chino is a San Bernardino.
- Los Angeles, 35 miles (56 km)
- Riverside, 26 miles (42 km)
- Santa Ana, 30 miles (48 km)
- Anaheim, 24 miles (39 km)
Climate
According to the
| Climate data for Chino, California, 1991–2020 normals, extremes 1998–present | |||||||||||||
|---|---|---|---|---|---|---|---|---|---|---|---|---|---|
| Month | Jan | Feb | Mar | Apr | May | Jun | Jul | Aug | Sep | Oct | Nov | Dec | Year |
| Record high °F (°C) | 93 (34) |
95 (35) |
97 (36) |
106 (41) |
104 (40) |
115 (46) |
120 (49) |
115 (46) |
121 (49) |
111 (44) |
100 (38) |
92 (33) |
121 (49) |
| Mean maximum °F (°C) | 83.1 (28.4) |
84.1 (28.9) |
88.9 (31.6) |
95.1 (35.1) |
96.9 (36.1) |
102.8 (39.3) |
105.9 (41.1) |
107.6 (42.0) |
108.3 (42.4) |
100.9 (38.3) |
93.7 (34.3) |
82.9 (28.3) |
111.7 (44.3) |
| Mean daily maximum °F (°C) | 69.5 (20.8) |
69.8 (21.0) |
72.5 (22.5) |
77.0 (25.0) |
81.1 (27.3) |
87.6 (30.9) |
93.7 (34.3) |
96.3 (35.7) |
92.7 (33.7) |
84.5 (29.2) |
76.3 (24.6) |
68.7 (20.4) |
80.8 (27.1) |
| Daily mean °F (°C) | 55.6 (13.1) |
56.4 (13.6) |
59.1 (15.1) |
62.8 (17.1) |
67.7 (19.8) |
73.0 (22.8) |
78.3 (25.7) |
79.8 (26.6) |
76.5 (24.7) |
68.9 (20.5) |
60.7 (15.9) |
54.6 (12.6) |
66.1 (19.0) |
| Mean daily minimum °F (°C) | 41.7 (5.4) |
42.9 (6.1) |
45.8 (7.7) |
48.7 (9.3) |
54.3 (12.4) |
58.5 (14.7) |
62.9 (17.2) |
63.2 (17.3) |
60.4 (15.8) |
53.3 (11.8) |
45.1 (7.3) |
40.4 (4.7) |
51.4 (10.8) |
| Mean minimum °F (°C) | 30.2 (−1.0) |
31.8 (−0.1) |
35.6 (2.0) |
39.1 (3.9) |
45.7 (7.6) |
51.3 (10.7) |
56.1 (13.4) |
56.1 (13.4) |
51.5 (10.8) |
43.2 (6.2) |
35.1 (1.7) |
29.7 (−1.3) |
28.0 (−2.2) |
| Record low °F (°C) | 20 (−7) |
27 (−3) |
28 (−2) |
31 (−1) |
39 (4) |
45 (7) |
50 (10) |
51 (11) |
47 (8) |
33 (1) |
27 (−3) |
23 (−5) |
20 (−7) |
| Average precipitation inches (mm) | 2.17 (55) |
2.68 (68) |
1.43 (36) |
0.55 (14) |
0.17 (4.3) |
0.02 (0.51) |
0.08 (2.0) |
0.01 (0.25) |
0.06 (1.5) |
0.53 (13) |
0.59 (15) |
1.69 (43) |
9.98 (252.56) |
| Average precipitation days (≥ 0.01 in) | 4.8 | 6.2 | 4.7 | 3.6 | 1.4 | 0.3 | 0.3 | 0.2 | 0.7 | 3.0 | 4.4 | 4.9 | 34.5 |
| Source 1: NOAA[22] | |||||||||||||
| Source 2: National Weather Service (mean maxima/minima 2006–2020)[23] | |||||||||||||
Demographics
| Census | Pop. | Note | %± |
|---|---|---|---|
| 1930 | 3,118 | — | |
| 1940 | 4,204 | 34.8% | |
| 1950 | 5,784 | 37.6% | |
| 1960 | 10,305 | 78.2% | |
| 1970 | 20,411 | 98.1% | |
| 1980 | 40,165 | 96.8% | |
| 1990 | 59,682 | 48.6% | |
| 2000 | 67,168 | 12.5% | |
| 2010 | 77,983 | 16.1% | |
| 2020 | 91,403 | 17.2% | |
| U.S. Decennial Census[24] | |||
2020
| Race / Ethnicity (NH = Non-Hispanic) | Pop 2000[25] | Pop 2010[26] | Pop 2020[27] | % 2000 | % 2010 | % 2020 |
|---|---|---|---|---|---|---|
White alone (NH)
|
25,267 | 21,659 | 18,833 | 37.62% | 27.77% | 20.60% |
Black or African American alone (NH)
|
5,100 | 4,529 | 5,212 | 7.59% | 5.81% | 5.70% |
Alaska Native alone (NH)
|
232 | 256 | 256 | 0.35% | 0.33% | 0.28% |
| Asian alone (NH) | 3,242 | 7,932 | 17,255 | 4.83% | 10.17% | 18.88% |
| Pacific Islander alone (NH) | 106 | 112 | 102 | 0.16% | 0.14% | 0.11% |
| Other race alone (NH) | 113 | 210 | 466 | 0.17% | 0.27% | 0.51% |
| Mixed race or Multiracial (NH) | 1,278 | 1,292 | 2,438 | 1.90% | 1.66% | 2.67% |
| Hispanic or Latino (any race) | 31,830 | 41,993 | 46,841 | 47.39% | 53.85% | 51.25% |
| Total | 67,168 | 77,983 | 91,403 | 100.00% | 100.00% | 100.00% |
2010
At the
The census reported that 70,919 people (90.9% of the population) lived in households, 164 (0.2%) lived in non-institutionalized group quarters, and 6,900 (8.8%) were institutionalized.
There were 20,772 households, 9,979 (48.0%) had children under the age of 18 living in them, 12,426 (59.8%) were married couples living together, 3,041 (14.6%) had a female householder with no husband present, 1,469 (7.1%) had a male householder with no wife present. There were 1,185 (5.7%) households of unmarried couples; of which 147 (0.7%) were same-sex. 2,840 households (13.7%) were one person and 1,020 (4.9%) had someone living alone who was 65 or older. The average household size was 3.41. There were 16,936 families (81.5% of households); the average family size was 3.72.
The age distribution was 19,737 people (25.3%) under the age of 18, 8,530 people (10.9%) aged 18 to 24, 25,091 people (32.2%) aged 25 to 44, 18,954 people (24.3%) aged 45 to 64, and 5,671 people (7.3%) who were 65 or older. The median age was 33.2 years. For every 100 females, there were 105.7 males. For every 100 females age 18 and over, there were 105.2 males.
There were 21,797 housing units at an average density of 735.1 per square mile, of the occupied units 14,315 (68.9%) were owner-occupied and 6,457 (31.1%) were rented. The homeowner vacancy rate was 2.1%; the rental vacancy rate was 6.4%. 49,280 people (63.2% of the population) lived in owner-occupied housing units and 21,639 people (27.7%) lived in rental housing units.
According to the 2010 United States Census, Chino had a median household income of $71,671, with 9.6% of the population living below the federal poverty line.[28]
2000
At the
Of the 17,304 households 47.3% had children under the age of 18 living with them, 62.5% were married couples living together, 12.9% had a female householder with no husband present, and 18.5% were non-families. 14.1% of households were one person and 5.2% were one person aged 65 or older. The average household size was 3.4 and the average family size was 3.8.
The age distribution was 28.5% under the age of 18, 12.3% from 18 to 24, 34.2% from 25 to 44, 19.2% from 45 to 64, and 5.9% 65 or older. The median age was 31 years. For every 100 females, there were 124.3 males. For every 100 females age 18 and over, there were 133.1 males.
The median household income was $55,401 and the median family income was $59,638. Males had a median income of $35,855 versus $30,267 for females. The per capita income for the city was $17,574. About 6.3% of families and 8.3% of the population were below the
Government
The city is governed by a five-member council consisting of a mayor plus four councilmembers. The mayor is elected at-large and council members are elected by district; all serve four-year terms. The city manager and city attorney are appointed by the council.[3] The city's elections, which are plurality, are held on a Tuesday after the first Monday in November of even-numbered years.
Federal and state representation
Chino is included in the 35th and 39th congressional districts,[31] which are represented by Norma Torres (D–Pomona) and Mark Takano (D–Riverside), respectively.[32]
In the
Transportation
The Chino Transit Center is located at 6th and Chino Avenue. From there, the #85 and #88 Omnitrans buses connect northbound to the Montclair Transcenter, where many daily Metrolink, Foothill Transit, Omnitrans, and Silver Streak connections are available to downtown Los Angeles and points in between.[33]
Notable people
- guard for the Phoenix Mercury
- NFLplayer
- Shelly Martinez, WWE wrestler
Local attractions
See also
- List of largest California cities by population
References
- ^ "California Cities by Incorporation Date". California Association of Local Agency Formation Commissions. Archived from the original (Word) on November 3, 2014. Retrieved August 25, 2014.
- ^ "City Council". City of Chino, CA. Retrieved January 14, 2015.
- ^ a b "Administration". City of Chino, CA. Retrieved January 14, 2015.
- ^ "2020 U.S. Gazetteer Files". United States Census Bureau. Retrieved October 30, 2021.
- ^ "Chino". Geographic Names Information System. United States Geological Survey, United States Department of the Interior. Retrieved October 22, 2014.
- ^ "U.S. Census Bureau QuickFacts". United States Census Bureau. Retrieved September 26, 2022.
- ^ a b McCombs, Al (July 6, 2019). "Where did Chino's name come from?". Champion Newspapers. Retrieved April 10, 2023.
- ^ "Geography Profile - Chino city, California". Census.gov. Retrieved January 7, 2024.
- ISBN 978-0-520-24217-3.
- ^ Jones, Kay (September 3, 2009). "Why We Celebrate the 1st Territorial Capital Days in Chino". Chino Valley eNews. Archived from the original on July 8, 2011. Retrieved December 1, 2009.
- ^ Rasmussen, Cecilia (February 11, 2001). "A Family Caught in the Middle of a War". Los Angeles Times. p. B13. Retrieved June 24, 2022 – via Newspapers.com.
- ^ Dubois, Phil; Allen P. McCombs. "Chino Police History". Chino Police Department. Archived from the original on August 26, 2009. Retrieved December 1, 2009.
- ^ "Film Stars Invade Valley". Progress-Bulletin (Pomona, California). April 3, 1964. p. 2:3. Retrieved June 24, 2022 – via Newspapers.com.
- ^ Ott, Marty (January 13, 1965). "Star Of TV Series Being Filmed At Chino Airport A Seasoned Actor". Chino Champion. p. B3. Retrieved June 24, 2022 – via Newspapers.com.
- ^ Venturi (July 15, 2017). "In Historic Chino Vote, D.R. Horton's Measure H Defeated". San Bernardino County Sentinel. Archived from the original on September 11, 2020. Retrieved September 10, 2020.
- ^ City of Chino CAFR
- U.S. Census Bureau. p. 4 (PDF p. 5/5). Retrieved August 13, 2022.
California Institution for Women
- ^ Mayor Takes a Stand on Prison Population. Archived February 20, 2008, at the Wayback Machine City of Chino, August 14, 2006. Accessed November 29, 2007.
- ^ "El Rancho Elementary - School Directory Details". cde.ca.gov. Retrieved September 11, 2020.
- ^ "Richard Gird Elementary - School Directory Details". cde.ca.gov. Retrieved September 11, 2020.
- ^ "Climate Summary for Chino, California". Weatherbase. Retrieved October 2, 2014.
- ^ "U.S. Climate Normals Quick Access – Station: Chino AP, CA". National Oceanic and Atmospheric Administration. Retrieved May 7, 2023.
- ^ "NOAA Online Weather Data – NWS San Diego". National Weather Service. Retrieved May 7, 2023.
- ^ "Census of Population and Housing". Census.gov. Retrieved June 4, 2015.
- ^ "P004: Hispanic or Latino, and Not Hispanic or Latino by Race – 2000: DEC Summary File 1 – Chino city, California". United States Census Bureau.
- ^ "P2: Hispanic or Latino, and Not Hispanic or Latino by Race – 2010: DEC Redistricting Data (PL 94-171) – Chino city, California". United States Census Bureau.
- ^ "P2: Hispanic or Latino, and Not Hispanic or Latino by Race – 2020: DEC Redistricting Data (PL 94-171) – Chino city, California". United States Census Bureau.
- ^ a b "2010 Census Interactive Population Search: CA - Chino city". U.S. Census Bureau. Archived from the original on July 15, 2014. Retrieved July 12, 2014.
- ^ "Chino (city) QuickFacts". United States Census Bureau. Archived from the original on July 12, 2014. Retrieved September 27, 2014.
- ^ "U.S. Census website". United States Census Bureau. Retrieved January 31, 2008.
- ^ "Communities of Interest - City". California Citizens Redistricting Commission. Archived from the original on September 30, 2013. Retrieved September 24, 2014.
- ^ "California's 39th Congressional District - Representatives & District Map". Civic Impulse, LLC. Retrieved September 25, 2014.
- ^ https://omnitrans.org/wp-content/themes/omninew/timetables/rte_pdf/Route_85.pdf [bare URL PDF]
External links
Places adjacent to Chino, California | |
|---|---|
| International | |
|---|---|
| National | |
| Geographic | |
| Other | |