
Climate of China
Owing to tremendous differences in latitude, longitude, and altitude, the climate of China is extremely diverse. It ranges from
Sanbao Township in Xinjiang currently holds the highest recorded temperature in China, at 52.2 °C (126.0 °F) on 16 July 2023.[1][2] Mohe City, Heilongjiang, holds the record for the lowest temperature in China, at −53.0 °C (−63.4 °F) on 22 January 2023.[3][4]
Overview
Temperature

The northern extremities of both
In summer, temperatures can be very hot and humid, and the cities of Chongqing, Wuhan, and Nanjing are sometimes referred to as the Three Furnaces (simplified Chinese: 三大火炉; traditional Chinese: 三大火爐; pinyin: sān dà huǒlú).[9] Other cities are also known by this name.[10] Even so, the hottest temperatures nationwide are recorded in the Turpan Depression, where the climate is much drier and temperatures often exceed 40 °C (104 °F).[11][12]
Permafrost can be found at high elevations in the Tibetan Plateau and the Tian Shan mountains,[13][14] as well as other mountainous areas in Northern China.[14]
Precipitation
In the winter, northern winds coming from high-latitude areas are cold and dry, while in summer, southern winds from coastal areas at lower latitudes are warm and moist.
Typhoons and flooding
During the wet season, typhoons and heavy rainfall can cause rivers to flood. The
Tornadoes
Tornadoes occur frequently across China. Over 400 are recorded each year, with some reaching EF3 intensity. On June 23rd, 2016, a violent EF4 tornado ripped through the city of Yancheng in Jiangsu, killing 98 people and injuring 846, many of them critically.[49][50] Tornadoes occur most frequently in the eastern regions of China, but activity is also prevalent in the southern and central regions.[51]
Sunshine
Annual sunshine duration ranges from less than 1,000 hours in parts of Sichuan and Chongqing[52] to over 3,000 hours in parts of Xinjiang and Qinghai, including Golmud.[53] Some areas of Tibet, including Lhasa, are also sunny. Seasonal patterns in sunshine vary considerably by region, but overall, the north and the Tibetan Plateau are sunnier than the south of the country. In some cities in southern China, such as Hong Kong, spring is the cloudiest season and autumn is the sunniest.[54]
Environmental issues
In 2020, China ranked 120th out of 180 countries in the Environmental Performance Index.[55] The government has taken actions to mitigate environmental issues, but some media has criticized the actions as inadequate.[56]
A major
Much of China has a climate very suitable for agriculture and the country has been the world's largest producer of
Examples
Northeast China
| Climate data for Beijing (1991–2020 normals, extremes 1951–present) | |||||||||||||
|---|---|---|---|---|---|---|---|---|---|---|---|---|---|
| Month | Jan | Feb | Mar | Apr | May | Jun | Jul | Aug | Sep | Oct | Nov | Dec | Year |
| Record high °C (°F) | 14.3 (57.7) |
25.6 (78.1) |
29.5 (85.1) |
33.5 (92.3) |
41.1 (106.0) |
41.1 (106.0) |
41.9 (107.4) |
39.3 (102.7) |
35.2 (95.4) |
31.0 (87.8) |
23.3 (73.9) |
19.5 (67.1) |
41.9 (107.4) |
| Mean daily maximum °C (°F) | 2.3 (36.1) |
6.1 (43.0) |
13.2 (55.8) |
21.0 (69.8) |
27.2 (81.0) |
30.8 (87.4) |
31.8 (89.2) |
30.7 (87.3) |
26.5 (79.7) |
19.3 (66.7) |
10.3 (50.5) |
3.7 (38.7) |
18.6 (65.4) |
| Daily mean °C (°F) | −2.7 (27.1) |
0.6 (33.1) |
7.5 (45.5) |
15.1 (59.2) |
21.3 (70.3) |
25.3 (77.5) |
27.2 (81.0) |
26.1 (79.0) |
21.2 (70.2) |
13.8 (56.8) |
5.2 (41.4) |
−1.0 (30.2) |
13.3 (55.9) |
| Mean daily minimum °C (°F) | −6.9 (19.6) |
−4.2 (24.4) |
1.9 (35.4) |
9.0 (48.2) |
15.1 (59.2) |
20.0 (68.0) |
23.0 (73.4) |
22.0 (71.6) |
16.3 (61.3) |
8.8 (47.8) |
0.7 (33.3) |
−5.0 (23.0) |
8.4 (47.1) |
| Record low °C (°F) | −22.8 (−9.0) |
−27.4 (−17.3) |
−15 (5) |
−3.2 (26.2) |
2.5 (36.5) |
9.8 (49.6) |
15.3 (59.5) |
11.4 (52.5) |
3.7 (38.7) |
−3.5 (25.7) |
−12.3 (9.9) |
−18.3 (−0.9) |
−27.4 (−17.3) |
| Average precipitation mm (inches) | 2.2 (0.09) |
5.8 (0.23) |
8.6 (0.34) |
21.7 (0.85) |
36.1 (1.42) |
72.4 (2.85) |
169.7 (6.68) |
113.4 (4.46) |
53.7 (2.11) |
28.7 (1.13) |
13.5 (0.53) |
2.2 (0.09) |
528 (20.78) |
| Average precipitation days (≥ 0.1 mm) | 1.6 | 2.3 | 3.0 | 4.7 | 6.0 | 10.0 | 11.9 | 10.5 | 7.1 | 5.2 | 2.9 | 1.6 | 66.8 |
| Average snowy days | 2.8 | 2.5 | 1.3 | 0.1 | 0.0 | 0.0 | 0.0 | 0.0 | 0.0 | 0.0 | 1.7 | 2.8 | 11.2 |
| Average relative humidity (%)
|
43 | 42 | 40 | 43 | 47 | 58 | 69 | 71 | 64 | 58 | 54 | 46 | 53 |
| Mean monthly sunshine hours | 188.1 | 189.1 | 231.1 | 243.2 | 265.1 | 221.6 | 190.5 | 205.3 | 206.1 | 199.9 | 173.4 | 177.1 | 2,490.5 |
| Percent possible sunshine | 62 | 62 | 62 | 61 | 59 | 50 | 42 | 49 | 56 | 59 | 59 | 61 | 57 |
| Average ultraviolet index | 2 | 3 | 4 | 6 | 8 | 9 | 9 | 8 | 6 | 4 | 2 | 1 | 5 |
| Source 1: China Meteorological Administration[65][66] | |||||||||||||
| Source 2: Extremes[a] and Weather Atlas[71] | |||||||||||||
Note
| Climate data for Tianjin (1981–2010 normals) | |||||||||||||
|---|---|---|---|---|---|---|---|---|---|---|---|---|---|
| Month | Jan | Feb | Mar | Apr | May | Jun | Jul | Aug | Sep | Oct | Nov | Dec | Year |
| Record high °C (°F) | 14.3 (57.7) |
20.8 (69.4) |
30.5 (86.9) |
33.1 (91.6) |
40.5 (104.9) |
40.1 (104.2) |
40.5 (104.9) |
37.4 (99.3) |
34.9 (94.8) |
30.8 (87.4) |
23.1 (73.6) |
14.4 (57.9) |
40.5 (104.9) |
| Mean daily maximum °C (°F) | 2.0 (35.6) |
5.7 (42.3) |
12.2 (54.0) |
20.9 (69.6) |
26.5 (79.7) |
30.3 (86.5) |
31.3 (88.3) |
30.5 (86.9) |
26.6 (79.9) |
19.9 (67.8) |
10.6 (51.1) |
3.8 (38.8) |
18.4 (65.0) |
| Daily mean °C (°F) | −3.4 (25.9) |
−0.1 (31.8) |
6.4 (43.5) |
14.7 (58.5) |
20.5 (68.9) |
24.8 (76.6) |
26.8 (80.2) |
25.9 (78.6) |
21.1 (70.0) |
14.1 (57.4) |
5.2 (41.4) |
−1.2 (29.8) |
12.9 (55.2) |
| Mean daily minimum °C (°F) | −7.4 (18.7) |
−4.4 (24.1) |
1.7 (35.1) |
9.3 (48.7) |
15.1 (59.2) |
20.0 (68.0) |
22.9 (73.2) |
22.2 (72.0) |
16.7 (62.1) |
9.4 (48.9) |
1.1 (34.0) |
−5.0 (23.0) |
8.5 (47.3) |
| Record low °C (°F) | −18.1 (−0.6) |
−22.9 (−9.2) |
−17.7 (0.1) |
−2.8 (27.0) |
4.5 (40.1) |
10.1 (50.2) |
16.2 (61.2) |
13.7 (56.7) |
6.2 (43.2) |
−2.2 (28.0) |
−11.4 (11.5) |
−16.2 (2.8) |
−22.9 (−9.2) |
| Average precipitation mm (inches) | 2.5 (0.10) |
3.6 (0.14) |
8.1 (0.32) |
22.1 (0.87) |
36.8 (1.45) |
79.7 (3.14) |
149.8 (5.90) |
124.1 (4.89) |
44.7 (1.76) |
26.5 (1.04) |
10.8 (0.43) |
2.8 (0.11) |
511.5 (20.15) |
| Average precipitation days (≥ 0.1 mm) | 1.6 | 2.0 | 3.1 | 4.5 | 5.9 | 7.8 | 11.1 | 9.4 | 6.0 | 4.7 | 2.9 | 2.0 | 61 |
| Average relative humidity (%)
|
57 | 54 | 51 | 50 | 55 | 64 | 75 | 76 | 69 | 64 | 61 | 59 | 61 |
| Mean monthly sunshine hours | 170.1 | 170.2 | 202.4 | 223.8 | 249.0 | 226.9 | 206.4 | 204.4 | 205.3 | 196.1 | 163.0 | 157.6 | 2,375.2 |
| Percent possible sunshine | 59 | 59 | 56 | 58 | 60 | 57 | 48 | 53 | 60 | 61 | 57 | 57 | 57 |
| Source: China Meteorological Administration[72][73] | |||||||||||||
| Climate data for Harbin (1981–2010 normals, extremes 1961–2000) | |||||||||||||
|---|---|---|---|---|---|---|---|---|---|---|---|---|---|
| Month | Jan | Feb | Mar | Apr | May | Jun | Jul | Aug | Sep | Oct | Nov | Dec | Year |
| Record high °C (°F) | 4.2 (39.6) |
9.9 (49.8) |
20.7 (69.3) |
29.4 (84.9) |
34.6 (94.3) |
36.7 (98.1) |
39.2 (102.6) |
35.6 (96.1) |
31.0 (87.8) |
26.5 (79.7) |
17.2 (63.0) |
8.5 (47.3) |
39.2 (102.6) |
| Mean daily maximum °C (°F) | −12.0 (10.4) |
−6.3 (20.7) |
2.8 (37.0) |
14.0 (57.2) |
21.5 (70.7) |
26.5 (79.7) |
27.8 (82.0) |
26.5 (79.7) |
21.2 (70.2) |
12.3 (54.1) |
−0.1 (31.8) |
−9.2 (15.4) |
10.4 (50.7) |
| Daily mean °C (°F) | −17.6 (0.3) |
−12.4 (9.7) |
−2.8 (27.0) |
7.8 (46.0) |
15.3 (59.5) |
21.0 (69.8) |
23.1 (73.6) |
21.6 (70.9) |
15.1 (59.2) |
6.4 (43.5) |
−4.9 (23.2) |
−14.3 (6.3) |
4.9 (40.7) |
| Mean daily minimum °C (°F) | −22.9 (−9.2) |
−18.3 (−0.9) |
−8.5 (16.7) |
1.4 (34.5) |
8.8 (47.8) |
15.2 (59.4) |
18.6 (65.5) |
16.9 (62.4) |
9.3 (48.7) |
0.9 (33.6) |
−9.5 (14.9) |
−19.0 (−2.2) |
−0.6 (30.9) |
| Record low °C (°F) | −38.1 (−36.6) |
−33.7 (−28.7) |
−28.4 (−19.1) |
−12.8 (9.0) |
−3.8 (25.2) |
4.6 (40.3) |
9.5 (49.1) |
6.6 (43.9) |
−4.8 (23.4) |
−16.2 (2.8) |
−26.5 (−15.7) |
−35.7 (−32.3) |
−42.6 (−44.7) |
| Average precipitation mm (inches) | 4.2 (0.17) |
4.9 (0.19) |
11.9 (0.47) |
20.1 (0.79) |
39.3 (1.55) |
88.2 (3.47) |
147.8 (5.82) |
122.6 (4.83) |
56.3 (2.22) |
23.0 (0.91) |
12.7 (0.50) |
6.9 (0.27) |
537.9 (21.19) |
| Average precipitation days (≥ 0.1 mm) | 5.8 | 5.7 | 5.7 | 6.7 | 10.3 | 13.5 | 14.2 | 12.3 | 9.9 | 7.1 | 6.0 | 7.2 | 104.4 |
| Average relative humidity (%)
|
71 | 66 | 55 | 48 | 51 | 62 | 76 | 78 | 69 | 61 | 63 | 69 | 64 |
| Mean monthly sunshine hours | 155.9 | 179.9 | 230.9 | 231.4 | 264.1 | 260.2 | 254.2 | 247.2 | 230.5 | 206.8 | 170.2 | 139.9 | 2,571.2 |
| Percent possible sunshine | 56 | 62 | 63 | 57 | 58 | 56 | 54 | 57 | 61 | 61 | 60 | 52 | 58 |
| Average ultraviolet index | 1 | 2 | 3 | 4 | 6 | 7 | 8 | 7 | 5 | 3 | 1 | 1 | 4 |
| Source 1: China Meteorological Administration (sunshine data 1971–2000),[73][74] Weather China (precipitation days 1971–2000)[75] | |||||||||||||
| Source 2: Weather Atlas[76] | |||||||||||||
Northwest China and Tibet
| Climate data for Turpan (elevation 39 m (128 ft), 1991–2020 normals) | |||||||||||||
|---|---|---|---|---|---|---|---|---|---|---|---|---|---|
| Month | Jan | Feb | Mar | Apr | May | Jun | Jul | Aug | Sep | Oct | Nov | Dec | Year |
| Record high °C (°F) | 8.5 (47.3) |
19.5 (67.1) |
31.7 (89.1) |
40.5 (104.9) |
43.6 (110.5) |
47.6 (117.7) |
49.1 (120.4) |
47.8 (118.0) |
43.4 (110.1) |
34.3 (93.7) |
23.0 (73.4) |
9.6 (49.3) |
49.1 (120.4) |
| Mean daily maximum °C (°F) | −2.3 (27.9) |
7.0 (44.6) |
17.9 (64.2) |
27.8 (82.0) |
33.9 (93.0) |
38.8 (101.8) |
40.5 (104.9) |
39.0 (102.2) |
32.6 (90.7) |
22.5 (72.5) |
10.3 (50.5) |
−0.4 (31.3) |
22.3 (72.1) |
| Daily mean °C (°F) | −6.7 (19.9) |
1.3 (34.3) |
11.6 (52.9) |
20.7 (69.3) |
26.6 (79.9) |
31.6 (88.9) |
33.1 (91.6) |
31.2 (88.2) |
24.6 (76.3) |
14.5 (58.1) |
4.4 (39.9) |
−4.4 (24.1) |
15.7 (60.3) |
| Mean daily minimum °C (°F) | −10.3 (13.5) |
−3.5 (25.7) |
5.9 (42.6) |
14.2 (57.6) |
19.8 (67.6) |
24.7 (76.5) |
26.5 (79.7) |
24.6 (76.3) |
18.4 (65.1) |
9.1 (48.4) |
0.3 (32.5) |
−7.6 (18.3) |
10.2 (50.3) |
| Record low °C (°F) | −28.9 (−20.0) |
−24.5 (−12.1) |
−10.4 (13.3) |
−1.8 (28.8) |
4.7 (40.5) |
11.5 (52.7) |
15.5 (59.9) |
11.6 (52.9) |
1.3 (34.3) |
−5.7 (21.7) |
−17.8 (0.0) |
−26.1 (−15.0) |
−28.9 (−20.0) |
| Average precipitation mm (inches) | 0.9 (0.04) |
0.5 (0.02) |
0.7 (0.03) |
0.9 (0.04) |
1.0 (0.04) |
2.6 (0.10) |
2.0 (0.08) |
2.0 (0.08) |
1.4 (0.06) |
1.2 (0.05) |
0.6 (0.02) |
0.9 (0.04) |
14.7 (0.6) |
| Average precipitation days (≥ 0.1 mm) | 1.0 | 0.3 | 0.3 | 0.7 | 1.1 | 2.0 | 2.3 | 1.9 | 0.9 | 0.8 | 0.5 | 1.1 | 12.9 |
| Average snowy days | 2.5 | 0.9 | 0 | 0 | 0 | 0 | 0 | 0 | 0 | 0 | 0.2 | 2.6 | 6.2 |
| Average relative humidity (%)
|
56 | 40 | 25 | 23 | 25 | 27 | 30 | 31 | 35 | 45 | 50 | 56 | 37 |
| Mean monthly sunshine hours | 121.8 | 172.0 | 234.2 | 263.7 | 308.4 | 301.6 | 303.3 | 299.6 | 273.5 | 238.6 | 163.7 | 108.2 | 2,788.6 |
| Percent possible sunshine | 41 | 57 | 62 | 65 | 67 | 66 | 66 | 71 | 74 | 71 | 57 | 39 | 61 |
| Source 1: China Meteorological Administration[77][78][79] | |||||||||||||
| Source 2: [80] | |||||||||||||
| Climate data for Lhasa (1986−2015 normals, extremes 1951−2022) | |||||||||||||
|---|---|---|---|---|---|---|---|---|---|---|---|---|---|
| Month | Jan | Feb | Mar | Apr | May | Jun | Jul | Aug | Sep | Oct | Nov | Dec | Year |
| Record high °C (°F) | 20.5 (68.9) |
21.3 (70.3) |
25.1 (77.2) |
25.9 (78.6) |
29.4 (84.9) |
30.8 (87.4) |
30.4 (86.7) |
27.2 (81.0) |
26.5 (79.7) |
24.8 (76.6) |
22.8 (73.0) |
20.1 (68.2) |
30.8 (87.4) |
| Mean daily maximum °C (°F) | 8.4 (47.1) |
10.1 (50.2) |
13.3 (55.9) |
16.3 (61.3) |
20.5 (68.9) |
24.0 (75.2) |
23.3 (73.9) |
22.0 (71.6) |
20.7 (69.3) |
17.5 (63.5) |
12.9 (55.2) |
9.3 (48.7) |
16.5 (61.7) |
| Daily mean °C (°F) | −0.3 (31.5) |
2.3 (36.1) |
5.9 (42.6) |
9.0 (48.2) |
13.1 (55.6) |
16.7 (62.1) |
16.5 (61.7) |
15.4 (59.7) |
13.8 (56.8) |
9.4 (48.9) |
3.8 (38.8) |
−0.1 (31.8) |
8.8 (47.8) |
| Mean daily minimum °C (°F) | −7.4 (18.7) |
−4.7 (23.5) |
−0.8 (30.6) |
2.7 (36.9) |
6.8 (44.2) |
10.9 (51.6) |
11.4 (52.5) |
10.7 (51.3) |
8.9 (48.0) |
3.1 (37.6) |
−3 (27) |
−6.8 (19.8) |
2.7 (36.8) |
| Record low °C (°F) | −16.5 (2.3) |
−15.4 (4.3) |
−13.6 (7.5) |
−8.1 (17.4) |
−2.7 (27.1) |
2.0 (35.6) |
4.5 (40.1) |
3.3 (37.9) |
0.3 (32.5) |
−7.2 (19.0) |
−11.2 (11.8) |
−16.1 (3.0) |
−16.5 (2.3) |
| Average precipitation mm (inches) | 0.9 (0.04) |
1.8 (0.07) |
2.9 (0.11) |
8.6 (0.34) |
28.4 (1.12) |
75.9 (2.99) |
129.6 (5.10) |
133.5 (5.26) |
66.7 (2.63) |
8.8 (0.35) |
0.9 (0.04) |
0.3 (0.01) |
458.3 (18.06) |
| Average precipitation days (≥ 0.1 mm) | 0.6 | 1.2 | 2.1 | 5.4 | 9.0 | 14.0 | 19.4 | 19.9 | 14.6 | 4.1 | 0.6 | 0.4 | 91.3 |
| Average relative humidity (%)
|
26 | 25 | 27 | 36 | 41 | 48 | 59 | 63 | 59 | 45 | 34 | 29 | 41 |
| Mean monthly sunshine hours | 250.9 | 231.2 | 253.2 | 248.8 | 280.4 | 260.7 | 227.0 | 214.3 | 232.7 | 280.3 | 267.1 | 257.2 | 3,003.8 |
| Percent possible sunshine | 78 | 72 | 66 | 65 | 66 | 61 | 53 | 54 | 62 | 80 | 84 | 82 | 67 |
| Source 1: China Meteorological Administration,[81] all-time extreme temperature[82][83] | |||||||||||||
| Source 2: China Meteorological Administration National Meteorological Information Center | |||||||||||||
| Climate data for Ürümqi | |||||||||||||
|---|---|---|---|---|---|---|---|---|---|---|---|---|---|
| Month | Jan | Feb | Mar | Apr | May | Jun | Jul | Aug | Sep | Oct | Nov | Dec | Year |
| Record high °C (°F) | 9.9 (49.8) |
13.5 (56.3) |
23.7 (74.7) |
32.5 (90.5) |
37.0 (98.6) |
40.9 (105.6) |
41.0 (105.8) |
42.1 (107.8) |
37.0 (98.6) |
30.5 (86.9) |
19.2 (66.6) |
15.6 (60.1) |
42.1 (107.8) |
| Mean daily maximum °C (°F) | −7.4 (18.7) |
−4.7 (23.5) |
2.7 (36.9) |
16.1 (61.0) |
23.1 (73.6) |
27.6 (81.7) |
30.1 (86.2) |
29.0 (84.2) |
23.1 (73.6) |
13.2 (55.8) |
2.0 (35.6) |
−4.4 (24.1) |
12.5 (54.6) |
| Daily mean °C (°F) | −12.6 (9.3) |
−9.8 (14.4) |
−1.7 (28.9) |
10.0 (50.0) |
16.7 (62.1) |
21.5 (70.7) |
23.7 (74.7) |
22.4 (72.3) |
16.7 (62.1) |
7.7 (45.9) |
−2.5 (27.5) |
−9.3 (15.3) |
6.9 (44.4) |
| Mean daily minimum °C (°F) | −16.6 (2.1) |
−13.7 (7.3) |
−5.4 (22.3) |
4.8 (40.6) |
11.2 (52.2) |
16.1 (61.0) |
18.2 (64.8) |
16.7 (62.1) |
11.2 (52.2) |
3.1 (37.6) |
−5.9 (21.4) |
−12.9 (8.8) |
2.2 (36.0) |
| Record low °C (°F) | −34.1 (−29.4) |
−41.5 (−42.7) |
−33.4 (−28.1) |
−14.9 (5.2) |
−2.4 (27.7) |
4.6 (40.3) |
8.8 (47.8) |
5.0 (41.0) |
−5.0 (23.0) |
−12.4 (9.7) |
−36.6 (−33.9) |
−38.3 (−36.9) |
−41.5 (−42.7) |
| Average precipitation mm (inches) | 10.4 (0.41) |
10.0 (0.39) |
18.5 (0.73) |
32.3 (1.27) |
38.9 (1.53) |
36.2 (1.43) |
30.4 (1.20) |
23.3 (0.92) |
26.2 (1.03) |
26.3 (1.04) |
19.1 (0.75) |
14.6 (0.57) |
286.2 (11.27) |
| Average precipitation days (≥ 0.1 mm) | 9.2 | 7.2 | 7.2 | 6.8 | 6.8 | 8.0 | 8.4 | 6.3 | 5.0 | 5.5 | 6.9 | 9.6 | 86.9 |
| Average relative humidity (%)
|
78 | 77 | 72 | 48 | 43 | 43 | 43 | 41 | 44 | 58 | 74 | 78 | 58 |
| Mean monthly sunshine hours | 101.6 | 128.8 | 180.5 | 248.0 | 283.3 | 282.7 | 298.7 | 301.0 | 262.6 | 224.4 | 127.4 | 84.3 | 2,523.3 |
| Percent possible sunshine | 35 | 44 | 49 | 62 | 63 | 61 | 64 | 70 | 70 | 66 | 44 | 30 | 57 |
| Source: China Meteorological Administration | |||||||||||||
Central China
| Climate data for Chongqing (Shapingba District, 1981–2010 normals) | |||||||||||||
|---|---|---|---|---|---|---|---|---|---|---|---|---|---|
| Month | Jan | Feb | Mar | Apr | May | Jun | Jul | Aug | Sep | Oct | Nov | Dec | Year |
| Record high °C (°F) | 18.8 (65.8) |
24.6 (76.3) |
34.0 (93.2) |
36.5 (97.7) |
38.9 (102.0) |
44.1 (111.4) |
42.0 (107.6) |
43.9 (111.0) |
43.9 (111.0) |
39.1 (102.4) |
29.2 (84.6) |
21.5 (70.7) |
44.1 (111.4) |
| Mean daily maximum °C (°F) | 10.3 (50.5) |
12.9 (55.2) |
17.7 (63.9) |
23.0 (73.4) |
27.2 (81.0) |
29.4 (84.9) |
33.0 (91.4) |
33.2 (91.8) |
28.3 (82.9) |
21.7 (71.1) |
17.1 (62.8) |
11.5 (52.7) |
22.1 (71.8) |
| Daily mean °C (°F) | 7.9 (46.2) |
10.0 (50.0) |
13.8 (56.8) |
18.6 (65.5) |
22.6 (72.7) |
25.1 (77.2) |
28.3 (82.9) |
28.3 (82.9) |
24.1 (75.4) |
18.6 (65.5) |
14.2 (57.6) |
9.2 (48.6) |
18.4 (65.1) |
| Mean daily minimum °C (°F) | 6.2 (43.2) |
8.0 (46.4) |
11.2 (52.2) |
15.4 (59.7) |
19.3 (66.7) |
22.1 (71.8) |
24.8 (76.6) |
24.7 (76.5) |
21.2 (70.2) |
16.5 (61.7) |
12.3 (54.1) |
7.7 (45.9) |
15.8 (60.4) |
| Record low °C (°F) | −1.8 (28.8) |
−0.8 (30.6) |
1.2 (34.2) |
2.8 (37.0) |
10.8 (51.4) |
15.5 (59.9) |
19.2 (66.6) |
17.8 (64.0) |
14.3 (57.7) |
6.9 (44.4) |
0.7 (33.3) |
−27.7 (−17.9) |
−27.7 (−17.9) |
| Average precipitation mm (inches) | 19.7 (0.78) |
23.3 (0.92) |
43.2 (1.70) |
95.2 (3.75) |
145.9 (5.74) |
192.6 (7.58) |
186.0 (7.32) |
137.9 (5.43) |
105.8 (4.17) |
85.8 (3.38) |
48.3 (1.90) |
24.3 (0.96) |
1,108 (43.63) |
| Average precipitation days (≥ 0.1 mm) | 10.0 | 9.8 | 11.9 | 14.3 | 15.5 | 15.7 | 12.5 | 11.3 | 12.7 | 16.1 | 11.5 | 9.8 | 151.1 |
| Average relative humidity (%)
|
84 | 80 | 77 | 77 | 77 | 81 | 76 | 74 | 79 | 85 | 84 | 85 | 80 |
| Mean monthly sunshine hours | 20.6 | 29.7 | 64.9 | 93.6 | 109.4 | 97.7 | 158.6 | 167.0 | 106.6 | 50.4 | 35.9 | 20.4 | 954.8 |
| Percent possible sunshine | 8 | 11 | 18 | 25 | 26 | 26 | 42 | 48 | 28 | 18 | 13 | 8 | 24 |
| Average ultraviolet index | 4 | 6 | 8 | 10 | 11 | 12 | 12 | 11 | 10 | 7 | 5 | 4 | 8 |
| Source 1: China Meteorological Administration[84][52] | |||||||||||||
| Source 2: Weather Atlas (UV Index)[85] | |||||||||||||
| Climate data for Wuhan (1981–2010 normals, extremes 1951–present) | |||||||||||||
|---|---|---|---|---|---|---|---|---|---|---|---|---|---|
| Month | Jan | Feb | Mar | Apr | May | Jun | Jul | Aug | Sep | Oct | Nov | Dec | Year |
| Record high °C (°F) | 25.4 (77.7) |
29.1 (84.4) |
32.4 (90.3) |
35.1 (95.2) |
36.1 (97.0) |
37.8 (100.0) |
41.1 (106.0) |
39.6 (103.3) |
38.1 (100.6) |
34.4 (93.9) |
30.4 (86.7) |
23.3 (73.9) |
41.1 (106.0) |
| Mean daily maximum °C (°F) | 8.1 (46.6) |
10.7 (51.3) |
15.2 (59.4) |
22.1 (71.8) |
27.1 (80.8) |
30.2 (86.4) |
32.9 (91.2) |
32.5 (90.5) |
28.5 (83.3) |
23.0 (73.4) |
16.8 (62.2) |
10.8 (51.4) |
21.5 (70.7) |
| Daily mean °C (°F) | 4.0 (39.2) |
6.6 (43.9) |
10.9 (51.6) |
17.4 (63.3) |
22.6 (72.7) |
26.2 (79.2) |
29.1 (84.4) |
28.4 (83.1) |
24.1 (75.4) |
18.2 (64.8) |
11.9 (53.4) |
6.2 (43.2) |
17.1 (62.9) |
| Mean daily minimum °C (°F) | 1.0 (33.8) |
3.5 (38.3) |
7.4 (45.3) |
13.6 (56.5) |
18.9 (66.0) |
22.9 (73.2) |
26.0 (78.8) |
25.3 (77.5) |
20.7 (69.3) |
14.7 (58.5) |
8.4 (47.1) |
2.9 (37.2) |
13.8 (56.8) |
| Record low °C (°F) | −18.1 (−0.6) |
−14.8 (5.4) |
−5.0 (23.0) |
−0.3 (31.5) |
7.2 (45.0) |
13.0 (55.4) |
17.3 (63.1) |
16.4 (61.5) |
10.1 (50.2) |
1.3 (34.3) |
−7.1 (19.2) |
−10.1 (13.8) |
−18.1 (−0.6) |
| Average precipitation mm (inches) | 48.7 (1.92) |
65.5 (2.58) |
91.0 (3.58) |
135.7 (5.34) |
166.8 (6.57) |
218.2 (8.59) |
228.1 (8.98) |
117.5 (4.63) |
74.0 (2.91) |
80.9 (3.19) |
60.0 (2.36) |
29.6 (1.17) |
1,316 (51.82) |
| Average precipitation days (≥ 0.1 mm) | 9.5 | 9.8 | 13.1 | 12.5 | 12.2 | 11.8 | 11.6 | 9.6 | 7.5 | 9.0 | 8.0 | 6.9 | 121.5 |
| Average relative humidity (%)
|
76 | 75 | 75 | 75 | 74 | 77 | 77 | 77 | 75 | 76 | 75 | 73 | 75 |
| Mean monthly sunshine hours | 101.9 | 97.0 | 121.8 | 152.8 | 181.0 | 170.9 | 220.2 | 226.4 | 175.8 | 151.9 | 139.3 | 126.5 | 1,865.5 |
| Percent possible sunshine | 33 | 33 | 31 | 39 | 43 | 43 | 54 | 59 | 48 | 46 | 45 | 43 | 43 |
| Source: China Meteorological Administration (precipitation days and sunshine 1971–2000)[86][87] | |||||||||||||
| Climate data for Xi'an (normals 1981–2010, extremes 1951–2013) | |||||||||||||
|---|---|---|---|---|---|---|---|---|---|---|---|---|---|
| Month | Jan | Feb | Mar | Apr | May | Jun | Jul | Aug | Sep | Oct | Nov | Dec | Year |
| Record high °C (°F) | 17.0 (62.6) |
24.1 (75.4) |
31.3 (88.3) |
34.9 (94.8) |
38.6 (101.5) |
41.8 (107.2) |
41.0 (105.8) |
40.0 (104.0) |
38.5 (101.3) |
34.1 (93.4) |
24.5 (76.1) |
21.6 (70.9) |
41.8 (107.2) |
| Mean daily maximum °C (°F) | 5.1 (41.2) |
8.9 (48.0) |
14.4 (57.9) |
21.5 (70.7) |
26.6 (79.9) |
31.4 (88.5) |
32.4 (90.3) |
30.3 (86.5) |
25.6 (78.1) |
19.3 (66.7) |
12.4 (54.3) |
6.3 (43.3) |
19.5 (67.1) |
| Daily mean °C (°F) | 0.3 (32.5) |
3.6 (38.5) |
8.7 (47.7) |
15.4 (59.7) |
20.5 (68.9) |
25.3 (77.5) |
27.0 (80.6) |
25.1 (77.2) |
20.3 (68.5) |
14.1 (57.4) |
7.2 (45.0) |
1.5 (34.7) |
14.1 (57.4) |
| Mean daily minimum °C (°F) | −3.3 (26.1) |
−0.4 (31.3) |
4.1 (39.4) |
10.3 (50.5) |
15.1 (59.2) |
19.9 (67.8) |
22.3 (72.1) |
21.0 (69.8) |
16.5 (61.7) |
10.2 (50.4) |
3.2 (37.8) |
−2.2 (28.0) |
9.7 (49.5) |
| Record low °C (°F) | −20.6 (−5.1) |
−18.7 (−1.7) |
−7.6 (18.3) |
−4 (25) |
3.5 (38.3) |
9.2 (48.6) |
15.1 (59.2) |
12.1 (53.8) |
4.8 (40.6) |
−1.9 (28.6) |
−16.8 (1.8) |
−19.3 (−2.7) |
−20.6 (−5.1) |
| Average precipitation mm (inches) | 6.7 (0.26) |
9.8 (0.39) |
27.1 (1.07) |
37.5 (1.48) |
54.9 (2.16) |
64.5 (2.54) |
97.5 (3.84) |
78.6 (3.09) |
94.1 (3.70) |
61.7 (2.43) |
21.5 (0.85) |
7.3 (0.29) |
561.2 (22.1) |
| Average precipitation days (≥ 0.1 mm) | 3.4 | 4.0 | 6.4 | 7.8 | 8.2 | 8.8 | 9.9 | 10.0 | 11.6 | 9.9 | 5.5 | 3.6 | 89.1 |
| Average relative humidity (%)
|
65 | 62 | 64 | 64 | 65 | 61 | 68 | 75 | 77 | 76 | 73 | 68 | 68 |
| Mean monthly sunshine hours | 88.4 | 96.1 | 116.6 | 142.8 | 169.5 | 179.7 | 181.1 | 168.1 | 121.0 | 98.9 | 92.4 | 81.0 | 1,535.6 |
| Percent possible sunshine | 32 | 34 | 33 | 38 | 40 | 43 | 44 | 47 | 34 | 32 | 32 | 31 | 37 |
| Source: China Meteorological Administration,[88] all-time extreme temperature[89] | |||||||||||||
East China
| Climate data for Shanghai ( Minhang District ), 1991–2020 normals, extremes 1951–present
| |||||||||||||
|---|---|---|---|---|---|---|---|---|---|---|---|---|---|
| Month | Jan | Feb | Mar | Apr | May | Jun | Jul | Aug | Sep | Oct | Nov | Dec | Year |
| Record high °C (°F) | 22.1 (71.8) |
27.0 (80.6) |
29.6 (85.3) |
34.3 (93.7) |
36.4 (97.5) |
37.5 (99.5) |
40.9 (105.6) |
39.9 (103.8) |
38.2 (100.8) |
36.0 (96.8) |
28.7 (83.7) |
24.0 (75.2) |
40.9 (105.6) |
| Mean daily maximum °C (°F) | 8.7 (47.7) |
10.7 (51.3) |
14.8 (58.6) |
20.6 (69.1) |
25.5 (77.9) |
28.3 (82.9) |
32.8 (91.0) |
32.3 (90.1) |
28.5 (83.3) |
23.6 (74.5) |
17.9 (64.2) |
11.5 (52.7) |
21.3 (70.3) |
| Daily mean °C (°F) | 4.9 (40.8) |
6.6 (43.9) |
10.4 (50.7) |
15.8 (60.4) |
20.9 (69.6) |
24.4 (75.9) |
28.8 (83.8) |
28.5 (83.3) |
24.7 (76.5) |
19.5 (67.1) |
13.7 (56.7) |
7.3 (45.1) |
17.1 (62.8) |
| Mean daily minimum °C (°F) | 1.9 (35.4) |
3.3 (37.9) |
6.8 (44.2) |
11.9 (53.4) |
17.2 (63.0) |
21.5 (70.7) |
25.8 (78.4) |
25.7 (78.3) |
21.6 (70.9) |
15.9 (60.6) |
10.1 (50.2) |
3.9 (39.0) |
13.8 (56.8) |
| Record low °C (°F) | −10.1 (13.8) |
−7.9 (17.8) |
−5.4 (22.3) |
−0.5 (31.1) |
6.9 (44.4) |
12.3 (54.1) |
16.3 (61.3) |
18.8 (65.8) |
10.8 (51.4) |
1.7 (35.1) |
−4.2 (24.4) |
−8.5 (16.7) |
−10.1 (13.8) |
| Average precipitation mm (inches) | 70.4 (2.77) |
65.4 (2.57) |
95.4 (3.76) |
82.5 (3.25) |
93.2 (3.67) |
207.3 (8.16) |
148.0 (5.83) |
187.1 (7.37) |
118.1 (4.65) |
68.4 (2.69) |
59.4 (2.34) |
50.3 (1.98) |
1,245.5 (49.04) |
| Average precipitation days (≥ 0.1 mm) | 10.9 | 10.2 | 12.9 | 11.3 | 11.2 | 14.5 | 11.7 | 12.4 | 9.8 | 7.4 | 9.1 | 8.3 | 129.7 |
| Average snowy days | 1.8 | 1.4 | 0.4 | 0 | 0 | 0 | 0 | 0 | 0 | 0 | 0.1 | 0.7 | 4.4 |
| Average relative humidity (%)
|
74 | 73 | 72 | 71 | 73 | 80 | 78 | 78 | 76 | 73 | 74 | 72 | 75 |
| Mean monthly sunshine hours | 114.8 | 117.9 | 143.8 | 168.1 | 176.8 | 131.2 | 209.4 | 202.3 | 163.7 | 162.1 | 131.1 | 129.7 | 1,850.9 |
| Percent possible sunshine | 36 | 37 | 39 | 43 | 41 | 31 | 49 | 50 | 45 | 46 | 42 | 41 | 42 |
| Source: China Meteorological Administration[90][91] | |||||||||||||
| Climate data for Nanjing (1981–2010 normals, extremes 1951–present) | |||||||||||||
|---|---|---|---|---|---|---|---|---|---|---|---|---|---|
| Month | Jan | Feb | Mar | Apr | May | Jun | Jul | Aug | Sep | Oct | Nov | Dec | Year |
| Record high °C (°F) | 21.0 (69.8) |
27.7 (81.9) |
30.3 (86.5) |
34.2 (93.6) |
37.5 (99.5) |
38.1 (100.6) |
40.0 (104.0) |
40.7 (105.3) |
39.0 (102.2) |
33.4 (92.1) |
29.2 (84.6) |
23.1 (73.6) |
40.7 (105.3) |
| Mean daily maximum °C (°F) | 7.2 (45.0) |
9.5 (49.1) |
14.2 (57.6) |
20.7 (69.3) |
26.2 (79.2) |
29.1 (84.4) |
32.2 (90.0) |
31.7 (89.1) |
27.7 (81.9) |
22.5 (72.5) |
16.2 (61.2) |
9.9 (49.8) |
20.6 (69.1) |
| Daily mean °C (°F) | 2.7 (36.9) |
5.0 (41.0) |
9.3 (48.7) |
15.6 (60.1) |
21.1 (70.0) |
24.8 (76.6) |
28.1 (82.6) |
27.6 (81.7) |
23.3 (73.9) |
17.6 (63.7) |
10.9 (51.6) |
4.9 (40.8) |
15.9 (60.6) |
| Mean daily minimum °C (°F) | −0.7 (30.7) |
1.4 (34.5) |
5.3 (41.5) |
11.0 (51.8) |
16.5 (61.7) |
21.0 (69.8) |
24.9 (76.8) |
24.4 (75.9) |
19.9 (67.8) |
13.6 (56.5) |
6.8 (44.2) |
1.1 (34.0) |
12.1 (53.8) |
| Record low °C (°F) | −14.0 (6.8) |
−13.0 (8.6) |
−7.1 (19.2) |
−0.2 (31.6) |
5.0 (41.0) |
11.8 (53.2) |
16.8 (62.2) |
16.9 (62.4) |
7.7 (45.9) |
0.2 (32.4) |
−6.3 (20.7) |
−13.1 (8.4) |
−14.0 (6.8) |
| Average precipitation mm (inches) | 45.2 (1.78) |
52.1 (2.05) |
80.4 (3.17) |
79.9 (3.15) |
90.7 (3.57) |
162.0 (6.38) |
216.3 (8.52) |
143.5 (5.65) |
75.3 (2.96) |
59.5 (2.34) |
56.3 (2.22) |
29.5 (1.16) |
1,090.7 (42.95) |
| Average precipitation days (≥ 0.1 mm) | 8.7 | 9.1 | 11.8 | 10.0 | 9.7 | 10.6 | 12.3 | 11.8 | 8.1 | 7.8 | 7.4 | 6.2 | 113.5 |
| Average relative humidity (%)
|
74 | 73 | 72 | 71 | 71 | 76 | 80 | 80 | 78 | 75 | 76 | 73 | 75 |
| Mean monthly sunshine hours | 124.7 | 120.3 | 144.7 | 169.2 | 194.2 | 162.8 | 196.7 | 201.6 | 164.0 | 164.2 | 147.4 | 137.1 | 1,926.9 |
| Source: China Meteorological Administration (precipitation days, sunshine data 1971–2000)[92][93] | |||||||||||||
| Climate data for Hangzhou (1981–2010 normals, extremes 1951–present) | |||||||||||||
|---|---|---|---|---|---|---|---|---|---|---|---|---|---|
| Month | Jan | Feb | Mar | Apr | May | Jun | Jul | Aug | Sep | Oct | Nov | Dec | Year |
| Record high °C (°F) | 25.4 (77.7) |
28.5 (83.3) |
32.8 (91.0) |
34.8 (94.6) |
37.6 (99.7) |
39.7 (103.5) |
41.3 (106.3) |
41.6 (106.9) |
38.7 (101.7) |
35.0 (95.0) |
31.2 (88.2) |
26.5 (79.7) |
41.6 (106.9) |
| Mean maximum °C (°F) | 17.4 (63.3) |
21.3 (70.3) |
25.7 (78.3) |
30.6 (87.1) |
33.8 (92.8) |
35.3 (95.5) |
37.9 (100.2) |
37.3 (99.1) |
34.4 (93.9) |
30.3 (86.5) |
25.1 (77.2) |
19.5 (67.1) |
38.2 (100.8) |
| Mean daily maximum °C (°F) | 8.3 (46.9) |
10.3 (50.5) |
14.8 (58.6) |
21.1 (70.0) |
26.3 (79.3) |
29.1 (84.4) |
33.6 (92.5) |
32.8 (91.0) |
28.2 (82.8) |
23.2 (73.8) |
17.3 (63.1) |
11.3 (52.3) |
21.4 (70.4) |
| Daily mean °C (°F) | 4.6 (40.3) |
6.4 (43.5) |
10.3 (50.5) |
16.2 (61.2) |
21.4 (70.5) |
24.7 (76.5) |
28.9 (84.0) |
28.2 (82.8) |
24.0 (75.2) |
18.8 (65.8) |
12.9 (55.2) |
7.0 (44.6) |
17.0 (62.5) |
| Mean daily minimum °C (°F) | 1.8 (35.2) |
3.5 (38.3) |
7.0 (44.6) |
12.4 (54.3) |
17.5 (63.5) |
21.4 (70.5) |
25.2 (77.4) |
24.9 (76.8) |
20.9 (69.6) |
15.4 (59.7) |
9.3 (48.7) |
3.7 (38.7) |
13.6 (56.4) |
| Mean minimum °C (°F) | −3.9 (25.0) |
−2.3 (27.9) |
0.8 (33.4) |
5.8 (42.4) |
12.1 (53.8) |
16.9 (62.4) |
21.5 (70.7) |
21.4 (70.5) |
16.0 (60.8) |
9.0 (48.2) |
2.5 (36.5) |
−2.8 (27.0) |
−4.6 (23.7) |
| Record low °C (°F) | −8.6 (16.5) |
−9.6 (14.7) |
−3.5 (25.7) |
0.2 (32.4) |
7.3 (45.1) |
12.8 (55.0) |
17.3 (63.1) |
18.2 (64.8) |
12.0 (53.6) |
1.0 (33.8) |
−3.6 (25.5) |
−8.4 (16.9) |
−9.6 (14.7) |
| Average precipitation mm (inches) | 79.8 (3.14) |
86.1 (3.39) |
143.7 (5.66) |
122.5 (4.82) |
128.2 (5.05) |
211.8 (8.34) |
180.3 (7.10) |
156.1 (6.15) |
130.1 (5.12) |
78.6 (3.09) |
72.3 (2.85) |
48.6 (1.91) |
1,438.1 (56.62) |
| Average precipitation days (≥ 0.1 mm) | 12.4 | 12.1 | 15.3 | 14.5 | 13.8 | 14.6 | 12.4 | 13.8 | 11.7 | 9.0 | 9.3 | 8.5 | 147.4 |
| Average relative humidity (%)
|
75 | 75 | 75 | 74 | 74 | 80 | 76 | 78 | 79 | 76 | 74 | 72 | 76 |
| Mean monthly sunshine hours | 102.0 | 97.2 | 116.4 | 140.6 | 164.7 | 136.6 | 212.7 | 193.0 | 143.9 | 144.6 | 129.0 | 128.7 | 1,709.4 |
| Source: China Meteorological Administration (precipitation days and sunshine 1971–2000)[94][95] | |||||||||||||
South China
| Climate data for Hong Kong, normals 1991–2020,[a] extremes 1884–1939 and 1947–present | |||||||||||||
|---|---|---|---|---|---|---|---|---|---|---|---|---|---|
| Month | Jan | Feb | Mar | Apr | May | Jun | Jul | Aug | Sep | Oct | Nov | Dec | Year |
| Record high °C (°F) | 26.9 (80.4) |
28.3 (82.9) |
30.1 (86.2) |
33.4 (92.1) |
36.1 (97.0) |
35.6 (96.1) |
35.7 (96.3) |
36.6 (97.9) |
35.2 (95.4) |
34.3 (93.7) |
31.8 (89.2) |
28.7 (83.7) |
36.6 (97.9) |
| Mean maximum °C (°F) | 24.0 (75.2) |
25.1 (77.2) |
27.5 (81.5) |
30.2 (86.4) |
32.3 (90.1) |
33.6 (92.5) |
34.1 (93.4) |
34.2 (93.6) |
33.4 (92.1) |
31.3 (88.3) |
28.4 (83.1) |
25.1 (77.2) |
34.7 (94.5) |
| Mean daily maximum °C (°F) | 18.7 (65.7) |
19.4 (66.9) |
21.9 (71.4) |
25.6 (78.1) |
28.8 (83.8) |
30.7 (87.3) |
31.6 (88.9) |
31.3 (88.3) |
30.5 (86.9) |
28.1 (82.6) |
24.5 (76.1) |
20.4 (68.7) |
26.0 (78.8) |
| Daily mean °C (°F) | 16.5 (61.7) |
17.1 (62.8) |
19.5 (67.1) |
23.0 (73.4) |
26.3 (79.3) |
28.3 (82.9) |
28.9 (84.0) |
28.7 (83.7) |
27.9 (82.2) |
25.7 (78.3) |
22.2 (72.0) |
18.2 (64.8) |
23.5 (74.3) |
| Mean daily minimum °C (°F) | 14.6 (58.3) |
15.3 (59.5) |
17.6 (63.7) |
21.1 (70.0) |
24.5 (76.1) |
26.5 (79.7) |
26.9 (80.4) |
26.7 (80.1) |
26.1 (79.0) |
23.9 (75.0) |
20.3 (68.5) |
16.2 (61.2) |
21.6 (70.9) |
| Mean minimum °C (°F) | 9.1 (48.4) |
10.2 (50.4) |
12.2 (54.0) |
16.3 (61.3) |
20.7 (69.3) |
23.6 (74.5) |
24.2 (75.6) |
24.3 (75.7) |
23.5 (74.3) |
20.1 (68.2) |
15.3 (59.5) |
10.1 (50.2) |
7.8 (46.0) |
| Record low °C (°F) | 0.0 (32.0) |
2.4 (36.3) |
4.8 (40.6) |
9.9 (49.8) |
15.4 (59.7) |
19.2 (66.6) |
21.7 (71.1) |
21.6 (70.9) |
18.4 (65.1) |
13.5 (56.3) |
6.5 (43.7) |
4.3 (39.7) |
0.0 (32.0) |
| Average rainfall mm (inches) | 33.2 (1.31) |
38.9 (1.53) |
75.3 (2.96) |
153.0 (6.02) |
290.6 (11.44) |
491.5 (19.35) |
385.8 (15.19) |
453.2 (17.84) |
321.4 (12.65) |
120.3 (4.74) |
39.3 (1.55) |
28.8 (1.13) |
2,431.2 (95.72) |
| Average rainy days (≥ 0.1 mm) | 5.70 | 7.97 | 10.50 | 11.37 | 15.37 | 19.33 | 18.43 | 17.50 | 14.90 | 7.83 | 5.70 | 5.30 | 139.90 |
| Average relative humidity (%)
|
74 | 79 | 82 | 83 | 83 | 82 | 81 | 81 | 78 | 73 | 72 | 70 | 78 |
| Mean monthly sunshine hours | 145.8 | 101.7 | 100.0 | 113.2 | 138.8 | 144.3 | 197.3 | 182.1 | 174.4 | 197.8 | 172.3 | 161.6 | 1,829.3 |
| Percent possible sunshine | 43 | 32 | 27 | 30 | 34 | 36 | 48 | 46 | 47 | 55 | 52 | 48 | 41 |
| Source: Hong Kong Observatory[96][97][98] | |||||||||||||
| Climate data for Guangzhou (normals 1971–2000, extremes 1961–2000) | |||||||||||||
|---|---|---|---|---|---|---|---|---|---|---|---|---|---|
| Month | Jan | Feb | Mar | Apr | May | Jun | Jul | Aug | Sep | Oct | Nov | Dec | Year |
| Record high °C (°F) | 27.2 (81.0) |
28.6 (83.5) |
32.1 (89.8) |
32.4 (90.3) |
36.2 (97.2) |
36.6 (97.9) |
39.1 (102.4) |
38.0 (100.4) |
37.6 (99.7) |
34.8 (94.6) |
32.5 (90.5) |
29.6 (85.3) |
39.1 (102.4) |
| Mean daily maximum °C (°F) | 18.3 (64.9) |
18.5 (65.3) |
21.6 (70.9) |
25.7 (78.3) |
29.3 (84.7) |
31.5 (88.7) |
32.8 (91.0) |
32.7 (90.9) |
31.5 (88.7) |
28.8 (83.8) |
24.5 (76.1) |
20.6 (69.1) |
26.3 (79.4) |
| Daily mean °C (°F) | 13.9 (57.0) |
15.2 (59.4) |
18.1 (64.6) |
22.4 (72.3) |
25.8 (78.4) |
27.8 (82.0) |
28.9 (84.0) |
28.8 (83.8) |
27.5 (81.5) |
24.7 (76.5) |
20.1 (68.2) |
15.5 (59.9) |
22.4 (72.3) |
| Mean daily minimum °C (°F) | 10.3 (50.5) |
11.7 (53.1) |
15.2 (59.4) |
19.5 (67.1) |
22.7 (72.9) |
24.8 (76.6) |
25.5 (77.9) |
25.4 (77.7) |
24.0 (75.2) |
20.8 (69.4) |
15.9 (60.6) |
11.5 (52.7) |
18.9 (66.1) |
| Record low °C (°F) | 0.1 (32.2) |
1.3 (34.3) |
3.2 (37.8) |
7.7 (45.9) |
14.6 (58.3) |
18.8 (65.8) |
21.6 (70.9) |
20.9 (69.6) |
15.5 (59.9) |
9.5 (49.1) |
4.9 (40.8) |
0.0 (32.0) |
0.0 (32.0) |
| Average rainfall mm (inches) | 40.9 (1.61) |
69.4 (2.73) |
84.7 (3.33) |
201.2 (7.92) |
283.7 (11.17) |
276.2 (10.87) |
232.5 (9.15) |
227.0 (8.94) |
166.2 (6.54) |
87.3 (3.44) |
35.4 (1.39) |
31.6 (1.24) |
1,736.1 (68.33) |
| Average rainy days (≥ 0.1 mm) | 7.5 | 11.2 | 15.0 | 16.3 | 18.3 | 18.2 | 15.9 | 16.8 | 12.5 | 7.1 | 5.5 | 4.9 | 149.2 |
| Average relative humidity (%)
|
72 | 78 | 82 | 84 | 84 | 84 | 82 | 82 | 78 | 72 | 66 | 66 | 78 |
| Mean monthly sunshine hours | 118.5 | 71.6 | 62.4 | 65.1 | 104.0 | 140.2 | 202.0 | 173.5 | 170.2 | 181.8 | 172.7 | 166.0 | 1,628 |
| Percent possible sunshine | 35 | 22 | 17 | 17 | 26 | 35 | 49 | 43 | 46 | 51 | 52 | 50 | 37 |
| Source: China Meteorological Administration,[99] all-time extreme temperature[100] | |||||||||||||
| Climate data for Haikou (1981–2010 normals, extremes 1951–2015) | |||||||||||||
|---|---|---|---|---|---|---|---|---|---|---|---|---|---|
| Month | Jan | Feb | Mar | Apr | May | Jun | Jul | Aug | Sep | Oct | Nov | Dec | Year |
| Record high °C (°F) | 33.5 (92.3) |
37.2 (99.0) |
38.1 (100.6) |
39.6 (103.3) |
38.8 (101.8) |
38.4 (101.1) |
38.7 (101.7) |
37.3 (99.1) |
36.0 (96.8) |
34.5 (94.1) |
34.7 (94.5) |
31.5 (88.7) |
39.6 (103.3) |
| Mean daily maximum °C (°F) | 21.8 (71.2) |
22.9 (73.2) |
26.3 (79.3) |
30.7 (87.3) |
32.3 (90.1) |
33.7 (92.7) |
33.5 (92.3) |
32.6 (90.7) |
30.7 (87.3) |
29.1 (84.4) |
26.2 (79.2) |
22.4 (72.3) |
28.5 (83.3) |
| Daily mean °C (°F) | 18.4 (65.1) |
19.4 (66.9) |
22.2 (72.0) |
26.0 (78.8) |
27.9 (82.2) |
29.0 (84.2) |
29.1 (84.4) |
28.6 (83.5) |
27.4 (81.3) |
26.0 (78.8) |
23.3 (73.9) |
19.8 (67.6) |
24.8 (76.6) |
| Mean daily minimum °C (°F) | 16.1 (61.0) |
17.2 (63.0) |
19.6 (67.3) |
23.2 (73.8) |
25.1 (77.2) |
25.9 (78.6) |
26.0 (78.8) |
25.9 (78.6) |
25.0 (77.0) |
23.7 (74.7) |
21.0 (69.8) |
17.8 (64.0) |
22.2 (72.0) |
| Record low °C (°F) | 2.8 (37.0) |
6.5 (43.7) |
6.4 (43.5) |
9.8 (49.6) |
16.3 (61.3) |
21.2 (70.2) |
21.0 (69.8) |
21.7 (71.1) |
17.5 (63.5) |
14.1 (57.4) |
10.0 (50.0) |
5.3 (41.5) |
2.8 (37.0) |
| Average rainfall mm (inches) | 20.3 (0.80) |
38.2 (1.50) |
50.4 (1.98) |
90.1 (3.55) |
175.6 (6.91) |
220.5 (8.68) |
214.7 (8.45) |
262.1 (10.32) |
255.8 (10.07) |
221.9 (8.74) |
72.4 (2.85) |
34.3 (1.35) |
1,656.3 (65.2) |
| Average rainy days (≥ 0.1 mm) | 8.4 | 10.6 | 10.1 | 11.5 | 16.5 | 16.0 | 15.0 | 14.9 | 14.3 | 12.5 | 7.9 | 7.3 | 145.0 |
| Average relative humidity (%)
|
85 | 87 | 85 | 82 | 81 | 81 | 80 | 82 | 83 | 79 | 79 | 80 | 82 |
| Mean monthly sunshine hours | 109.1 | 98.7 | 137.3 | 167.9 | 218.1 | 222.8 | 251.3 | 217.7 | 193.8 | 176.7 | 144.8 | 131.3 | 2,069.5 |
| Percent possible sunshine | 32 | 31 | 37 | 45 | 54 | 56 | 61 | 55 | 53 | 49 | 43 | 39 | 47 |
| Source: China Meteorological Administration (precipitation days and sunshine 1971–2000),[8][101][102] all-time extreme temperature[103] | |||||||||||||
Climate change

Gallery
-
![Typhoon Saomai was one of the most powerful typhoons to hit China.[26]](//upload.wikimedia.org/wikipedia/commons/thumb/9/9d/Saomai_2006-08-09_1350Z.jpg/101px-Saomai_2006-08-09_1350Z.jpg) Typhoon Saomai was one of the most powerful typhoons to hit China.[26]
Typhoon Saomai was one of the most powerful typhoons to hit China.[26] -
 Typhoon Nina on August 2 1975.
 -
 Flooding in China during the 1931 floods
 -

-
 Snow encircling the area around the Bo Hai
 -
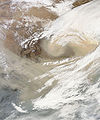 A sandstorm blowing from Inner Mongolia in 2010
 -

![Typhoon Saomai was one of the most powerful typhoons to hit China.[26]](/File:Saomai_2006-08-09_1350Z.jpg)


See also
- Geography of China
- Climate change in China
- Environmental issues in China
- Geography of Taiwan
- East Asia
- East Asian Monsoon
- Hot summer cold winter zone
Notes
- ^ Mean monthly maxima and minima (i.e. the expected highest and lowest temperature readings at any point during the year or given month) calculated based on data in Hong Kong from 1991 to 2020.
References
- ^ "China logs 52.2 Celsius as extreme weather rewrites records". Reuters. 2023-07-17. Retrieved 2023-07-17.
- ISSN 0261-3077. Retrieved 2023-07-17.
- ^ "China just saw its coldest temperature on record: Minus-63 degrees". The Washington Post. 23 January 2022. Retrieved 25 January 2022.
- ^ "China's northernmost city just saw its coldest day ever". CNN Travel. 24 January 2022. Retrieved 25 January 2023.
- ^ a b "The 6 climate zones of China". ClimateList. Retrieved 2018-12-19.
- ISBN 978-1-4822-5806-6.
- ^ 中国气象数据网 - WeatherBk Data (in Chinese (China)). China Meteorological Administration. Retrieved 2020-04-15.
- ^ a b 中国气象数据网 - WeatherBk Data (in Chinese (China)). China Meteorological Administration. Retrieved 2020-04-15.
- ^ 为什么重庆、武汉、南京有"三大火炉"之称? (in Chinese). Guangzhou Popular Science News Net (广州科普资讯网). 2007-09-12. Archived from the original on 2014-11-12. Retrieved 2010-11-29.
- ^ "存档副本". Archived from the original on 2013-10-02. Retrieved 2013-09-29.
- ^ "吐鲁番城市介绍" 吐鲁番 – 气象数据 – 中国天气网. 中国天气. Archived from the original on 14 October 2013. Retrieved 30 June 2012.
- ^ "If you can stand the heat, then the Turpan Basin is the place to be". Shanghai Daily. April 5, 2010. Archived from the original on April 7, 2010.
- ISBN 978-7-5623-0484-5
- ^ (PDF) from the original on 2016-09-23, retrieved 2016-04-25
- ISBN 978-3-540-79242-0.
- ISBN 0-8351-2319-7 – via Internet Archive.
- .
- .
- ISBN 978-90-04-15711-8.
- ISBN 978-1-5015-0189-0
- ISSN 0033-8222.
- S2CID 129650707.
- ^ "World Meteorological Organization's World Weather & Climate Extremes Archive".
- ^ "The 16 deadliest storms of the last century". Business Insider India. September 13, 2017. Archived from the original on January 7, 2022. Retrieved February 23, 2022.
- ^ Anderson-Berry, Linda J.; Weyman James C. (2008-02-26). "Fifth International Workshop on Tropycal Cyclones: Topic 5.1: Societal Impacts of Tropical Cyclones". World Meteorological Organization. National Oceanic and Atmospheric Administration. Archived from the original on 2012-11-14. Retrieved 2011-03-31.
- ^ a b Duan Yihong (2006). Typhoons Bilis and Saomai: why the impacts were so severe (Report). World Meteorological Organization. Archived from the original on July 14, 2014. Retrieved July 5, 2014.
- Guy Carpenter. November 2006. Archived from the original(PDF) on February 18, 2012. Retrieved July 5, 2014.
- ^ "Typhoon Haiyan affects over 1,200 Hainan villages". Xinhua News Agency. November 12, 2013. Archived from the original on November 26, 2013. Retrieved November 12, 2013.
- ^ a b China Meteorological Administration (November 22, 2013). Member Report: China (PDF). ESCAP/WMO Typhoon Committee: 8th Integrated Workshop/2nd TRCG Forum. ESCAP/WMO Typhoon Committee. p. 16. Archived (PDF) from the original on December 3, 2013. Retrieved November 26, 2013.
- ^ "Typhoon Fitow kills five in China". BBC.com. 2013-10-07. Retrieved 2014-03-07.
- ^ "Typhoon-ravaged Chinese city recovers from flooding". ReliefWeb. Xinhua. 2013-10-18. Retrieved 2014-03-08.
- ^ Zhang Hong (2013-10-10). "Fitow's remnants continue to batter Zhejiang province". South China Morning Post. – via Lexis Nexis (subscription required)
- ^ "Typhoon Fitow-triggered downpours lash E. China". Xinhua. 2013-10-08. Archived from the original on October 12, 2013. Retrieved 2014-03-08.
- ^ Member Report: China (PDF) (Report). 8th Integrated Workshop/2nd TRCG Forum. ESCAP/WMO Typhoon Committee. 2013. Retrieved 2014-03-06.
- ^ "Typhoon In-Fa sweeps towards China after flooding chaos". BBC News. 2021-07-24. Archived from the original on July 25, 2021. Retrieved 2021-07-25.
- ^ Meili, Cao (2021-07-26). 余姚暴雨累计雨量达951毫米 相当于余姚近三天下了约37个西湖的水量. Sina News (in Chinese). Archived from the original on 2021-07-27. Retrieved 2021-07-27.
- ^ "China - Tropical Cylone IN-FA (GDACS, JTWC, CMA, Xinhua, media) (ECHO Daily Flash of 26 July 2021) - China". ReliefWeb. Archived from the original on July 26, 2021. Retrieved 2021-07-26.
- ^ Henson, Bob; Masters, Jeff (14 September 2022). "Typhoon Muifa sweeps into Shanghai; Caribbean eyes new tropical depression". Yale Climate Connections. Retrieved 14 September 2022.
- ^ "Dealing with the Deluge". PBS NOVA Online. 26 March 1996. Retrieved 12 February 2013.
- ISBN 1-55963-919-9. p. 252.
- ISBN 0-19-828777-1.
- ^ ISBN 978-0-87044-437-1.
- ISBN 0-415-93388-9. pp. xvii, 61–70.
- ^ "被遗忘的1931年中国水灾" (in Chinese). Tsinghua University Institute of Qing History. Archived from the original on 3 April 2016. Retrieved 20 January 2019.
- ^ a b "Yangtze River floods". Encyclopedia Britannica. Archived from the original on January 21, 2018. Retrieved January 20, 2018.
- ISBN 0-8065-2558-4. p 37.
- ^ "Global Catastrophe Recap November 2020 Archived 2022-10-09 at Ghost Archive" (PDF). Aon. December 10, 2020. Retrieved December 19, 2020.
- ^ "Flood destruction in China cost $32B, authorities say". UPI. Retrieved 2020-12-19.
- ^ "China weather: Tornado and hail kill scores in Jiangsu". BBC. June 23, 2016. Retrieved June 23, 2016.
- ^ "江苏盐城龙卷风冰雹已造成98人死800人伤" (in Chinese). Sina Corp. June 24, 2016. Retrieved June 24, 2016.
- (PDF) from the original on March 16, 2017. Retrieved March 15, 2024.
- ^ a b 中国地面国际交换站气候标准值数据集 (1971–2000年) (in Simplified Chinese). China Meteorological Administration. May 2011. Archived from the original on 21 September 2013. Retrieved 23 May 2011.
- ^ 中国地面国际交换站气候标准值月值数据集(1971-2000年). China Meteorological Administration. Archived from the original on 2013-09-21. Retrieved 2010-05-25.
- ^ "Climate of Hong Kong". Hong Kong Observatory. Archived from the original on 2 June 2017. Retrieved 5 September 2017.
- ^ "Environmental Performance Index | Environmental Performance Index". Retrieved 15 August 2022.
- ^ China Weighs Environmental Costs; Beijing Tries to Emphasize Cleaner Industry Over Unbridled Growth After Signs Mount of Damage Done Archived 30 September 2019 at the Wayback Machine 23 July 2013
- ^ Waghorn, Terry (7 March 2011). "Fighting Desertification". Forbes. Retrieved 21 January 2020.
- ^ "Beijing hit by eighth sandstorm". BBC News. 17 April 2006. Retrieved 21 January 2020.
- ^ Coonan, Clifford (9 November 2007). "The gathering sandstorm: Encroaching desert, missing water". The Independent. Archived from the original on 24 April 2008. Retrieved 23 July 2014.
- ^ Reilly, Michael (24 November 2008). "Himalaya glaciers melting much faster". NBC News. Retrieved 21 September 2011.
- ^ China's New Growth Pathway: From the 14th Five-Year Plan to Carbon Neutrality (PDF) (Report). Energy Foundation China. December 2020. p. 24. Archived from the original (PDF) on 16 April 2021. Retrieved 16 December 2020.
- ^ Chow, Gregory (2006) Are Chinese Official Statistics Reliable? CESifo Economic Studies 52. 396–414. 10.1093/cesifo/ifl003
- PMID 32978301.
- FAOSTAT. Retrieved 16 January 2020.
- ^ 1991-2020 normals "Climate averages from 1991 to 2020". China Meteorological Administration. Archived from the original on 2023-04-17.
- ^ 1981-2010 extremes 中国气象数据网 – WeatherBk Data (in Simplified Chinese). China Meteorological Administration. Retrieved 14 April 2023.
- ^ "Extreme Temperatures Around the World". Retrieved 2013-02-21.
- ^ 2021 February weather data "Global Surface Summary of the Day - GSOD". National Oceanic and Atmospheric Administration. Archived from the original on 2023-04-30. Retrieved 30 April 2023.
- ^ Burt, Christopher C. "UPDATE June 1: Record May Heat Wave in Northeast China, Koreas". Wunderground. Retrieved 2014-06-01.
- ^ Burt, Christopher C. ": Record June Heat Wave in Northeast China, Koreas". Wunderground. Retrieved 2023-06-23.
- ^ "Beijing, China - Detailed climate information and monthly weather forecast". Weather Atlas. Yu Media Group. Retrieved 2019-07-09.
- ^ 中国气象局 国家气象信息中心 (in Simplified Chinese). China Meteorological Administration. June 2011. Archived from the original on July 10, 2014. Retrieved November 20, 2010.
- ^ a b "Index" 中国气象数据网 – WeatherBk Data. China Meteorological Administration. Archived from the original on 5 September 2018. Retrieved 9 November 2018.
- ^ 中国地面国际交换站气候标准值月值数据集(1971-2000年) (in Chinese (China)). China Meteorological Administration. Archived from the original on 2013-10-16. Retrieved 2009-03-17.
- ^ 哈尔滨城市介绍以及气候背景分析. Weather China (in Chinese (China)). 中国气象局公共气象服务中心. Archived from the original on 30 June 2013. Retrieved 27 July 2013.
- ^ "Harbin, China - Detailed climate information and monthly weather forecast". Weather Atlas. Yu Media Group. Archived from the original on 2019-07-09. Retrieved 2019-07-09.
- ^ 中国气象数据网 – WeatherBk Data (in Simplified Chinese). China Meteorological Administration. Retrieved 10 October 2023.
- ^ 中国气象数据网 (in Simplified Chinese). China Meteorological Administration. Retrieved 10 October 2023.
- ^ 中国地面国际交换站气候标准值月值数据集(1971-2000年). China Meteorological Administration. Archived from the original on 2013-09-21. Retrieved 2010-05-25.
- ^ "Extreme Temperatures Around the World". Retrieved 2010-08-28.
- ^ 中国地面国际交换站气候标准值月值数据集(1971-2000年) (in Chinese). China Meteorological Administration. Archived from the original on 2013-09-21. Retrieved 2010-05-04.
- ^ "Extreme Temperatures Around the World". Retrieved 2013-02-21.
- ^ "55591: Lhasa (China)". ogimet.com. OGIMET. 28 March 2022. Retrieved 29 March 2022.
- ^ "Index" 中国气象数据网 - WeatherBk Data. China Meteorological Administration. Archived from the original on 23 September 2017. Retrieved 9 November 2018.
- ^ "Monthly weather forecast and climate - Chongqing, China". Weather Atlas. Retrieved 12 June 2020.
- ^ 中国气象数据网 – WeatherBk Data (in Chinese (China)). China Meteorological Administration. Retrieved April 15, 2020.
- ^ 中国地面国际交换站气候标准值月值数据集(1971–2000年). China Meteorological Administration. Archived from the original on September 21, 2013. Retrieved May 25, 2010.
- ^ 中国气象局 国家气象信息中心 (in Simplified Chinese). China Meteorological Administration. June 2011. Archived from the original on 2009-07-16. Retrieved 2009-03-17.
- ^ "Extreme Temperatures Around the World". Archived from the original on August 4, 2014. Retrieved February 21, 2013.
- ^ 中国地面国际交换站气候标准值月值数据集 (in Chinese). China Meteorological Administration. Retrieved 2014-06-11.
- ^ CMA台站气候标准值(1991-2020) (in Chinese). China Meteorological Administration. Retrieved 2023-04-11.
- ^ 中国气象局 国家气象信息中心 (in Simplified Chinese). China Meteorological Administration. Archived from the original on 2013-03-18. Retrieved 2013-02-18.
- ^ "Index" 中国气象数据网 – WeatherBk Data. China Meteorological Administration. Archived from the original on 2018-09-05. Retrieved 2018-11-09.
- ^ 中国气象数据网 – WeatherBk Data (in Chinese (China)). China Meteorological Administration. Retrieved 2020-04-15.
- ^ 中国地面国际交换站气候标准值月值数据集(1971-2000年). China Meteorological Administration. Archived from the original on 2013-09-21. Retrieved 2010-05-25.
- ^ "Monthly Meteorological Normals for Hong Kong (1991-2020)". Hong Kong Observatory. Retrieved 7 February 2021.
- ^ "Extreme Values and Dates of Occurrence of Extremes of Meteorological Elements between 1884-1939 and 1947-2020 for Hong Kong)". Hong Kong Observatory. Retrieved 7 February 2021.
- ^ "Monthly Data for Single Element". Hong Kong Observatory. Retrieved 16 February 2022.
- ^ 中国地面国际交换站气候标准值月值数据集(1971-2000年) (in Chinese). China Meteorological Administration. Archived from the original on 2013-09-21. Retrieved August 12, 2016.
- ^ "Extreme Temperatures Around the World". Archived from the original on August 4, 2014. Retrieved 2010-12-01.
- ^ "无标题文档". Archived from the original on 2014-07-10. Retrieved 2020-04-22.
- ^ 中国地面国际交换站气候标准值月值数据集(1971-2000年). China Meteorological Administration. Archived from the original on 2013-09-21. Retrieved 2010-05-25.
- ^ "Extreme Temperatures Around the World". Retrieved 2013-02-21.
- ^ World Bank. "China Country Climate and Development Report" (PDF).
- ^ "China National communication 3: Part III Impacts of Climate Change and Adaptation". unfccc.int. Archived from the original on 14 November 2019. Retrieved 26 September 2019.
- ^ "DataBank - CO2 emissions (metric tons per capita)". The World Bank. Archived from the original on 3 October 2020. Retrieved 10 August 2020.
- from the original on 24 July 2021. Retrieved 24 July 2021.
high-income resource-poor nations such as the United Kingdom, Germany and France (...) outsource carbon-intensive production to China
- from the original on 25 July 2021. Retrieved 24 July 2021.
- ^ "Who has contributed most to global CO2 emissions?". Our World in Data. Archived from the original on 25 October 2021. Retrieved 28 October 2021.
- ^ "The hard truths of climate change — by the numbers". www.nature.com. Archived from the original on 26 August 2022. Retrieved 28 October 2021.
- ^ Regan, Helen (2024-01-05). "2023 was China's hottest year on record, marked by multiple deadly extreme weather events". CNN. Retrieved 2024-01-07.
- ^ "Climate change: China aims for 'carbon neutrality by 2060'". BBC News. 22 September 2020. Archived from the original on 26 January 2021. Retrieved 22 September 2020.
- ^ Lui, Swithin (19 May 2022). "Guest post: Why China is set to significantly overachieve its 2030 climate goals". Carbon Brief. Archived from the original on 23 May 2022. Retrieved 24 May 2022.