
Geography of El Salvador
72 km2 (28 sq mi)
Plate tectonics
.jpg)
El Salvador, along with the rest of Central America, is one of the most seismologically active regions on earth, situated atop three of the large tectonic plates that constitute the Earth's surface.[1] The motion of these plates causes the area's earthquake and volcanic activity.[1]
Most of Central America and the Caribbean Basin rests on the relatively motionless Caribbean Plate. The Pacific Ocean floor, however, is being carried northeast by the underlying motion of the Cocos Plate.[1] Ocean floor material is largely composed of basalt, which is relatively dense; when it collides with the lighter granite rocks of Central America, the ocean floor is forced down under the land mass, creating the deep Middle America Trench that lies off the coast of El Salvador.[1]
The subduction of the Cocos Plate accounts for the frequency of earthquakes near the coast.[1] As the rocks constituting the ocean floor are forced down, they melt, and the molten material pours up through weaknesses in the surface rock, producing volcanoes and geysers.[1]
North of El Salvador, Mexico and most of Guatemala are riding on the westward-moving North American Plate that butts against the northern edge of the stationary Caribbean Plate in southern Guatemala.[1] The grinding action of these two plates creates a fault (similar to the San Andreas fault in California) that runs the length of the valley of the Rio Motagua in Guatemala.[1] Motion along this fault is the source of earthquakes in northernmost El Salvador.[1]
El Salvador has a long history of destructive earthquakes and volcanic eruptions.[1] San Salvador was destroyed in 1756 and 1854, and suffered heavy damage in the 1919, 1982, and 1986 tremors.[1] The country has over twenty volcanoes, although only two, San Miguel and Izalco, have been active in recent years.[1] From the early nineteenth century to the mid-1950s, Izalco erupted with a regularity that earned it the name "Lighthouse of the Pacific".[1] Its brilliant flares were clearly visible for great distances at sea, and at night its glowing lava turned it into a brilliant luminous cone.[1]
Physical features
-
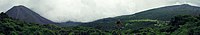 View of Izalco (volcano) and Santa Ana Volcano from Cerro Verde
 -

-
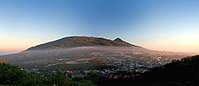
 View of San Salvador city and San Salvador (volcano)
 -
 View of San Salvador city from San Salvador (volcano)
 -
-
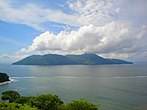
 View of Gulf of Fonseca from Conchagua (volcano)
 -
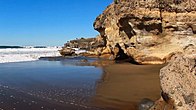
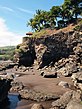
 El Balsamar, La Libertad Department (El Salvador)
.jpg)


Two parallel mountain ranges cross El Salvador to the west with a central plateau between them and a narrow coastal plain hugging the Pacific.[1] These physical features divide the country into two physiographic regions.[1] The mountain ranges and central plateau, covering 85 percent of the land, comprise the interior highlands.[1] The remaining coastal plains are referred to as the Pacific lowlands.[1]
The northern range of mountains, the Sierra Madre, form a continuous chain along the border with Honduras. Elevations in this region range from 1,600 to 2,700 meters.[1] The area was once heavily forested, but overexploitation led to extensive erosion, and it has become semibarren.[1] As a result, it is the country's most sparsely populated zone, with little farming or other development.[1]
The southern range of mountains is actually a discontinuous chain of more than twenty volcanoes, clustered into five groups.
The central plateau constitutes only 25 percent of the land area but contains the heaviest concentration of population and the country's largest cities.
A narrow plain extends from the coastal volcanic range to the Pacific Ocean.
El Salvador has over 300 rivers, the most important of which is the
Numerous lakes of volcanic origin are found in the interior highlands; many of these lakes are surrounded by mountains and have high, steep banks.
Izalco has erupted at least 54 times since 1770.[2] It earned the nickname "Lighthouse of the Pacific" because it served as a beacon for ships during the night.[2]


.jpg)


Climate
-
 Corral de Mulas beach,Usulutan
 -
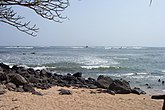 Los Cobanos beach inSonsonate
 -
 Sunzal beach, La Libertad, La Libertad
 -
 Pacific sunset at Salinitas beachSonsonate
 -
 Meanguera island Gulf of Fonseca
 -

-
 El Balsamar, La Libertad Department (El Salvador)
 -
 El Sunzal beach in La Libertad, La Libertad
 -
 El Zonte Beach


.jpg)

_-_panoramio.jpg)

El Salvador has a
The rainy season, known locally as invierno, or winter, extends from May to October.
From November through April, the northeast trade winds control weather patterns.[1] During these months, air flowing from the Caribbean has lost most of its precipitation while passing over the mountains in Honduras.[1] By the time this air reaches El Salvador, it is dry, hot, and hazy.[1] This season is known locally as verano, or summer.[1]
Temperatures vary little with season; elevation is the primary determinant.[1] The Pacific lowlands are the hottest region, with annual averages ranging from 25 to 29 °C (77.0 to 84.2 °F).[1] San Salvador is representative of the central plateau, with an annual average temperature of 23 °C (73 °F) and absolute high and low readings of 38 and 6 °C (100.4 and 42.8 °F), respectively.[1] Mountain areas are the coolest, with annual averages from 12 to 23 °C (53.6 to 73.4 °F) and minimum temperatures sometimes approaching freezing.[1]
| Climate data for San Salvador (Ilopango International Airport) 1981-2010, extremes 1957-present | |||||||||||||
|---|---|---|---|---|---|---|---|---|---|---|---|---|---|
| Month | Jan | Feb | Mar | Apr | May | Jun | Jul | Aug | Sep | Oct | Nov | Dec | Year |
| Record high °C (°F) | 36.0 (96.8) |
36.1 (97.0) |
37.2 (99.0) |
38.4 (101.1) |
36.7 (98.1) |
34.6 (94.3) |
34.5 (94.1) |
35.1 (95.2) |
33.3 (91.9) |
35.6 (96.1) |
35.3 (95.5) |
35.7 (96.3) |
38.4 (101.1) |
| Mean daily maximum °C (°F) | 30.8 (87.4) |
32.0 (89.6) |
32.7 (90.9) |
32.7 (90.9) |
31.1 (88.0) |
30.1 (86.2) |
30.3 (86.5) |
30.5 (86.9) |
29.5 (85.1) |
29.5 (85.1) |
29.9 (85.8) |
30.2 (86.4) |
30.8 (87.4) |
| Daily mean °C (°F) | 22.8 (73.0) |
23.6 (74.5) |
24.2 (75.6) |
25.0 (77.0) |
24.6 (76.3) |
23.9 (75.0) |
23.9 (75.0) |
23.9 (75.0) |
23.3 (73.9) |
23.3 (73.9) |
23.0 (73.4) |
22.8 (73.0) |
23.7 (74.7) |
| Mean daily minimum °C (°F) | 16.9 (62.4) |
17.6 (63.7) |
18.4 (65.1) |
19.8 (67.6) |
20.4 (68.7) |
20.0 (68.0) |
19.5 (67.1) |
19.7 (67.5) |
19.6 (67.3) |
19.3 (66.7) |
18.4 (65.1) |
17.5 (63.5) |
18.9 (66.0) |
| Record low °C (°F) | 11.9 (53.4) |
12.0 (53.6) |
13.0 (55.4) |
12.0 (53.6) |
12.0 (53.6) |
15.5 (59.9) |
13.5 (56.3) |
12.2 (54.0) |
15.0 (59.0) |
12.5 (54.5) |
11.1 (52.0) |
12.0 (53.6) |
11.1 (52.0) |
| Average rainfall mm (inches) | 1 (0.0) |
2 (0.1) |
10 (0.4) |
36 (1.4) |
176 (6.9) |
279 (11.0) |
355 (14.0) |
319 (12.6) |
338 (13.3) |
208 (8.2) |
53 (2.1) |
9 (0.4) |
1,786 (70.4) |
| Average rainy days (≥ 0.1 mm) | 1 | 1 | 1 | 5 | 13 | 20 | 20 | 20 | 20 | 16 | 4 | 2 | 123 |
| Average relative humidity (%)
|
67 | 66 | 67 | 72 | 80 | 83 | 82 | 83 | 86 | 83 | 76 | 72 | 77 |
| Mean monthly sunshine hours | 301 | 277 | 294 | 243 | 220 | 174 | 239 | 257 | 180 | 211 | 267 | 294 | 2,957 |
| Source 1: Ministerio de Medio Ambiente y Recursos Naturales[3] | |||||||||||||
| Source 2: Danish Meteorological Institute (precipitation days and sun 1931–1960),[4] Meteo Climat (record highs and lows)[5] | |||||||||||||
| Climate data for Santa Ana, El Salvador (1981–2010) | |||||||||||||
|---|---|---|---|---|---|---|---|---|---|---|---|---|---|
| Month | Jan | Feb | Mar | Apr | May | Jun | Jul | Aug | Sep | Oct | Nov | Dec | Year |
| Record high °C (°F) | 33.5 (92.3) |
35.7 (96.3) |
37.0 (98.6) |
36.0 (96.8) |
35.4 (95.7) |
33.8 (92.8) |
32.7 (90.9) |
33.6 (92.5) |
32.3 (90.1) |
32.5 (90.5) |
32.5 (90.5) |
33.5 (92.3) |
37.0 (98.6) |
| Mean daily maximum °C (°F) | 30.8 (87.4) |
32.1 (89.8) |
33.7 (92.7) |
34.1 (93.4) |
32.3 (90.1) |
30.9 (87.6) |
31.1 (88.0) |
31.1 (88.0) |
30.3 (86.5) |
30.1 (86.2) |
30.0 (86.0) |
30.3 (86.5) |
31.4 (88.5) |
| Daily mean °C (°F) | 23.7 (74.7) |
24.6 (76.3) |
25.7 (78.3) |
26.6 (79.9) |
26.2 (79.2) |
25.3 (77.5) |
25.3 (77.5) |
25.3 (77.5) |
24.7 (76.5) |
24.5 (76.1) |
24.0 (75.2) |
23.8 (74.8) |
25.0 (77.0) |
| Mean daily minimum °C (°F) | 16.3 (61.3) |
17.0 (62.6) |
17.7 (63.9) |
18.9 (66.0) |
19.6 (67.3) |
19.5 (67.1) |
19.2 (66.6) |
19.3 (66.7) |
19.1 (66.4) |
19.0 (66.2) |
17.8 (64.0) |
16.9 (62.4) |
18.4 (65.1) |
| Record low °C (°F) | 11.0 (51.8) |
8.0 (46.4) |
11.6 (52.9) |
13.0 (55.4) |
14.5 (58.1) |
13.0 (55.4) |
15.0 (59.0) |
15.5 (59.9) |
15.4 (59.7) |
15.0 (59.0) |
12.5 (54.5) |
10.0 (50.0) |
8.0 (46.4) |
| Average precipitation mm (inches) | 2 (0.1) |
6 (0.2) |
8 (0.3) |
57 (2.2) |
188 (7.4) |
322 (12.7) |
297 (11.7) |
313 (12.3) |
315 (12.4) |
185 (7.3) |
38 (1.5) |
13 (0.5) |
1,745 (68.7) |
| Average relative humidity (%)
|
66 | 63 | 63 | 64 | 73 | 80 | 77 | 78 | 82 | 78 | 72 | 68 | 72 |
| Mean monthly sunshine hours | 310.0 | 271.2 | 291.4 | 258.0 | 254.2 | 198.0 | 263.5 | 260.4 | 204.0 | 229.4 | 267.0 | 303.8 | 3,110.9 |
| Mean daily sunshine hours | 10.0 | 9.6 | 9.4 | 8.6 | 8.2 | 6.6 | 8.5 | 8.4 | 6.8 | 7.4 | 8.9 | 9.8 | 8.5 |
| Source 1: Ministerio de Medio Ambiente y Recursos Naturales[6] | |||||||||||||
| Source 2: Deutscher Wetterdienst (precipitation days and sun)[7] | |||||||||||||
| Climate data for San Miguel, El Salvador (1981–2010) | |||||||||||||
|---|---|---|---|---|---|---|---|---|---|---|---|---|---|
| Month | Jan | Feb | Mar | Apr | May | Jun | Jul | Aug | Sep | Oct | Nov | Dec | Year |
| Mean daily maximum °C (°F) | 36.9 (98.4) |
38.0 (100.4) |
38.4 (101.1) |
38.6 (101.5) |
36.2 (97.2) |
34.4 (93.9) |
34.9 (94.8) |
34.9 (94.8) |
33.9 (93.0) |
33.2 (91.8) |
34.2 (93.6) |
35.6 (96.1) |
35.7 (96.3) |
| Daily mean °C (°F) | 27.6 (81.7) |
28.4 (83.1) |
29.5 (85.1) |
30.6 (87.1) |
29.8 (85.6) |
28.6 (83.5) |
28.5 (83.3) |
28.5 (83.3) |
27.9 (82.2) |
27.6 (81.7) |
27.4 (81.3) |
27.3 (81.1) |
28.5 (83.3) |
| Mean daily minimum °C (°F) | 18.3 (64.9) |
18.9 (66.0) |
20.5 (68.9) |
22.7 (72.9) |
23.3 (73.9) |
22.8 (73.0) |
22.2 (72.0) |
22.2 (72.0) |
22.3 (72.1) |
22.0 (71.6) |
20.6 (69.1) |
19.0 (66.2) |
21.2 (70.2) |
| Average precipitation mm (inches) | 1 (0.0) |
1 (0.0) |
6 (0.2) |
24 (0.9) |
207 (8.1) |
239 (9.4) |
212 (8.3) |
255 (10.0) |
321 (12.6) |
210 (8.3) |
59 (2.3) |
7 (0.3) |
1,544 (60.8) |
| Average relative humidity (%)
|
59 | 57 | 57 | 62 | 71 | 77 | 75 | 76 | 81 | 81 | 73 | 64 | 70 |
| Source: Ministerio de Medio Ambiente y Recursos Naturales[8] | |||||||||||||
Other facts
-

-
 Geothermal power plant inAhuachapan Department
 -
 Geothermal power center in the Usulután Department
 -
 Central Hydroelectricity dam over the Lempa River


The total land area of El Salvador is 23,041 km2, with 20,721 km2 of land and 320 km2 of water. El Salvador is about the size of Israel and the U.S states of New Jersey and Vermont, but has the population size of Libya and Lebanon. El Salvador has 590 km of borders, including 391 km of borders with Honduras and 199 km with Guatemala. El Salvador has a coastline of 307 km.
El Salvador claims a
The lowest point of elevation in El Salvador is the Pacific Ocean, at sea level. The highest point is Cerro El Pital, at 2,730 m.
Maritime claims:
Exclusive economic zone:
90,962 km2 (35,121 sq mi)
Natural resources: Hydropower, geothermal power, petroleum, arable land
Land use (2012 estimate) includes 34.03 percent arable land, 10.86 percent permanent crops, 55.12 percent other.
Irrigated land: 449.9 km2 (2003)
Total renewable water resources: 25.23 km3 (2011)
Natural hazards: El Salvador is known as the "Land of Volcanoes"; there are frequent and sometimes very destructive earthquakes and volcanic activity;[9] hurricanes rarely make direct landfall.[10]
Extreme points
- Northernmost point – north of El Limo, Santa Ana Department
- Southernmost point – El Jaguey, La Unión Department
- Westernmost point – border with Guatemala, Ahuachapán Department
- Easternmost point – island of Meanguera del Golfo, La Unión Department
- Highest point – Cerro El Pital: 2730 m
- Lowest point – Pacific Ocean: 0 m
Environmental issues
Deforestation; soil erosion; water pollution; contamination of soils from disposal of toxic wastes.
El Salvador is party to the
References
- ^ OCLC 44362656.
- ^ )
- ^ "Normales Climatológicas 1981-2010" (in Spanish). Ministerio de Medio Ambiente y Recursos Naturales. Archived from the original on 14 September 2019. Retrieved 14 September 2019.
- ^ Cappelen, John; Jensen, Jens. "El Salvador – San Salvador (pg 85)" (PDF). Climate Data for Selected Stations (1931–1960) (in Danish). Danish Meteorological Institute. Archived from the original (PDF) on 27 April 2013. Retrieved 18 December 2012.
- ^ "Station San Salvador" (in French). Meteo Climat. Retrieved 2 May 2017.
- ^ "Normales Climatológicas 1981-2010" (in Spanish). Ministerio de Medio Ambiente y Recursos Naturales. Archived from the original on September 14, 2019. Retrieved September 15, 2019.
- ^ "Klimatafel von Santa Ana / El Salvador" (PDF). Baseline climate means (1961-1990) from stations all over the world (in German). Deutscher Wetterdienst. Retrieved May 2, 2017.
- ^ "Normales Climatológicas 1981-2010" (in Spanish). Ministerio de Medio Ambiente y Recursos Naturales. Archived from the original on September 14, 2019. Retrieved September 15, 2019.
- ^ "Fast Facts: Republic of El Salvador". Nat Geo Kids. National Geographic Partners, LLC. Retrieved 22 January 2021.
- ^ "Current Hurricanes in El Salvador". Worlddata.info. Retrieved 9 August 2022.
 This article incorporates public domain material from The World Factbook. CIA.
| History |  | ||||
|---|---|---|---|---|---|
| Geography | |||||
| Politics | |||||
| Economy | |||||
| Society |
| ||||
| Sovereign states |  | |
|---|---|---|
Dependencies and other territories |
| |