
Crawford County, Illinois
Crawford County | |
|---|---|
UTC−5 (CDT) | |
| Congressional district | 12th |
| Website | crawfordcountyil |
Crawford County is a
History
Crawford County was formed in the
-
 Crawford County when it was created in 1816, extending north to Lake Superior.
 -
 Crawford County between 1819 and 1821
 -
 Crawford between 1821 and 1824
 -
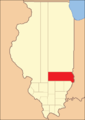
 Crawford between 1824 and 1831
 -
 In 1831, the creation of Jasper and Effingham Counties reduced Crawford to its current size.


In 1818, the town of Palestine was designated as the county seat. After elections in 1843, a new site was chosen, which would become the town of Robinson.[4]
Geography
According to the
Climate and weather
| Robinson, Illinois | ||||||||||||||||||||||||||||||||||||||||||||||||||||||||||||
|---|---|---|---|---|---|---|---|---|---|---|---|---|---|---|---|---|---|---|---|---|---|---|---|---|---|---|---|---|---|---|---|---|---|---|---|---|---|---|---|---|---|---|---|---|---|---|---|---|---|---|---|---|---|---|---|---|---|---|---|---|
| Climate chart (explanation) | ||||||||||||||||||||||||||||||||||||||||||||||||||||||||||||
| ||||||||||||||||||||||||||||||||||||||||||||||||||||||||||||
| ||||||||||||||||||||||||||||||||||||||||||||||||||||||||||||
In recent years, average temperatures in the county seat of Robinson have ranged from a low of 21 °F (−6 °C) in January to a high of 89 °F (32 °C) in July, although a record low of −23 °F (−31 °C) was recorded in December 1989 and a record high of 114 °F (46 °C) was recorded in July 1954. Average monthly precipitation ranged from 2.45 inches (62 mm) in January to 4.67 inches (119 mm) in May.[6]
Adjacent counties
- Clark County - north
- Sullivan County, Indiana - east
- Knox County, Indiana - southeast
- Lawrence County - south
- Richland County - southwest
- Jasper County - west
Transit
Major highways
Demographics
| Census | Pop. | Note | %± |
|---|---|---|---|
| 1820 | 3,022 | — | |
| 1830 | 3,117 | 3.1% | |
| 1840 | 4,422 | 41.9% | |
| 1850 | 7,135 | 61.4% | |
| 1860 | 11,551 | 61.9% | |
| 1870 | 13,889 | 20.2% | |
| 1880 | 16,197 | 16.6% | |
| 1890 | 17,283 | 6.7% | |
| 1900 | 19,240 | 11.3% | |
| 1910 | 26,281 | 36.6% | |
| 1920 | 22,771 | −13.4% | |
| 1930 | 21,085 | −7.4% | |
| 1940 | 21,294 | 1.0% | |
| 1950 | 21,137 | −0.7% | |
| 1960 | 20,751 | −1.8% | |
| 1970 | 19,824 | −4.5% | |
| 1980 | 20,818 | 5.0% | |
| 1990 | 19,464 | −6.5% | |
| 2000 | 20,452 | 5.1% | |
| 2010 | 19,817 | −3.1% | |
| 2020 | 18,679 | −5.7% | |
| 2023 (est.) | 18,300 | [7] | −2.0% |
| U.S. Decennial Census[8] 1790-1960[9] 1900-1990[10] 1990-2000[11] 2010[12] | |||

As of the
Of the 7,763 households, 28.5% had children under the age of 18 living with them, 52.6% were married couples living together, 9.4% had a female householder with no husband present, 33.6% were non-families, and 29.1% of all households were made up of individuals. The average household size was 2.36 and the average family size was 2.88. The median age was 41.7 years.[13]
The median income for a household in the county was $41,434 and the median income for a family was $51,218. Males had a median income of $40,050 versus $30,870 for females. The per capita income for the county was $21,545. About 11.1% of families and 16.9% of the population were below the
Communities
Cities
- Robinson (seat)
Villages
Census-designated places
Townships
Crawford County is divided into ten townships:
Unincorporated Communities
Politics
Although Crawford County was solidly Democratic before the
| Year | Republican | Democratic | Third party | |||
|---|---|---|---|---|---|---|
| No. | % | No. | % | No. | % | |
| 2020 | 7,043 | 74.60% | 2,202 | 23.32% | 196 | 2.08% |
| 2016 | 6,277 | 71.83% | 1,992 | 22.79% | 470 | 5.38% |
| 2012 | 5,585 | 64.69% | 2,858 | 33.11% | 190 | 2.20% |
| 2008 | 5,070 | 55.39% | 3,883 | 42.42% | 200 | 2.19% |
| 2004 | 6,083 | 65.18% | 3,194 | 34.23% | 55 | 0.59% |
| 2000 | 4,974 | 58.52% | 3,333 | 39.21% | 193 | 2.27% |
| 1996 | 3,965 | 45.61% | 3,627 | 41.72% | 1,101 | 12.67% |
| 1992 | 3,606 | 37.29% | 3,964 | 40.99% | 2,101 | 21.72% |
| 1988 | 4,951 | 57.76% | 3,555 | 41.48% | 65 | 0.76% |
| 1984 | 6,261 | 66.44% | 3,130 | 33.21% | 33 | 0.35% |
| 1980 | 5,894 | 60.70% | 3,372 | 34.73% | 444 | 4.57% |
| 1976 | 5,522 | 51.99% | 5,007 | 47.14% | 93 | 0.88% |
| 1972 | 6,568 | 65.32% | 3,477 | 34.58% | 10 | 0.10% |
| 1968 | 5,870 | 58.13% | 3,383 | 33.50% | 845 | 8.37% |
| 1964 | 4,834 | 46.22% | 5,624 | 53.78% | 0 | 0.00% |
| 1960 | 6,809 | 61.58% | 4,245 | 38.39% | 4 | 0.04% |
| 1956 | 6,747 | 63.28% | 3,906 | 36.63% | 9 | 0.08% |
| 1952 | 6,768 | 63.11% | 3,947 | 36.81% | 9 | 0.08% |
| 1948 | 5,111 | 54.58% | 4,150 | 44.32% | 103 | 1.10% |
| 1944 | 6,056 | 57.04% | 4,482 | 42.22% | 79 | 0.74% |
| 1940 | 7,036 | 54.95% | 5,703 | 44.54% | 66 | 0.52% |
| 1936 | 5,823 | 48.13% | 6,164 | 50.95% | 112 | 0.93% |
| 1932 | 4,550 | 42.13% | 6,081 | 56.31% | 169 | 1.56% |
| 1928 | 5,989 | 62.90% | 3,495 | 36.70% | 38 | 0.40% |
| 1924 | 4,830 | 51.25% | 4,223 | 44.81% | 372 | 3.95% |
| 1920 | 5,188 | 55.02% | 4,092 | 43.39% | 150 | 1.59% |
| 1916 | 5,084 | 46.28% | 5,570 | 50.71% | 331 | 3.01% |
| 1912 | 1,266 | 22.30% | 2,691 | 47.41% | 1,719 | 30.29% |
| 1908 | 3,090 | 49.42% | 2,890 | 46.23% | 272 | 4.35% |
| 1904 | 2,296 | 51.85% | 1,850 | 41.78% | 282 | 6.37% |
| 1900 | 2,301 | 49.11% | 2,299 | 49.07% | 85 | 1.81% |
| 1896 | 2,172 | 47.66% | 2,342 | 51.39% | 43 | 0.94% |
| 1892 | 1,790 | 45.44% | 1,875 | 47.60% | 274 | 6.96% |
See also
Sources
- Perrin, William Henry, ed.. History of Crawford and Clark Counties, Illinois Chicago, Illinois. O. L. Baskin & Co. (1883).
References
- Specific
- ^ "Crawford County, Illinois". United States Census Bureau. Retrieved June 8, 2023.
- ^ "Find a County". National Association of Counties. Archived from the original on May 31, 2011. Retrieved June 7, 2011.
- ^ Gannett, Henry (1905). The Origin of Certain Place Names in the United States. Govt. Print. Off. pp. 95.
- ^ Perrin, p. 42.
- ^ a b "Population, Housing Units, Area, and Density: 2010 - County". United States Census Bureau. Archived from the original on February 12, 2020. Retrieved July 11, 2015.
- ^ a b "Monthly Averages for Robinson, Illinois". The Weather Channel. Archived from the original on October 23, 2012. Retrieved January 27, 2011.
- ^ "Annual Estimates of the Resident Population for Counties: April 1, 2020 to July 1, 2023". United States Census Bureau. Retrieved April 2, 2024.
- ^ "U.S. Decennial Census". United States Census Bureau. Retrieved July 4, 2014.
- ^ "Historical Census Browser". University of Virginia Library. Archived from the original on August 11, 2012. Retrieved July 4, 2014.
- ^ "Population of Counties by Decennial Census: 1900 to 1990". United States Census Bureau. Archived from the original on April 24, 2014. Retrieved July 4, 2014.
- ^ "Census 2000 PHC-T-4. Ranking Tables for Counties: 1990 and 2000" (PDF). United States Census Bureau. Archived (PDF) from the original on December 18, 2014. Retrieved July 4, 2014.
- ^ "State & County QuickFacts". United States Census Bureau. Archived from the original on June 6, 2011. Retrieved July 4, 2014.
- ^ a b c "DP-1 Profile of General Population and Housing Characteristics: 2010 Demographic Profile Data". United States Census Bureau. Archived from the original on February 13, 2020. Retrieved July 11, 2015.
- ^ "DP02 SELECTED SOCIAL CHARACTERISTICS IN THE UNITED STATES – 2006-2010 American Community Survey 5-Year Estimates". United States Census Bureau. Archived from the original on February 13, 2020. Retrieved July 11, 2015.
- ^ "DP03 SELECTED ECONOMIC CHARACTERISTICS – 2006-2010 American Community Survey 5-Year Estimates". United States Census Bureau. Archived from the original on February 13, 2020. Retrieved July 11, 2015.
- ^ Leip, David. "Dave Leip's Atlas of U.S. Presidential Elections". uselectionatlas.org. Archived from the original on March 23, 2018.
- General
- United States Census Bureau 2007 TIGER/Line Shapefiles
- United States Board on Geographic Names (GNIS)
- United States National Atlas
External links
Places adjacent to Crawford County, Illinois | ||||||||||||||||
|---|---|---|---|---|---|---|---|---|---|---|---|---|---|---|---|---|
| ||||||||||||||||
 | ||||
Villages | ||||
| Townships | ||||
| CDPs | ||||
| Other unincorporated communities | ||||
| Ghost town | ||||
| Footnotes | ‡This populated place also has portions in an adjacent county or counties | |||
| ||||
| International | |
|---|---|
| National | |
| Geographic | |
| Other | |