
DeWitt County, Illinois
DeWitt County | |
|---|---|
UTC−5 (CDT) | |
| Congressional district | 15th |
| Website | www |
DeWitt County is a
DeWitt County is included in
The U.S. Census Bureau and the U.S. Geological Survey (USGS) list the county's name as De Witt, although the county uses the name DeWitt (no space).
History
-
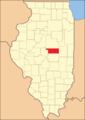 DeWitt County from its creation in 1839 to the splitting off of Piatt County in 1841
 -
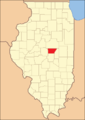
 DeWitt County from 1841 to 1845
 -
 DeWitt County in 1845, when it was reduced to its current size


Geography
According to the
Climate and weather
| Clinton, Illinois | ||||||||||||||||||||||||||||||||||||||||||||||||||||||||||||
|---|---|---|---|---|---|---|---|---|---|---|---|---|---|---|---|---|---|---|---|---|---|---|---|---|---|---|---|---|---|---|---|---|---|---|---|---|---|---|---|---|---|---|---|---|---|---|---|---|---|---|---|---|---|---|---|---|---|---|---|---|
| Climate chart (explanation) | ||||||||||||||||||||||||||||||||||||||||||||||||||||||||||||
| ||||||||||||||||||||||||||||||||||||||||||||||||||||||||||||
| ||||||||||||||||||||||||||||||||||||||||||||||||||||||||||||
In recent years, average temperatures in the county seat of Clinton have ranged from a low of 17 °F (−8 °C) in January to a high of 88 °F (31 °C) in July, although a record low of −25 °F (−32 °C) was recorded in February 1905 and a record high of 113 °F (45 °C) was recorded in July 1954. Average monthly precipitation ranged from 1.95 inches (50 mm) in February to 4.54 inches (115 mm) in July.[5]
Adjacent counties
- McLean County - north
- Piatt County - east
- Macon County - south
- Logan County - west
Transit
- SHOW Bus
Major highways
 Interstate 74
- US Route 51
- US Route 150
 Illinois Route 10
 Illinois Route 48
 Illinois Route 54
Demographics
| Census | Pop. | Note | %± |
|---|---|---|---|
| 1840 | 3,247 | — | |
| 1850 | 5,002 | 54.0% | |
| 1860 | 10,820 | 116.3% | |
| 1870 | 14,768 | 36.5% | |
| 1880 | 17,010 | 15.2% | |
| 1890 | 17,011 | 0.0% | |
| 1900 | 18,972 | 11.5% | |
| 1910 | 18,906 | −0.3% | |
| 1920 | 19,252 | 1.8% | |
| 1930 | 18,598 | −3.4% | |
| 1940 | 18,244 | −1.9% | |
| 1950 | 16,894 | −7.4% | |
| 1960 | 17,253 | 2.1% | |
| 1970 | 16,975 | −1.6% | |
| 1980 | 18,108 | 6.7% | |
| 1990 | 16,516 | −8.8% | |
| 2000 | 16,798 | 1.7% | |
| 2010 | 16,561 | −1.4% | |
| 2020 | 15,516 | −6.3% | |
| 2023 (est.) | 15,365 | [6] | −1.0% |
| U.S. Decennial Census[7] 1790-1960[8] 1900-1990[9] 1990-2000[10] 2010[11] | |||

As of the
Of the 6,811 households, 30.1% had children under the age of 18 living with them, 53.0% were married couples living together, 10.0% had a female householder with no husband present, 32.2% were non-families, and 27.5% of all households were made up of individuals. The average household size was 2.39 and the average family size was 2.88. The median age was 41.7 years.[12]
The median income for a household in the county was $45,347 and the median income for a family was $56,806. Males had a median income of $41,649 versus $27,729 for females. The per capita income for the county was $24,320. About 6.4% of families and 8.6% of the population were below the
Communities

Cities
- Clinton (seat)
- Farmer City
Villages
Townships
DeWitt County is divided into thirteen townships:
Unincorporated communities
Politics
DeWitt is frequently a Republican county. It has not been carried by a Democratic presidential candidate since
| Year | Republican | Democratic | Third party | |||
|---|---|---|---|---|---|---|
| No. | % | No. | % | No. | % | |
| 2020 | 5,632 | 70.06% | 2,191 | 27.25% | 216 | 2.69% |
| 2016 | 5,077 | 67.19% | 1,910 | 25.28% | 569 | 7.53% |
| 2012 | 4,579 | 62.15% | 2,601 | 35.30% | 188 | 2.55% |
| 2008 | 4,348 | 55.52% | 3,308 | 42.24% | 175 | 2.23% |
| 2004 | 4,920 | 63.09% | 2,836 | 36.37% | 42 | 0.54% |
| 2000 | 3,968 | 56.28% | 2,870 | 40.70% | 213 | 3.02% |
| 1996 | 2,978 | 45.20% | 2,878 | 43.68% | 733 | 11.12% |
| 1992 | 3,164 | 40.78% | 3,009 | 38.78% | 1,586 | 20.44% |
| 1988 | 3,942 | 59.32% | 2,660 | 40.03% | 43 | 0.65% |
| 1984 | 4,534 | 65.57% | 2,352 | 34.01% | 29 | 0.42% |
| 1980 | 4,648 | 63.29% | 2,262 | 30.80% | 434 | 5.91% |
| 1976 | 4,137 | 53.97% | 3,477 | 45.36% | 52 | 0.68% |
| 1972 | 5,025 | 65.22% | 2,672 | 34.68% | 8 | 0.10% |
| 1968 | 4,247 | 54.21% | 2,823 | 36.04% | 764 | 9.75% |
| 1964 | 3,605 | 45.20% | 4,371 | 54.80% | 0 | 0.00% |
| 1960 | 5,074 | 58.40% | 3,607 | 41.51% | 8 | 0.09% |
| 1956 | 5,307 | 63.15% | 3,093 | 36.80% | 4 | 0.05% |
| 1952 | 5,212 | 61.78% | 3,221 | 38.18% | 3 | 0.04% |
| 1948 | 4,178 | 55.61% | 3,290 | 43.79% | 45 | 0.60% |
| 1944 | 4,630 | 55.40% | 3,658 | 43.77% | 69 | 0.83% |
| 1940 | 5,477 | 51.80% | 5,052 | 47.78% | 45 | 0.43% |
| 1936 | 4,544 | 44.20% | 5,676 | 55.21% | 60 | 0.58% |
| 1932 | 4,207 | 43.49% | 5,339 | 55.19% | 127 | 1.31% |
| 1928 | 6,100 | 69.40% | 2,631 | 29.93% | 59 | 0.67% |
| 1924 | 5,173 | 58.77% | 2,752 | 31.27% | 877 | 9.96% |
| 1920 | 5,001 | 60.68% | 3,079 | 37.36% | 162 | 1.97% |
| 1916 | 4,380 | 47.89% | 4,460 | 48.76% | 306 | 3.35% |
| 1912 | 1,346 | 28.49% | 1,880 | 39.79% | 1,499 | 31.72% |
| 1908 | 2,628 | 53.17% | 2,155 | 43.60% | 160 | 3.24% |
| 1904 | 2,771 | 55.96% | 1,872 | 37.80% | 309 | 6.24% |
| 1900 | 2,694 | 52.27% | 2,361 | 45.81% | 99 | 1.92% |
| 1896 | 2,587 | 51.45% | 2,370 | 47.14% | 71 | 1.41% |
| 1892 | 2,059 | 47.36% | 2,083 | 47.91% | 206 | 4.74% |
See also
Notes
- ^ "De Witt County, Illinois". United States Census Bureau. Retrieved June 8, 2023.
- ^ "Find a County". National Association of Counties. Archived from the original on May 31, 2011. Retrieved June 7, 2011.
- ^ Gannett, Henry (1905). The Origin of Certain Place Names in the United States. Govt. Print. Off. p. 105.
- ^ a b "Population, Housing Units, Area, and Density: 2010 - County". United States Census Bureau. Archived from the original on February 12, 2020. Retrieved July 11, 2015.
- ^ a b "Monthly Averages for Clinton, Illinois". The Weather Channel. Retrieved January 27, 2011.
- ^ "Annual Estimates of the Resident Population for Counties: April 1, 2020 to July 1, 2023". United States Census Bureau. Retrieved April 2, 2024.
- ^ "U.S. Decennial Census". United States Census Bureau. Retrieved July 4, 2014.
- ^ "Historical Census Browser". University of Virginia Library. Archived from the original on August 11, 2012. Retrieved July 4, 2014.
- ^ "Population of Counties by Decennial Census: 1900 to 1990". United States Census Bureau. Retrieved July 4, 2014.
- ^ "Census 2000 PHC-T-4. Ranking Tables for Counties: 1990 and 2000" (PDF). United States Census Bureau. Retrieved July 4, 2014.
- ^ "State & County QuickFacts". United States Census Bureau. Archived from the original on July 9, 2011. Retrieved July 4, 2014.
- ^ a b c "DP-1 Profile of General Population and Housing Characteristics: 2010 Demographic Profile Data". United States Census Bureau. Archived from the original on February 13, 2020. Retrieved July 11, 2015.
- ^ "DP02 SELECTED SOCIAL CHARACTERISTICS IN THE UNITED STATES – 2006-2010 American Community Survey 5-Year Estimates". United States Census Bureau. Archived from the original on February 13, 2020. Retrieved July 11, 2015.
- ^ "DP03 SELECTED ECONOMIC CHARACTERISTICS – 2006-2010 American Community Survey 5-Year Estimates". United States Census Bureau. Archived from the original on February 13, 2020. Retrieved July 11, 2015.
- ^ Leip, David. "Dave Leip's Atlas of U.S. Presidential Elections". uselectionatlas.org. Retrieved November 1, 2018.
References
- United States Census Bureau 2007 TIGER/Line Shapefiles
- United States Board on Geographic Names (GNIS)
- United States National Atlas
External links
Places adjacent to DeWitt County, Illinois | ||||||||||||||||
|---|---|---|---|---|---|---|---|---|---|---|---|---|---|---|---|---|
| ||||||||||||||||
 | ||||
Villages | ||||
| Townships | ||||
| CDP | ||||
| Other communities | ||||
| Footnotes | ‡This populated place also has portions in an adjacent county or counties | |||
| ||||
| International | |
|---|---|
| National | |
| Other | |