
Demographic history of New York City


The

in Arabic, Armenian, Chinese, Croatian, Czech, Dutch, Esperanto, Finnish, Flemish, French, Gaelic, German, Greek, Yiddish (labeled as "Christian Hebrew"), Hungarian, Italian, Japanese, Lithuanian, Norwegian, Polish, Portuguese, Romanian, Russian, Slovene, Spanish, Swedish, Turkish and Ukrainian.
"Gotham's citizens have been called "The Sons of Elsewhere", and their language that spoken at the Tower of Babel..."
New York City has had a largely
Overview
The population of
New York's five boroughs have had different settlement histories. The Bronx and Brooklyn were the most popular destinations for Blacks to settle, while Queens was the most popular destination for Asian migrants to NYC and the Bronx was the most popular destination for Hispanic migrants to move to.[1] New York City's total population more than doubled between 1900 and 2010 (with a period of population stagnation between 1950 and 1990).[1] The Bronx, Queens, and Staten Island experienced enormous population growth between 1900 and 2010, much higher than New York's average population growth.[1] Brooklyn's population grew at a much slower rate during this time period, while Manhattan actually had fewer people in 2010 than in 1900.[1]
Citywide
During the early 20th century, from 1900 to 1940, New York City's population was predominantly White, accounting for over 93% of the population, with the Black community constituting less than 3%. By the 1950s, the White population decreased to around 90%, while the Black population increased to nearly 10%. From 1970 to 1980, more pronounced shifts occurred, with the White population dropping to 60.72%, the Black population increasing to 25.23%, and a notable rise in the Hispanic/Latino population to 19.88%. The 1990s brought further diversification, with the White population falling to 44.66% by 2000, and growth in the Black, Asian, and Hispanic/Latino populations. The most recent decade from 2010 to 2020 saw a continued decrease in the White population to 34.09%, significant growth in the Asian population to 15.73%, stability in the Black population around 22-25%, and growth in the Hispanic/Latino community to 28.29%. The Other or Mixed category also grew to 28.11%. Throughout this period, New York City remained a hub for immigrants, with the foreign-born population peaking at 37.51% in 2010. Overall, these trends reflect the transformation of New York City into an increasingly multicultural metropolis, with a progressive decline in the White population and expanding representation of Black, Asian, Hispanic/Latino, and Other or Mixed groups.[1][8][9][10][11][12][13][14][15][16][17]
| Year | Population | White Hispanics ) |
% W |
Non-Hispanic Whites |
% ANG |
Black |
% B |
Asian |
% A |
Other or Mixed |
% O/M |
Hispanic/ Latino |
% H/L |
Foreign born |
% FB |
|---|---|---|---|---|---|---|---|---|---|---|---|---|---|---|---|
| 1900 | 3,437,202 | 3,369,898 | 98.04 | N/A | N/A | 60,666 | 1.76 | 6,607 | 0.19 | 31 | 0 | N/A | N/A | 1,270,080 | 36.95 |
| 1910 | 4,766,883 | 4,669,162 | 97.95 | N/A | N/A | 91,709 | 1.92 | 5,669 | 0.12 | 343 | 0.01 | N/A | N/A | 1,944,357 | 40.79 |
| 1920 | 5,620,048 | 5,459,463 | 97.14 | N/A | N/A | 152,467 | 2.71 | 7,969 | 0.14 | 149 | 0 | N/A | N/A | 2,028,160 | 36.09 |
| 1930 | 6,930,446 | 6,589,377 | 95.08 | N/A | N/A | 327,706 | 4.73 | 12,972 | 0.19 | 391 | 0.01 | N/A | N/A | 2,358,686 | 34.03 |
| 1940 | 7,454,995 | 6,977,501 | 93.59 | 6,856,586 | 91.97 | 458,444 | 6.15 | 17,986 | 0.24 | 1,064 | 0.01 | 120,915 | 1.62 | 2,138,657 | 28.69 |
| 1950 | 7,891,957 | 7,116,441 | 90.17 | N/A | N/A | 747,608 | 9.47 | 21,441 | 0.27 | 6,467 | 0.08 | N/A | N/A | 1,784,206 | 22.61 |
| 1960 | 7,781,984 | 6,640,662 | 85.33 | N/A | N/A | 1,087,931 | 13.98 | 43,103 | 0.55 | 10,288 | 0.13 | N/A | N/A | 1,558,690 | 20.03 |
| 1970 | 7,894,862 | 6,048,841 | 76.62 | 4,969,749 | 62.95 | 1,668,115 | 21.13 | 94,499 | 1.20 | 83,407 | 1.06 | 1,278,630 | 16.20 | 1,437,058 | 18.20 |
| 1980 | 7,071,639 | 4,294,075 | 60.72 | 3,668,945 | 51.88 | 1,784,337 | 25.23 | 231,501 | 3.27 | 761,762 | 10.77 | 1,406,024 | 19.88 | 1,670,199 | 23.62 |
| 1990 | 7,322,564 | 3,827,088 | 52.26 | 3,163,125 | 43.20 | 2,102,512 | 28.71 | 512,719 | 7.00 | 880,245 | 12.02 | 1,783,511 | 24.36 | 2,082,931 | 28.45 |
| 2000 | 8,008,278 | 3,576,385 | 44.66 | 2,801,267 | 34.98 | 2,129,762 | 26.59 | 792,477 | 9.90 | 1,509,654 | 18.85 | 2,160,554 | 26.98 | 2,871,032 | 35.85 |
| 2010 | 8,175,133 | 3,597,341 | 44.00 | 2,722,904 | 33.31 | 2,088,510 | 25.55 | 1,043,535 | 12.77 | 1,445,747 | 17.68 | 2,336,076 | 28.58 | 3,066,599 | 37.51 |
| 2020 | 8,804,190 | 3,000,945 | 34.09 | 2,719,856 | 30.89 | 1,943,645 | 22.08 | 1,385,144 | 15.73 | 2,474,456 | 28.11 | 2,490,350 | 28.29 | N/A[A] | N/A |
A Foreign-born population data from 2020 Census not yet available (as of Sept 2021).
By borough
The Bronx
-
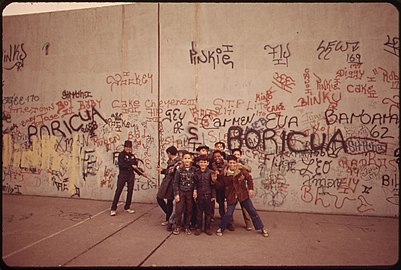 Children playing on sidewalk in 1973
 -
 Traveling public library in 1938
 -
 The Hub in 2007

.jpg)

| Year | Population | White Hispanics ) |
% W |
Non-Hispanic Whites |
% ANG |
Black |
% B |
Asian |
% A |
Other or Mixed |
% O/M |
Hispanic/ Latino |
% H/L |
Foreign born |
% FB |
|---|---|---|---|---|---|---|---|---|---|---|---|---|---|---|---|
| 1900 | 200,507 | 197,923 | 98.71 | N/A | N/A | 2,370 | 1.18 | 208 | 0.10 | 6 | 0 | N/A | N/A | 61,258 | 30.55 |
| 1910 | 430,980 | 426,650 | 99.00 | N/A | N/A | 4,117 | 0.96 | 189 | 0.04 | 24 | 0.01 | N/A | N/A | 149,427 | 34.67 |
| 1920 | 732,016 | 726,990 | 99.31 | N/A | N/A | 4,803 | 0.66 | 215 | 0.03 | 8 | 0 | N/A | N/A | 267,742 | 36.58 |
| 1930 | 1,265,258 | 1,251,823 | 98.94 | N/A | N/A | 12,930 | 1.02 | 476 | 0.04 | 29 | 0 | N/A | N/A | 479,451 | 37.89 |
| 1940 | 1,394,711 | 1,370,319 | 98.25 | N/A | N/A | 23,529 | 1.69 | 801 | 0.06 | 62 | 0 | N/A | N/A | 463,453 | 33.23 |
| 1950 | 1,451,277 | 1,351,662 | 93.14 | N/A | N/A | 97,752 | 6.74 | 1,249 | 0.09 | 614 | 0.04 | N/A | N/A | 373,894 | 25.76 |
| 1960 | 1,424,815 | 1,256,284 | 88.17 | N/A | N/A | 163,896 | 11.50 | 3,544 | 0.25 | 1,091 | 0.08 | N/A | N/A | 306,592 | 21.52 |
| 1970 | 1,471,701 | 1,080,859 | 73.44 | N/A | N/A | 357,681 | 24.30 | 7,792 | 0.53 | 25,369 | 1.72 | N/A | N/A | 229,210 | 15.57 |
| 1980 | 1,168,972 | 554,046 | 47.40 | 396,836 | 33.95 | 371,926 | 31.82 | 15,163 | 1.30 | 227,837 | 19.49 | 396,353 | 33.91 | 215,313 | 18.42 |
| 1990 | 1,203,789 | 430,077 | 35.73 | 272,503 | 22.64 | 449,399 | 37.33 | 35,562 | 2.95 | 288,751 | 23.99 | 523,111 | 43.46 | 274,793 | 22.83 |
| 2000 | 1,332,650 | 398,003 | 29.87 | 193,651 | 14.53 | 475,007 | 35.64 | 41,503 | 3.11 | 418,137 | 31.38 | 644,705 | 48.38 | 385,827 | 28.95 |
| 2010 | 1,385,108 | 386,497 | 27.90 | 151,209 | 10.92 | 505,200 | 36.47 | 50,897 | 3.68 | 442,514 | 31.95 | 741,413 | 53.53 | 518,353 | 37.42 |
| 2021 | 1,435,070 | 657,262 | 45.80 | 131,140 | 9.14 | 617,080 | 43.00 | 57,402 | 4.00 | 43,052 | 3.00 | 774,937 | 54.00 | 489,358 | 31.00 |
Brooklyn
In the early 1900s, Brooklyn was predominantly White, with the White population comprising 98.31% in 1900 and staying above 98% through 1920. The Black population was very small at this time, constituting only 1.57% in 1900, while the Asian population was even smaller at 0.11%.
The 1930s started to see a slight decline in the White population, dropping to 97.20%, and the Black population began to grow, reaching 2.69% by 1930. The Asian population remained negligible.
From the 1940s to the 1960s, the decline in the White population became more pronounced, dropping to 92.22% in 1950 and then to 85.48% in 1960. During this period, the Black population increased to 14.14%, and the Asian population began to grow, albeit slowly.
The 1970s and 1980s marked a significant shift in Brooklyn's demographics. The White population fell to 73.24% in 1970 and then sharply to 56.01% in 1980. The Black population increased to 25.22% in 1970 and 32.40% in 1980. The Asian community and Other or Mixed category became more substantial, reaching 1.93% and 9.67%, respectively, in 1980. The Hispanic/Latino community grew to 17.58%, and the foreign-born population remained relatively high, at 23.80% in 1980.
In the last three decades, from 1990 to 2010, Brooklyn's racial and ethnic diversity expanded further. The White population declined to below half of the total, reaching 42.80% in 2010, while the Black population remained around 34-37%. The Asian population increased significantly to 10.52% by 2010, and the Other or Mixed category reached 12.34%. The Hispanic/Latino population hovered around 19-20%, and the foreign-born population grew to 36.44% in 2010.
.jpg)

.jpg)
| Year | Population | White Hispanics ) |
% W |
Non-Hispanic Whites |
% ANG |
Black |
% B |
Asian |
% A |
Other or Mixed |
% O/M |
Hispanic/ Latino |
% H/L |
Foreign born |
% FB |
|---|---|---|---|---|---|---|---|---|---|---|---|---|---|---|---|
| 1900 | 1,166,582 | 1,146,909 | 98.31 | N/A | N/A | 18,367 | 1.57 | 1,300 | 0.11 | 6 | 0 | N/A | N/A | 355,697 | 30.49 |
| 1910 | 1,634,351 | 1,610,487 | 98.54 | N/A | N/A | 22,708 | 1.39 | 1,010 | 0.06 | 146 | 0.01 | N/A | N/A | 574,730 | 35.17 |
| 1920 | 2,018,356 | 1,984,953 | 98.35 | N/A | N/A | 31,912 | 1.58 | 1,459 | 0.07 | 32 | 0 | N/A | N/A | 666,188 | 33.01 |
| 1930 | 2,560,401 | 2,488,815 | 97.20 | N/A | N/A | 68,921 | 2.69 | 2,539 | 0.10 | 126 | 0 | N/A | N/A | 881,571 | 34.43 |
| 1940 | 2,698,285 | 2,587,951 | 95.91 | N/A | N/A | 107,263 | 3.98 | 2,608 | 0.10 | 463 | 0.02 | N/A | N/A | 778,054 | 28.84 |
| 1950 | 2,738,175 | 2,525,118 | 92.22 | N/A | N/A | 208,478 | 7.61 | 2,514 | 0.09 | 2,065 | 0.08 | N/A | N/A | 630,526 | 23.03 |
| 1960 | 2,627,319 | 2,245,859 | 85.48 | N/A | N/A | 371,405 | 14.14 | 6,540 | 0.25 | 3,515 | 0.13 | N/A | N/A | 516,349 | 19.65 |
| 1970 | 2,602,012 | 1,905,788 | 73.24 | N/A | N/A | 656,194 | 25.22 | 16,138 | 0.62 | 23,892 | 0.92 | N/A | N/A | 456,636 | 17.55 |
| 1980 | 2,230,936 | 1,249,486 | 56.01 | 1,085,233 | 48.64 | 722,812 | 32.40 | 42,965 | 1.93 | 215,673 | 9.67 | 392,118 | 17.58 | 530,973 | 23.80 |
| 1990 | 2,300,664 | 1,078,549 | 46.88 | 923,229 | 40.13 | 872,305 | 37.92 | 111,251 | 4.84 | 238,559 | 10.37 | 462,411 | 20.10 | 672,569 | 29.23 |
| 2000 | 2,465,326 | 1,015,728 | 41.20 | 854,532 | 34.66 | 898,350 | 36.44 | 187,283 | 7.60 | 363,965 | 14.76 | 487,878 | 19.79 | 931,769 | 37.79 |
| 2010 | 2,504,700 | 1,072,041 | 42.80 | 893,306 | 35.67 | 860,083 | 34.34 | 263,519 | 10.52 | 309,057 | 12.34 | 496,285 | 19.81 | 912,793 | 36.44 |
Manhattan
The demographic landscape of Manhattan has shifted considerably over the past century. In 1900, the borough was overwhelmingly White, with a White population that constituted 97.78% of the total, while Black residents made up only 1.96%. Over the subsequent decades, the proportion of White residents gradually decreased, falling to 94.96% in 1920 and then more sharply to 87.47% in 1930. The Black population simultaneously grew to 12.03% in 1930.
From the 1940s through the 1960s, the decline in the White population continued, with percentages dropping to 79.41% in 1950 and 74.89% in 1960. During this period, the Black population increased to nearly one-quarter of the total, reaching 23.38% in 1960. Additionally, the Asian population began to grow, reaching 1.50% in 1960.
The 1970s and 1980s marked a significant transformation in Manhattan's racial composition. The White population fell below 60%, reaching 58.90% in 1980, while the Black population stabilized around 20-25%. The Asian community continued to grow, reaching 5.10% in 1980, and the Other or Mixed category emerged as a more substantial portion of the population, making up 14.31% in 1980. The Hispanic/Latino community also became more prominent, growing to 23.54% in 1980.
In recent decades, from 1990 to 2010, the racial diversity in Manhattan has continued to expand. The White population remained around 57-58%, while the Black population fluctuated around 15-17%. The Asian population grew to 11.38% by 2010, and the Other or Mixed category increased to 15.62%. The Hispanic/Latino population remained significant, at 25.45% in 2010, and the foreign-born population has been consistently high, reaching 29.66% in 2010.
-
 Little Italy in Manhattan c.1900
 -
 St. Patrick's Day Parade
 -
-


| Year | Population | White Hispanics ) |
% W |
Non-Hispanic Whites |
% ANG |
Black |
% B |
Asian |
% A |
Other or Mixed |
% O/M |
Hispanic/ Latino |
% H/L |
Foreign born |
% FB |
|---|---|---|---|---|---|---|---|---|---|---|---|---|---|---|---|
| 1900 | 1,850,093 | 1,808,968 | 97.78 | N/A | N/A | 36,246 | 1.96 | 4,861 | 0.26 | 18 | 0 | N/A | N/A | 789,626 | 42.68 |
| 1910 | 2,331,542 | 2,266,578 | 97.21 | N/A | N/A | 60,534 | 2.60 | 4,260 | 0.18 | 170 | 0.01 | N/A | N/A | 1,116,477 | 47.89 |
| 1920 | 2,284,103 | 2,168,906 | 94.96 | N/A | N/A | 109,133 | 4.78 | 6,003 | 0.26 | 61 | 0 | N/A | N/A | 950,264 | 41.60 |
| 1930 | 1,867,312 | 1,633,329 | 87.47 | N/A | N/A | 224,670 | 12.03 | 9,124 | 0.49 | 189 | 0.01 | N/A | N/A | 689,506 | 36.93 |
| 1940 | 1,889,924 | 1,577,625 | 83.48 | N/A | N/A | 298,365 | 15.79 | 13,467 | 0.71 | 467 | 0.02 | N/A | N/A | 582,895 | 30.84 |
| 1950 | 1,960,101 | 1,556,599 | 79.41 | N/A | N/A | 384,482 | 19.62 | 16,083 | 0.82 | 2,937 | 0.15 | N/A | N/A | 461,102 | 23.52 |
| 1960 | 1,698,281 | 1,271,822 | 74.89 | N/A | N/A | 397,101 | 23.38 | 25,487 | 1.50 | 3,871 | 0.23 | N/A | N/A | 374,698 | 22.06 |
| 1970 | 1,539,233 | 1,089,302 | 70.77 | N/A | N/A | 380,442 | 24.72 | 47,332 | 3.08 | 22,157 | 1.44 | N/A | N/A | 307,630 | 19.99 |
| 1980 | 1,428,285 | 841,204 | 58.90 | 713,854 | 49.98 | 309,854 | 21.69 | 72,884 | 5.10 | 204,343 | 14.31 | 336,247 | 23.54 | 348,581 | 24.41 |
| 1990 | 1,487,536 | 867,227 | 58.30 | 726,755 | 48.86 | 326,967 | 21.98 | 110,629 | 7.44 | 182,713 | 12.28 | 386,630 | 25.99 | 383,866 | 25.81 |
| 2000 | 1,537,195 | 835,610 | 54.36 | 703,873 | 45.79 | 267,302 | 17.39 | 145,607 | 9.47 | 288,676 | 18.78 | 417,816 | 27.18 | 452,440 | 29.43 |
| 2010 | 1,585,873 | 911,073 | 57.45 | 761,493 | 48.02 | 246,687 | 15.55 | 180,425 | 11.38 | 247,688 | 15.62 | 403,577 | 25.45 | 470,305 | 29.66 |
Queens
-
-

-
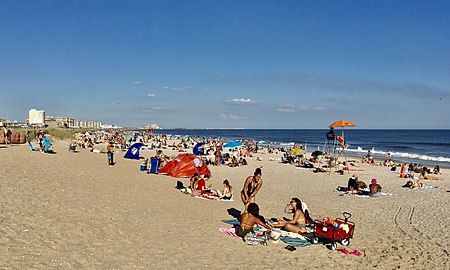 Sunbathers atRockaway Beach


| Year | Population | White Hispanics ) |
% W |
Non-Hispanic Whites |
% ANG |
Black |
% B |
Asian |
% A |
Other or Mixed |
% O/M |
Hispanic/ Latino |
% H/L |
Foreign born |
% FB |
|---|---|---|---|---|---|---|---|---|---|---|---|---|---|---|---|
| 1900 | 152,999 | 150,235 | 98.19 | N/A | N/A | 2,611 | 1.71 | 152 | 0.10 | 1 | 0 | N/A | N/A | 44,812 | 29.29 |
| 1910 | 284,041 | 280,691 | 98.82 | N/A | N/A | 3,198 | 1.13 | 149 | 0.05 | 3 | 0 | N/A | N/A | 79,329 | 27.93 |
| 1920 | 469,042 | 463,661 | 98.85 | N/A | N/A | 5,120 | 1.09 | 214 | 0.05 | 47 | 0.01 | N/A | N/A | 112,171 | 23.91 |
| 1930 | 1,079,129 | 1,059,804 | 98.21 | N/A | N/A | 18,609 | 1.72 | 679 | 0.06 | 37 | 0 | N/A | N/A | 268,358 | 24.87 |
| 1940 | 1,297,634 | 1,270,731 | 97.93 | N/A | N/A | 25,890 | 2.00 | 947 | 0.07 | 66 | 0.01 | N/A | N/A | 278,937 | 21.50 |
| 1950 | 1,550,849 | 1,497,126 | 96.54 | N/A | N/A | 51,524 | 3.32 | 1,444 | 0.09 | 755 | 0.05 | N/A | N/A | 288,197 | 18.58 |
| 1960 | 1,809,578 | 1,654,959 | 91.46 | N/A | N/A | 145,855 | 8.06 | 7,084 | 0.39 | 1,680 | 0.09 | N/A | N/A | 335,623 | 18.55 |
| 1970 | 1,986,473 | 1,695,288 | 85.34 | N/A | N/A | 258,006 | 12.99 | 21,940 | 1.10 | 11,239 | 0.57 | N/A | N/A | 416,887 | 20.99 |
| 1980 | 1,891,325 | 1,335,805 | 70.63 | 1,172,511 | 61.99 | 354,129 | 18.72 | 93,780 | 4.96 | 107,611 | 5.69 | 262,422 | 13.88 | 540,818 | 28.59 |
| 1990 | 1,951,598 | 1,129,192 | 57.86 | 937,557 | 48.04 | 423,211 | 21.69 | 238,336 | 12.21 | 160,859 | 8.24 | 381,120 | 19.53 | 707,153 | 36.23 |
| 2000 | 2,229,379 | 982,725 | 44.08 | 732,895 | 32.87 | 446,189 | 20.01 | 392,831 | 17.62 | 407,634 | 18.28 | 556,605 | 24.97 | 1,028,339 | 46.13 |
| 2010 | 2,230,722 | 1,060,000 | 45.72 | 616,727 | 27.65 | 426,683 | 19.13 | 513,317 | 23.01 | 404,669 | 18.14 | 613,750 | 27.51 | 1,059,593 | 47.50 |
Staten Island
-
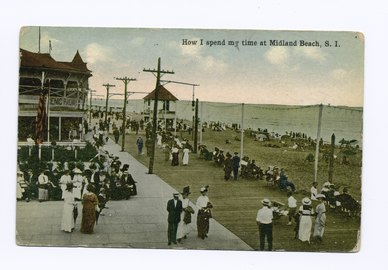 Midland Beach
 -
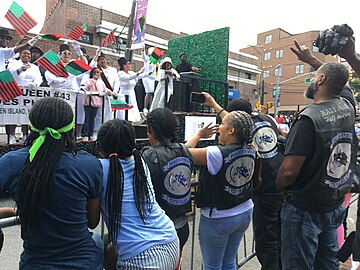 Staten Island Black Heritage Festival
 -
 Commuters on the Staten Island Ferry


.JPG)
| Year | Population | White Hispanics ) |
% W |
Non-Hispanic Whites |
% ANG |
Black |
% B |
Asian |
% A |
Other or Mixed |
% O/M |
Hispanic/ Latino |
% H/L |
Foreign born |
% FB |
|---|---|---|---|---|---|---|---|---|---|---|---|---|---|---|---|
| 1900 | 67,021 | 65,863 | 98.27 | N/A | N/A | 1,072 | 1.60 | 86 | 0.13 | 0 | 0 | N/A | N/A | 18,687 | 27.88 |
| 1910 | 85,969 | 84,756 | 98.59 | N/A | N/A | 1,152 | 1.34 | 61 | 0.07 | 0 | 0 | N/A | N/A | 24,394 | 28.38 |
| 1920 | 116,531 | 114,953 | 98.65 | N/A | N/A | 1,499 | 1.29 | 78 | 0.07 | 1 | 0 | N/A | N/A | 31,795 | 27.28 |
| 1930 | 158,346 | 155,606 | 98.27 | N/A | N/A | 2,576 | 1.63 | 154 | 0.10 | 10 | 0.01 | N/A | N/A | 39,799 | 25.13 |
| 1940 | 174,441 | 170,875 | 97.96 | N/A | N/A | 3,397 | 1.95 | 163 | 0.09 | 6 | 0 | N/A | N/A | 35,318 | 20.25 |
| 1950 | 191,555 | 185,936 | 97.07 | N/A | N/A | 5,372 | 2.80 | 153 | 0.08 | 94 | 0.05 | N/A | N/A | 30,487 | 15.92 |
| 1960 | 221,991 | 211,738 | 95.38 | N/A | N/A | 9,674 | 4.36 | 448 | 0.20 | 131 | 0.06 | N/A | N/A | 25,428 | 11.45 |
| 1970 | 295,443 | 277,604 | 93.96 | N/A | N/A | 15,792 | 5.35 | 1,297 | 0.44 | 750 | 0.25 | N/A | N/A | 26,695 | 9.04 |
| 1980 | 352,121 | 313,534 | 89.04 | 300,511 | 85.34 | 25,616 | 7.27 | 6,709 | 1.91 | 6,262 | 1.78 | 18,884 | 5.36 | 34,514 | 9.80 |
| 1990 | 378,977 | 322,043 | 84.98 | 303,081 | 79.97 | 30,630 | 8.08 | 16,941 | 4.47 | 9,363 | 2.47 | 30,239 | 7.98 | 44,550 | 11.76 |
| 2000 | 443,728 | 344,319 | 77.60 | 316,316 | 71.29 | 42,914 | 9.67 | 25,253 | 5.69 | 31,242 | 7.04 | 53,550 | 12.07 | 72,657 | 16.37 |
| 2010 | 468,730 | 341,677 | 72.89 | 300,169 | 64.04 | 49,857 | 10.64 | 35,377 | 7.55 | 41,819 | 8.92 | 81,051 | 17.29 | 110,142 | 23.50 |
See also
References
- ^ a b c d e f g h i j "New York – Race and Hispanic Origin for Selected Large Cities and Other Places: Earliest Census to 1990" (PDF). Retrieved September 7, 2021.
- ^ a b c d Gibson, Campbell; Jung, Kay (February 2006). "Table 23. Nativity of the Population for the 50 Largest Urban Places: 1870 to 2000" (Historical Census Statistics on the Foreign-Born Population of the United States: 1850-2000). Washington, DC 20233-8800: U.S. Census Bureau Population Division. Retrieved February 10, 2013.
{{cite journal}}: Cite journal requires|journal=(help)CS1 maint: location (link) - ^ Gibson, Campbell; Jung, Kay (February 2006). "Table 14. Nativity of the Population, for Regions, Divisions, and States: 1850 to 2000" (Historical Census Statistics on the Foreign-Born Population of the United States: 1850-2000). Washington, DC 20233-8800: U.S. Census Bureau Population Division. Retrieved February 10, 2013.
{{cite journal}}: Cite journal requires|journal=(help)CS1 maint: location (link) - ^ "Legal Immigration to the United States: Fiscal Years 1820 to 2011 (in millions)". Migration Policy Institute. 2012. Archived from the original on February 2, 2013. Retrieved February 10, 2013.
- ^ a b c d Bloch, Matthew; Gebeloff, Robert (March 10, 2009), "Immigration Explorer", The New York Times, retrieved January 21, 2013
- ^ "Working for a Better Life: A Profile of Immigrants in the New York State Economy" (PDF). Fiscal Policy Institute. 2007. Archived from the original (PDF) on November 22, 2010. Retrieved February 1, 2017.
- ^ Bloomberg, Michael R.; Burden, Amanda M.; Shama, Fatima (2013). The Newest New Yorkers (PDF) (2013 ed.). New York City Department of City Planning.
- ^ American FactFinder, United States Census Bureau. "New York City Profile of General Demographic Characteristics: 2000". Factfinder.census.gov. Archived from the original on February 12, 2020. Retrieved January 4, 2012.
- ^ "New York City Race, Hispanic or Latino, Age, and Housing Occupancy: 2010". United States Census Bureau. October 5, 2010. Retrieved January 4, 2012.
- ^ "Total and Foreign-born Population: New York Metropolitan Region by Subregion and County, 1900–2000" (PDF). Archived from the original (PDF) on June 28, 2011. Retrieved January 4, 2012.
- ^ "Bronx County Population by Race". Censusscope.org. Retrieved January 4, 2012.
- ^ "Kings County Population by Race". Censusscope.org. Retrieved January 4, 2012.
- ^ "New York County Population by Race". Censusscope.org. Retrieved January 4, 2012.
- ^ "Queens County Population by Race". Censusscope.org. Retrieved January 4, 2012.
- ^ "Richmond County Population by Race". Censusscope.org. Retrieved January 4, 2012.
- ^ "Race/Ethnicity Counts: Counties" (PDF). Retrieved January 4, 2012.
- ^ "2020 Census Results for New York City: Key Population & Housing Characteristics" (PDF). New York City Department of City Planning. Retrieved September 25, 2021.
| By topic | |
|---|---|
| Boroughs |
|
| Government | |
| Emergency services | |
| Transportation | |
| Culture | |
| Education | |
| History | |