
Demographics of Sweden
Parts of this article (those related to For example, the current administrative area for the Finnish languages consists of 66 municipalities, not just Eskilstuna and 5 municipalities in Norrbotten county) need to be updated. (June 2019) |
| Demographics of Sweden | |
|---|---|
 Population pyramid of Sweden in 2020 | |
| Population | |
| Growth rate | 0.5% (2022 est.) |
| Birth rate | 10.83 births/1,000 population (2022) |
| Death rate | 9.46 deaths/1,000 population (2022) |
| Life expectancy | 82.7 years |
| • male | 80.94 years (2022) |
| • female | 84.58 years (2022 est.) |
| Fertility rate | 1.67 children born/woman (2022 est.) |
| Infant mortality rate | 2.3 deaths/1,000 live births |
| Net migration rate | 3.6 migrant(s)/1,000 population (2022 est.) |
| Age structure | |
| 0–14 years | 17.71% |
| 15–64 years | 62.18% |
| 65 and over | 20.12% |
| Sex ratio | |
| Total | 1.01 male(s)/female (2022 est.) |
| At birth | 1.06 male(s)/female |
| 65 and over | 0.69 male(s)/female |
| Nationality | |
| Nationality | noun: Swede(s) adjective: Swedish |
| Major ethnic | Swedes |
| Language | |
| Official | Swedish |
| Spoken | Swedish, others |
.jpg)

The demography of Sweden is monitored by the Statistiska centralbyrån (
The population exceeded 10 million for the first time on Friday, 20 January 2017.[2][3] The three largest cities are Stockholm, Gothenburg and Malmö. Sweden's population has become much more ethnically, religiously and linguistically diverse over the past 70 years as a result of immigration. Every fourth (24.9%) resident in the country has a foreign background and every third (32.3%) has at least one parent born abroad. The most common foreign ancestry is Finnish.[4]
Statistics Sweden projects a Swedish population of 12.6 million in 2070.[5]
Population

Demographic statistics according to the World Population Review.[6]
- One birth every 4 minutes
- One death every 6 minutes
- Net gain of one person every 8 minutes
- One net migrant every 14 minutes
Cities
Sweden has 17 cities with a population of over 100,000 people. Most of Sweden's population lives in Svealand and Götaland.
Fertility

The
| Years | 1630 | 1632 | 1634 | 1636 | 1638 | 1640 | 1642 | 1644 | 1646 | 1648 | 1650 | 1652 | 1654 | 1656 | 1658[7] |
|---|---|---|---|---|---|---|---|---|---|---|---|---|---|---|---|
| Total fertility rate in Sweden | 4.81 | 4.25 | 3.89 | 4.38 | 4.4 | 4.92 | 4.38 | 4.25 | 4.95 | 5.4 | 4.34 | 4.54 | 5.33 | 4.72 | 4.58 |
| Years | 1660 | 1662 | 1664 | 1666 | 1668 | 1670 | 1672 | 1674 | 1676 | 1678 | 1680 | 1682 | 1684 | 1686 | 1688[7] |
|---|---|---|---|---|---|---|---|---|---|---|---|---|---|---|---|
| Total fertility rate in Sweden | 4.2 | 4.54 | 5.01 | 4.98 | 4.6 | 5.13 | 5.01 | 4.38 | 4.28 | 4.35 | 4.64 | 5.4 | 5.25 | 4.84 | 5.29 |
| Years | 1690 | 1692 | 1694 | 1696 | 1698 | 1700 | 1702 | 1704 | 1706 | 1708 | 1710 | 1712 | 1714 | 1716 | 1718[7] |
|---|---|---|---|---|---|---|---|---|---|---|---|---|---|---|---|
| Total fertility rate in Sweden | 4.99 | 5.11 | 4.98 | 5.33 | 5.11 | 5.56 | 5.81 | 5.52 | 5.16 | 5.32 | 4.3 | 5.63 | 5.81 | 4.92 | 5.13 |
| Years | 1720 | 1722 | 1724 | 1726 | 1728 | 1730 | 1732 | 1734 | 1736 | 1738 | 1740 | 1742 | 1744 | 1746 | 1748[7] |
|---|---|---|---|---|---|---|---|---|---|---|---|---|---|---|---|
| Total fertility rate in Sweden | 4.62 | 5.09 | 5.02 | 4.75 | 4.23 | 4.77 | 4.86 | 4.77 | 4.51 | 4.96 | 4.52 | 4.35 | 5.02 | 4.85 | 4.86 |
| Years | 1750 | 1752 | 1754 | 1756 | 1758 | 1760 | 1762 | 1764 | 1766 | 1768 | 1770 | 1772 | 1774 | 1776 | 1778[7] |
|---|---|---|---|---|---|---|---|---|---|---|---|---|---|---|---|
| Total fertility rate in Sweden | 5.09 | 5.29 | 5.4 | 5.23 | 4.68 | 5.06 | 4.98 | 4.92 | 4.79 | 4.77 | 4.68 | 4.1 | 4.89 | 4.67 | 4.94 |
| Years | 1780 | 1782 | 1784 | 1786 | 1788 | 1790 | 1792 | 1794 | 1796 | 1798 | 1800[7] |
|---|---|---|---|---|---|---|---|---|---|---|---|
| Total fertility rate in Sweden | 5.06 | 4.54 | 4.47 | 4.67 | 4.81 | 4.33 | 5.19 | 4.79 | 4.92 | 4.79 | 4.07 |
| Years | 1801 | 1802 | 1803 | 1804 | 1805 | 1806 | 1807 | 1808 | 1809 | 1810[7] |
|---|---|---|---|---|---|---|---|---|---|---|
| Total fertility rate in Sweden | 4.26 | 4.5 | 4.45 | 4.52 | 4.5 | 4.36 | 4.42 | 4.31 | 3.78 | 4.67 |
| Years | 1811 | 1812 | 1813 | 1814 | 1815 | 1816 | 1817 | 1818 | 1819 | 1820[7] |
|---|---|---|---|---|---|---|---|---|---|---|
| Total fertility rate in Sweden | 5.01 | 4.76 | 4.22 | 4.42 | 4.93 | 5.01 | 4.74 | 4.8 | 4.68 | 4.68 |
| Years | 1821 | 1822 | 1823 | 1824 | 1825 | 1826 | 1827 | 1828 | 1829 | 1830[7] |
|---|---|---|---|---|---|---|---|---|---|---|
| Total fertility rate in Sweden | 5.03 | 5.09 | 5.22 | 4.9 | 5.18 | 4.94 | 4.44 | 4.77 | 4.94 | 4.67 |
| Years | 1831 | 1832 | 1833 | 1834 | 1835 | 1836 | 1837 | 1838 | 1839 | 1840[7] |
|---|---|---|---|---|---|---|---|---|---|---|
| Total fertility rate in Sweden | 4.32 | 4.38 | 4.84 | 4.78 | 4.63 | 4.52 | 4.37 | 4.17 | 4.18 | 4.46 |
| Years | 1841 | 1842 | 1843 | 1844 | 1845 | 1846 | 1847 | 1848 | 1849 | 1850[7] |
|---|---|---|---|---|---|---|---|---|---|---|
| Total fertility rate in Sweden | 4.3 | 4.49 | 4.36 | 4.56 | 4.46 | 4.25 | 4.2 | 4.3 | 4.66 | 4.45 |

| Years | 1851 | 1852 | 1853 | 1854 | 1855 | 1856 | 1857 | 1858 | 1859 | 1860[7] |
|---|---|---|---|---|---|---|---|---|---|---|
| Total fertility rate in Sweden | 4.36 | 4.2 | 4.26 | 4.53 | 4.3 | 4.23 | 4.36 | 4.66 | 4.71 | 4.71 |
| Years | 1861 | 1862 | 1863 | 1864 | 1865 | 1866 | 1867 | 1868 | 1869 | 1870[7] |
|---|---|---|---|---|---|---|---|---|---|---|
| Total fertility rate in Sweden | 4.44 | 4.59 | 4.65 | 4.69 | 4.58 | 4.68 | 4.4 | 3.93 | 4.03 | 4.11 |
| Years | 1871 | 1872 | 1873 | 1874 | 1875 | 1876 | 1877 | 1878 | 1879 | 1880[7] |
|---|---|---|---|---|---|---|---|---|---|---|
| Total fertility rate in Sweden | 4.37 | 4.34 | 4.49 | 4.54 | 4.6 | 4.57 | 4.62 | 4.44 | 4.56 | 4.36 |
| Years | 1881 | 1882 | 1883 | 1884 | 1885 | 1886 | 1887 | 1888 | 1889 | 1890[7] |
|---|---|---|---|---|---|---|---|---|---|---|
| Total fertility rate in Sweden | 4.29 | 4.32 | 4.24 | 4.4 | 4.34 | 4.39 | 4.36 | 4.24 | 4.1 | 4.15 |
| Years | 1891 | 1892 | 1893 | 1894 | 1895 | 1896 | 1897 | 1898 | 1899 | 1900[7] |
|---|---|---|---|---|---|---|---|---|---|---|
| Total fertility rate in Sweden | 4.14 | 3.93 | 3.97 | 3.94 | 4.01 | 3.98 | 3.92 | 3.99 | 3.9 | 4 |
Life expectancy
Sources:
1751–1949
| Years | 1751 | 1754 | 1756 | 1768 | 1776 | 1781 | 1789 | 1795 | 1810 | 1818 | 1824 | 1837 | 1847 | 1855 | 1861[8] |
|---|---|---|---|---|---|---|---|---|---|---|---|---|---|---|---|
| Life expectancy in Sweden | 38.4 | 37.4 | 36.2 | 35.0 | 41.5 | 37.8 | 31.2 | 36.5 | 31.9 | 40.0 | 44.9 | 39.6 | 40.1 | 43.0 | 47.1 |
| Years | 1868 | 1872 | 1878 | 1884 | 1890 | 1896 | 1905 | 1911 | 1913 | 1916 | 1922 | 1929 | 1935 | 1943 | 1949[8] |
|---|---|---|---|---|---|---|---|---|---|---|---|---|---|---|---|
| Life expectancy in Sweden | 43.2 | 50.0 | 47.6 | 49.1 | 50.4 | 53.4 | 54.5 | 58.0 | 58.7 | 58.2 | 61.0 | 62.3 | 64.9 | 68.7 | 70.8 |
1950–2015


| Period | Life expectancy in Years |
Period | Life expectancy in Years |
|---|---|---|---|
| 1950–1955 | 71.9 | 1985–1990 | 77.2 |
| 1955–1960 | 72.9 | 1990–1995 | 78.2 |
| 1960–1965 | 73.5 | 1995–2000 | 79.3 |
| 1965–1970 | 74.1 | 2000–2005 | 80.1 |
| 1970–1975 | 74.8 | 2005–2010 | 81.1 |
| 1975–1980 | 75.4 | 2010–2015 | 81.9 |
| 1980–1985 | 76.4 |
Source: UN World Population Prospects
Largest cities or towns in Sweden
"Kommungruppsindelning 2017". Retrieved 16 September 2017. & "SCB befolkningsstatistik". Retrieved 11 July 2018. | |||||||||||
|---|---|---|---|---|---|---|---|---|---|---|---|
Rank
|
Name | County | Pop. |
Metro.
|
Rank
|
Name | County | Pop. |
Metro. |
||
.jpg) Stockholm  Gothenburg |
1 | Stockholm | Stockholm | 952,058 | 2,205,105 | 11 | Umeå | Västerbotten | 125,434 | 137,800 |  Malmö  Uppsala |
| 2 | Gothenburg | Västra Götaland | 565,496 | 1,015,974 | 12 | Lund | Skåne | 121,893 | 197,300 | ||
| 3 | Malmö | Skåne | 351,749 | 689,206 | 13 | Borås | Västra Götaland | 111,354 | 151,300 | ||
| 4 | Uppsala | Uppsala | 221,141 | 257,200 | 14 | Huddinge |
Stockholm | 110,335 | 136,000 | ||
| 5 | Linköping | Östergötland | 158,953 | 189,800 | 15 | Eskilstuna | Södermanland | 105,014 | 110,900 | ||
| 6 | Örebro | Örebro | 150,949 | 196,700 | 16 | Nacka | Stockholm | 101,697 | 114,800 | ||
| 7 | Västerås | Västmanland | 150,564 | 169,200 | 17 | Gävle | Gävleborg | 100,825 | 107,500 | ||
| 8 | Helsingborg | Skåne | 143,671 | 321,500 | 18 | Halmstad | Halland | 99,932 | 119,300 | ||
| 9 | Norrköping | Östergötland | 140,991 | 149,600 | 19 | Sundsvall | Västernorrland | 98,837 | 115,300 | ||
| 10 | Jönköping | Jönköping | 137,863 | 156,700 | 20 | Södertälje | Stockholm | 96,254 | 158,300 | ||
Statistics

Demographic statistics according to the
 Graphs are unavailable due to technical issues. There is more info on Phabricator and on MediaWiki.org.
Graphs are unavailable due to technical issues. There is more info on Phabricator and on MediaWiki.org. |
Graphs are unavailable due to technical issues. There is more info on Phabricator and on MediaWiki.org. |
Population change

people/km²
The demography of Sweden is monitored by Statistics Sweden (SCB).
The 2005 Swedish census showed an increase of 1,488,322 compared to the 1990 census, an average increase of 88,680 annually. During the 1930s, birth rate increased by more than 88128.5 children per year while death rates fell and immigration surged. In the early 2000s, birth rate declined as immigration increased further, with the context of unrest in the Middle East, upholding steady population growth.[10][11]
Population projections
In 1950 Sweden had fewer people aged 10–20 with more people ages 20–30 and 0–10. In 2017 the ratio of male to female remains steady at about 50–50. As a whole, the graph broadens with people appearing to live longer. In 2050 it is predicted that all ages will increase from below 300,000 males and females to above 300,000 males and females. With about 50,000 people living to the ages of 90–100. In 2100 the graph is shaped as a rectangle with people of all ages and genders remaining steady. It narrows slightly at the top of the graph with about 250,000/300,000 males and females living to be 90–100 years old.[12] Statistics Sweden projects the following population development in Sweden:[13]
| Year | Projection |
|---|---|
| 2016 | 9,995,000 |
| 2020 | 10,431,000 |
| 2026 | 11,046,000 |
| 2030 | 11,344,000 |
| 2040 | 11,898,000 |
| 2050 | 12,395,000 |
| 2060 | 12,858,000 |
Eurostat projects a population in Sweden reaching 11,994,364 people in 2040 and 14,388,478 in 2080.[14]
Urbanisation and population density
The
Norrland, which covers approximately 60% of the Swedish territory, has a very low population density (below 5 people per square kilometer). The mountains and most of the remote coastal areas are almost unpopulated. Low population density exists also in large parts of western Svealand, as well as southern and central Småland. An area known as Finnveden, which is located in the south-west of Småland, and mainly below the 57th parallel, can also be considered as almost empty of people.
Origin

The majority of the population are ethnic
In addition to the Sámi,
There are no official statistics on ethnicity, but according to Statistics Sweden, around two million (19.6%) inhabitants in Sweden are born in another country. Of those, more than half are Swedish citizens.[22] The most common countries of origin were Syria (1.82%), Finland (1.45%), Iraq (1.41%), Poland (0.91%), Iran (0.76%) and Somalia (0.67%).[23] The average age in Sweden is 41.1 years.[24]
There are at least two studies that forecast future demographic changes in Sweden largely due to immigration and low birth rates. A 2006 study states that "[based upon current data, extrapolated with relevant assumptions] Sweden and the Netherlands would have majority foreign-origin populations by the end of the [21st] century."[25] A 2018 study concluded that in Sweden by "2065, the share of the native population is [set] to decrease to 49%, the Western population is projected to fall to 63%, and the Muslim population increase to 25%."[26] Thomas Lindh, at the time head researcher for the Swedish Institute for Futures Studies, claimed in an interview that by the year "2050, more than half of Sweden's population will be immigrants or second-generation immigrants."[27]
| Background Groups | Year | |||||||||||||||||||||||||
|---|---|---|---|---|---|---|---|---|---|---|---|---|---|---|---|---|---|---|---|---|---|---|---|---|---|---|
| 1900[28] | 1930[28] | 1950[28] | 1960[28] | 1970[28] | 1980[28] | 1990[28] | 2002[29] | 2005[29] | 2010[29] | 2015[29] | 2020[30] | 2022[31] | ||||||||||||||
| Number | % | Number | % | Number | % | Number | % | Number | % | Number | % | Number | % | Number | % | Number | % | Number | % | Number | % | Number | % | Number | % | |
| Swedes with two Swedish parents | – | – | – | – | – | – | – | – | – | – | – | – | – | – | 7,028,802 | 78.61% | 6,997,684 | 77.34% | 6,965,033 | 73.97% | 6,939,156 | 70.44% | 6,900,476 | 66.5% | 6,878,225 | 65.4% |
| Swedes with one Swedish parent and one foreign born | – | – | – | – | – | – | – | – | – | – | – | – | – | – | 553,772 | 6.19% | 586,710 | 6.48% | 652,648 | 6.93% | 724,841 | 7.35% | 792,779 | 7.6% | 816,209 | 7.8% |
| – | – | – | – | – | – | – | – | – | – | 7,561,000 | 91% | 7,613,600 | 88.6% | 7,582,574 | 84.8% | 7,584,394 | 83.82% | 7,617,681 | 80.90% | 7,663,997 | 77.79% | 7,693,255 | 74.1% | 7,694,434 | 73.1% | |
| Born in Sweden to two foreign-born parents | – | – | – | – | – | – | – | – | – | – | 130,000 | 1.5% | 187,000 | 2.2% | 304,751 | 3.40% | 337,568 | 3.73% | 412,960 | 4.38% | 510,756 | 5.18% | 639,309 | 6.2% | 681,448 | 6.5% |
| Born outside Sweden | 36,000 | 0.7% | 62,000 | 1% | 198,000 | 2.8% | 300,000 | 4% | 538,000 | 6.7% | 627,000 | 7.5% | 790,000 | 9.2% | 1,053,463 | 11.78% | 1,125,790 | 12.44% | 1,384,929 | 14.70% | 1,676,264 | 17.01% | 2,046,731 | 19.7% | 2,145,674 | 20.4% |
| Total: Foreign background | – | – | – | – | – | – | – | – | – | – | 757,000 | 9% | 977,000 | 11.4% | 1,358,214 | 15.19% | 1,463,358 | 16.17% | 1,797,889 | 19.09% | 2,187,020 | 22.20% | 2,686,040 | 25.9% | 2,827,122 | 26.9% |
| Overall Total | 5,136,441 | 100% | 6,142,191 | 100% | 7,041,829 | 100% | 7,497,967 | 100% | 8,081,229 | 100% | 8,317,937 | 100% | 8,590,630 | 100% | 8,940,788 | 100% | 9,047,752 | 100% | 9,415,570 | 100% | 9,851,017 | 100% | 10,379,295 | 100% | 10,521,556 | 100% |
- Origin groups mapped as percentage of the population in counties in Sweden
-
 Swedes of two Swedish parents in Sweden's counties and overall as of 2020.
 -
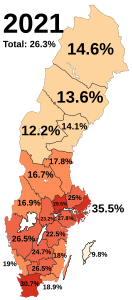 Percentage of those of a foreign background in total in Sweden in 2021


- Population pyramids of each origin group
-
 Population pyramid of Sweden by origin group in 2021
 -
 Swede of two Swedish parents
 -
 Swede of one Swedish parent and one foreign born
 -
 Foreign born
 -
 Born in Sweden to two foreign born parents


Vital statistics

Data according to Statistics Sweden, which collects the official statistics for Sweden.[32]
| Average population (31 december) |
Live births | Deaths | Natural change |
Crude birth rate (per 1000) | Crude death rate (per 1000) | Natural change (per 1000) | Crude migration change (per 1000) | ||
|---|---|---|---|---|---|---|---|---|---|
| 1900 | 5,136,441 [33] | 138,139 | 86,146 | 51,993 | 27.0 | 16.8 | 10.2 | 4.02 | |
| 1901 | 5,175,228 | 139,370 | 82,772 | 56,598 | 27.0 | 16.1 | 10.9 | -3.3 | 4.04 |
| 1902 | 5,198,752 | 137,364 | 79,722 | 57,642 | 26.5 | 15.4 | 11.1 | -6.6 | 3.95 |
| 1903 | 5,221,291 | 133,896 | 78,610 | 55,286 | 25.7 | 15.1 | 10.6 | -6.3 | 3.82 |
| 1904 | 5,260,811 | 134,952 | 80,152 | 54,800 | 25.7 | 15.3 | 10.4 | -2.8 | 3.83 |
| 1905 | 5,294,885 | 135,409 | 82,443 | 52,966 | 25.7 | 15.6 | 10.1 | -3.6 | 3.83 |
| 1906 | 5,337,055 | 136,620 | 76,366 | 60,254 | 25.7 | 14.4 | 11.3 | -3.3 | 3.81 |
| 1907 | 5,377,713 | 136,793 | 78,149 | 58,644 | 25.5 | 14.6 | 10.9 | -3.3 | 3.77 |
| 1908 | 5,429,600 | 138,874 | 80,568 | 58,306 | 25.7 | 14.9 | 10.8 | -1.2 | 3.79 |
| 1909 | 5,476,441 | 139,505 | 74,538 | 64,967 | 25.6 | 13.7| | 11.9 | -3.3 | 3.71 |
| 1910 | 5,522,403 | 135,625 | 77,212 | 58,413 | 24.7 | 14.0 | 10.7 | -2.3 | 3.60 |
| 1911 | 5,561,799 | 132,977 | 76,462 | 56,515 | 24.0 | 13.8 | 10.2 | -3.1 | 3.49 |
| 1912 | 5,604,192 | 132,868 | 79,241 | 53,627 | 23.8 | 14.2 | 9.6 | -2.0 | 3.44 |
| 1913 | 5,638,583 | 130,200 | 76,724 | 53,476 | 23.2 | 13.6 | 9.6 | -3.5 | 3.32 |
| 1914 | 5,679,607 | 129,458 | 78,311 | 51,147 | 22.9 | 13.8 | 9.1 | -1.8 | 3.29 |
| 1915 | 5,712,740 | 122,997 | 83,587 | 39,410 | 21.6 | 14.7 | 6.9 | -1.1 | 3.06 |
| 1916 | 5,757,566 | 121,679 | 77,771 | 43,908 | 21.2 | 13.6 | 7.6 | 0.2 | 2.99 |
| 1917 | 5,800,847 | 120,855 | 77,385 | 43,470 | 20.9 | 13.4 | 7.5 | 0.0 | 2.93 |
| 1918 | 5,813,850 | 117,955 | 104,594 | 13,361 | 20.3 | 18.0 | 2.3 | -0.1 | 2.83 |
| 1919 | 5,847,037 | 115,193 | 84,289 | 30,904 | 19.8 | 14.5 | 5.3 | 0.4 | 2.72 |
| 1920 | 5,904,489 | 138,753 | 78,128 | 60,625 | 23.6 | 13.3 | 10.3 | -0.5 | 3.22 |
| 1921 | 5,954,316 | 127,723 | 73,536 | 54,187 | 21.5 | 12.4 | 9.1 | -0,7 | 2.93 |
| 1922 | 5,987,520 | 116,946 | 76,343 | 40,603 | 19.6 | 12.8 | 6.8 | -1.2 | 2.66 |
| 1923 | 6,005,759 | 113,435 | 68,424 | 45,011 | 18.9 | 11.4 | 7.5 | -4.5 | 2.55 |
| 1924 | 6,036,118 | 109,055 | 72,001 | 37,054 | 18.1 | 12.0 | 6.1 | -1.0 | 2.43 |
| 1925 | 6,053,562 | 106,292 | 70,918 | 35,374 | 17.6 | 11.7 | 5.9 | -3.0 | 2.34 |
| 1926 | 6,074,368 | 102,007 | 71,344 | 30,663 | 16.8 | 11.8 | 5.0 | -1.6 | 2.22 |
| 1927 | 6,087,923 | 97,994 | 77,219 | 20,775 | 16.1 | 12.7 | 3.4 | -1.2 | 2.11 |
| 1928 | 6,105,190 | 97,868 | 73,267 | 24,601 | 16.1 | 12.0 | 4.1 | -1.3 | 2.08 |
| 1929 | 6,120,080 | 92,861 | 74,538 | 18,323 | 15.2 | 12.2 | 3.0 | -0.6 | 1.95 |
| 1930 | 6,142,191 | 94,220 | 71,790 | 22,430 | 15.4 | 11.7 | 3.7 | -0.1 | 1.96 |
| 1931 | 6,162,446 | 91,074 | 77,121 | 13,953 | 14.8 | 12.5 | 2.3 | 1.0 | 1.88 |
| 1932 | 6,190,364 | 89,779 | 71,459 | 18,320 | 14.5 | 11.6 | 2.9 | 1.6 | 1.83 |
| 1933 | 6,211,566 | 85,020 | 69,607 | 15,413 | 13.7 | 11.2 | 2.5 | 0.9 | 1.72 |
| 1934 | 6,233,090 | 85,092 | 69,921 | 15,171 | 13.7 | 11.2 | 2.5 | 1.0 | 1.67 |
| 1935 | 6,250,506 | 85,906 | 72,813 | 13,093 | 13.8 | 11.7 | 2.1 | 0.7 | 1.70 |
| 1936 | 6,266,888 | 88,938 | 74,836 | 14,102 | 14.2 | 12.0 | 2.2 | 0.4 | 1.75 |
| 1937 | 6,284,722 | 90,373 | 75,392 | 14,981 | 14.4 | 12.0 | 2.4 | 0.4 | 1.77 |
| 1938 | 6,310,214 | 93,946 | 72,693 | 21,253 | 14.9 | 11.5 | 3.4 | 0.7 | 1.84 |
| 1939 | 6,341,303 | 97,380 | 72,876 | 24,504 | 15.4 | 11.5 | 3.9 | 1.0 | 1.90 |
| 1940 | 6,371,432 | 95,778 | 72,748 | 23,030 | 15.1 | 11.4 | 3.7 | 1.1 | 1.86 |
| 1941 | 6,406,474 | 99,727 | 71,910 | 27,817 | 15.6 | 11.3 | 4.3 | 1.2 | 1.92 |
| 1942 | 6,458,200 | 113,961 | 63,741 | 50,220 | 17.7 | 9.9 | 7.8 | 0.3 | 2.19 |
| 1943 | 6,522,827 | 125,392 | 66,105 | 59,287 | 19.3 | 10.2 | 9.1 | 0.9 | 2.41 |
| 1944 | 6,597,348 | 134,991 | 72,284 | 62,707 | 20.6 | 11.0 | 10.6 | 0.8 | 2.61 |
| 1945 | 6,673,749 | 135,373 | 71,901 | 63,472 | 20.4 | 10.8 | 10.4 | 1.2 | 2.63 |
| 1946 | 6,763,685 | 132,597 | 70,635 | 61,962 | 19.7 | 10.5 | 9.2 | 4.3 | 2.57 |
| 1947 | 6,842,046 | 128,779 | 73,579 | 55,200 | 18.9 | 10.8 | 8.1 | 3.5 | 2.50 |
| 1948 | 6,924,888 | 126,683 | 67,693 | 58,990 | 18.4 | 9.8 | 8.6 | 3.5 | 2.47 |
| 1949 | 6,986,181 | 121,272 | 69,537 | 51,735 | 17.4 | 10.0 | 7.4 | 1.5 | 2.39 |
| 1950 | 7,041,829 | 115,414 | 70,296 | 45,118 | 16.5 | 10.0 | 6.5 | 1.5 | 2.28 |
| 1951 | 7,098,740 | 110,168 | 69,799 | 40,369 | 15.6 | 9.9 | 5.7 | 2.4 | 2.20 |
| 1952 | 7,150,606 | 110,192 | 68,270 | 41,922 | 15.5 | 9.6 | 5.9 | 1.4 | 2.22 |
| 1953 | 7,192,316 | 110,144 | 69,553 | 40,591 | 15.4 | 9.7 | 5.7 | 0.1 | 2.25 |
| 1954 | 7,234,667 | 105,096 | 69,030 | 36,066 | 14.6 | 9.6 | 5.0 | 0.9 | 2.18 |
| 1955 | 7,290,112 | 107,305 | 68,634 | 38,671 | 14.8 | 9.5 | 5.3 | 2.4 | 2.25 |
| 1956 | 7,338,991 | 107,960 | 70,205 | 37,755 | 14.8 | 9.6 | 5.2 | 1.5 | 2.29 |
| 1957 | 7,388,611 | 107,168 | 73,132 | 34,036 | 14.6 | 9.9 | 4.7 | 2.1 | 2.29 |
| 1958 | 7,429,675 | 105,502 | 71,065 | 34,437 | 14.2 | 9.6 | 4.6 | 1.0 | 2.26 |
| 1959 | 7,462,823 | 104,743 | 70,889 | 33,854 | 14.1 | 9.5 | 4.5 | 0.0 | 2.29 |
| 1960 | 7,497,967 | 102,219 | 75,093 | 27,126 | 13.7 | 10.0 | 3.7 | 1.0 | 2.17 |
| 1961 | 7,542,028 | 104,501 | 73,555 | 30,946 | 13.9 | 9.8 | 4.1 | 1.8 | 2.21 |
| 1962 | 7,581,148 | 107,284 | 76,791 | 30,493 | 14.2 | 10.2 | 5.6 | -0.4 | 2.25 |
| 1963 | 7,627,507 | 112,903 | 76,460 | 36,443 | 14.8 | 10.1 | 4.7 | 1.4 | 2.33 |
| 1964 | 7,695,200 | 122,664 | 76,661 | 46,003 | 16.0 | 10.0 | 6.0 | 2.9 | 2.47 |
| 1965 | 7,772,506 | 122,806 | 78,194 | 44,612 | 15.9 | 10.1 | 5.8 | 4.2 | 2.39 |
| 1966 | 7,843,088 | 123,354 | 78,440 | 44,914 | 15.8 | 10.0 | 5.8 | 3.3 | 2.37 |
| 1967 | 7,892,774 | 121,360 | 79,783 | 41,577 | 15.4 | 10.1 | 5.3 | 1.0 | 2.28 |
| 1968 | 7,931,193 | 113,087 | 82,476 | 30,611 | 14.3 | 10.4 | 3.9 | 1.0 | 2.07 |
| 1969 | 8,004,270 | 107,622 | 83,352 | 24,270 | 13.5 | 10.5 | 3.0 | 6.2 | 1.94 |
| 1970 | 8,081,142 | 110,150 | 80,026 | 30,124 | 13.7 | 9.9 | 3.8 | 5.8 | 1.94 |
| 1971 | 8,115,165 | 114,484 | 82,717 | 31,767 | 14.1 | 10.2 | 3.9 | 0.3 | 1.98 |
| 1972 | 8,129,129 | 112,273 | 84,051 | 28,222 | 13.8 | 10.3 | 3.5 | -1.8 | 1.93 |
| 1973 | 8,144,428 | 109,663 | 85,640 | 24,023 | 13.5 | 10.5 | 3.0 | -1.1 | 1.88 |
| 1974 | 8,176,691 | 109,874 | 86,316 | 23,558 | 13.5 | 10.6 | 2.9 | 1.1 | 1.91 |
| 1975 | 8,208,442 | 103,632 | 88,208 | 15,424 | 12.6 | 10.8 | 1.8 | 2.1 | 1.78 |
| 1976 | 8,236,179 | 98,345 | 90,677 | 7,668 | 12.0 | 11.0 | 1.0 | 2.4 | 1.70 |
| 1977 | 8,267,116 | 96,057 | 88,202 | 7,855 | 11.6 | 10.7 | 0.9 | 2.9 | 1.64 |
| 1978 | 8,284,437 | 93,248 | 89,681 | 3,567 | 11.3 | 10.8 | 0.5 | 1.6 | 1.61 |
| 1979 | 8,303,010 | 96,255 | 91,074 | 5,181 | 11.6 | 11.0 | 0.6 | 1.6 | 1.66 |
| 1980 | 8,317,937 | 97,064 | 91,800 | 5,264 | 11.7 | 11.0 | 0.7 | 1.1 | 1.69 |
| 1981 | 8,323,033 | 94,065 | 92,034 | 2,031 | 11.3 | 11.1 | 0.2 | 0.4 | 1.63 |
| 1982 | 8,327,484 | 92,748 | 90,671 | 2,077 | 11.1 | 10.9 | 0.2 | 0.3 | 1.60 |
| 1983 | 8,330,573 | 91,780 | 90,791 | 989 | 11.0 | 10.9 | 0.1 | 0.3 | 1.61 |
| 1984 | 8,342,621 | 93,889 | 90,483 | 3,406 | 11.3 | 10.9 | 0.4 | 1.0 | 1.66 |
| 1985 | 8,358,139 | 98,463 | 94,032 | 4,431 | 11.8 | 11.3 | 0.5 | 1.4 | 1.74 |
| 1986 | 8,381,515 | 101,950 | 93,295 | 8,655 | 12.2 | 11.1 | 1.1 | 1.7 | 1.79 |
| 1987 | 8,414,083 | 104,699 | 93,307 | 11,392 | 12.5 | 11.1 | 1.4 | 2.5 | 1.84 |
| 1988 | 8,458,888 | 112,080 | 96,743 | 15,337 | 13.3 | 11.5 | 1.8 | 3.5 | 1.96 |
| 1989 | 8,527,036 | 116,023 | 92,110 | 23,913 | 13.7 | 10.8 | 2.9 | 5.2 | 2.02 |
| 1990 | 8,590,630 | 123,938 | 95,161 | 28,777 | 14.5 | 11.1 | 3.4 | 4.1 | 2.14 |
| 1991 | 8,644,119 | 123,737 | 95,202 | 28,535 | 14.4 | 11.0 | 3.4 | 2.8 | 2.12 |
| 1992 | 8,692,013 | 122,848 | 94,710 | 28,138 | 14.2 | 10.9 | 3.3 | 2.2 | 2.09 |
| 1993 | 8,745,109 | 117,998 | 97,008 | 20,990 | 13.5 | 11.1 | 2.4 | 3.7 | 2.00 |
| 1994 | 8,816,381 | 112,257 | 91,844 | 20,413 | 12.8 | 10.5 | 2.3 | 5.8 | 1.90 |
| 1995 | 8,837,496 | 103,326 | 96,910 | 6,416 | 11.7 | 11.0 | 0.7 | 1.7 | 1.74 |
| 1996 | 8,844,499 | 95,297 | 94,133 | 1,164 | 10.8 | 10.6 | 0.2 | 0.6 | 1.61 |
| 1997 | 8,847,625 | 89,171 | 92,674 | -3,503 | 10.1 | 10.5 | -0.4 | 0.8 | 1.52 |
| 1998 | 8,854,322 | 88,384 | 92,891 | -4,507 | 10.0 | 10.5 | -0.5 | 1.3 | 1.51 |
| 1999 | 8,861,426 | 88,173 | 94,726 | -6,553 | 10.0 | 10.7 | -0.7 | 1.5 | 1.50 |
| 2000 | 8,882,792 | 90,441 | 93,285 | -2,844 | 10.2 | 10.5 | -0.3 | 2.7 | 1.54 |
| 2001 | 8,909,128 | 91,466 | 93,752 | -2,286 | 10.3 | 10.5 | -0.2 | 3.2 | 1.57 |
| 2002 | 8,940,788 | 95,815 | 95,009 | 806 | 10.7 | 10.6 | 0.1 | 3.5 | 1.65 |
| 2003 | 8,975,670 | 99,157 | 92,961 | 6,196 | 11.1 | 10.4 | 0.7 | 3.2 | 1.71 |
| 2004 | 9,011,392 | 100,928 | 90,532 | 10,396 | 11.2 | 10.1 | 1.1 | 2.9 | 1.75 |
| 2005 | 9,047,752 | 101,346 | 91,710 | 9,636 | 11.2 | 10.2 | 1.0 | 3.0 | 1.77 |
| 2006 | 9,113,257 | 105,913 | 91,177 | 14,736 | 11.7 | 10.0 | 1.7 | 5.5 | 1.85 |
| 2007 | 9,182,927 | 107,421 | 91,729 | 15,692 | 11.7 | 10.0 | 1.7 | 5.9 | 1.88 |
| 2008 | 9,256,347 | 109,301 | 91,449 | 17,852 | 11.9 | 9.9 | 2.0 | 6.0 | 1.91 |
| 2009 | 9,340,682 | 111,801 | 90,080 | 21,721 | 12.0 | 9.7 | 2.3 | 6.8 | 1.93 |
| 2010 | 9,415,570 | 115,641 | 90,487 | 25,154 | 12.3 | 9.6 | 2.7 | 5.3 | 1.98 |
| 2011 | 9,482,885 | 111,770 | 89,938 | 21,832 | 11.8 | 9.5 | 2.3 | 4.8 | 1.90 |
| 2012 | 9,555,893 | 113,177 | 91,938 | 21,239 | 11.9 | 9.7 | 2.2 | 5.5 | 1.90 |
| 2013 | 9,644,000 | 113,593 | 90,402 | 23,191 | 11.8 | 9.4 | 2.4 | 6.8 | 1.89 |
| 2014 | 9,747,000 | 114,907 | 88,976 | 25,931 | 11.9 | 9.2 | 2.7 | 8.0 | 1.88 |
| 2015 | 9,851,000 | 114,870 | 90,907 | 23,963 | 11.7 | 9.3 | 2.4 | 8.3 | 1.85 |
| 2016 | 9,995,000 | 117,425 | 90,982 | 26,443 | 11.8 | 9.2 | 2.6 | 12.0 | 1.85 |
| 2017 | 10,120,000 | 115,416 | 91,972 | 23,444 | 11.4 | 9.1 | 2.3 | 10.2 | 1.78 |
| 2018 | 10,230,000 | 115,832 | 92,185 | 23,647 | 11.3 | 9.0 | 2.3 | 8.6 | 1.75 |
| 2019 | 10,327,000 | 114,523 | 88,766 | 25,757 | 11.1 | 8.6 | 2.5 | 7.0 | 1.70 |
| 2020 | 10,379,000 | 113,077 | 98,124 | 14,953 | 10.9 | 9.5 | 1.4 | 3.6 | 1.66 |
| 2021 | 10,452,326 | 114,263 | 91,958 | 22,305 | 10.9 | 8.8 | 2.1 | 4.9 | 1.67 |
| 2022 | 10,521,556 | 104,734 | 94,737 | 9,997 | 10.0 | 9.0 | 1.0 | 5.6 | 1.52 |
| 2023 | 10,551,700 | 100,051 | 94,385 | 5,666 | 9.5 | 9.0 | 0.5 | 2.3 | 1.45 |
In 2021 80,465 (70.4%) babies were born to Swedish-born mothers while 33,798 (29.6%) were born to foreign-born mothers. The total fertility rate for Swedish-born women was 1.62, for foreign-born ones 1.86. [34] In 2022 73,294 (70.0%) babies were born to Swedish-born mothers while 31,440 (30.0%) were born to foreign-born mothers. The total fertility rate for Swedish-born women was 1.47, for foreign-born ones 1.69.[35]
Current vital statistics
| Period | Live births | Deaths | Natural increase |
|---|---|---|---|
| January - February 2023 | 16,207 | 17,083 | -876 |
| January - February 2024 | 15,843 | 16,575 | -732 |
| Difference |
Structure of the population
| Age Group | Male | Female | Total | % |
|---|---|---|---|---|
| Total | 5 222 847 | 5 156 448 | 10 379 295 | 100 |
| 0–4 | 305 880 | 289 196 | 595 076 | 5.73 |
| 5–9 | 319 463 | 300 892 | 620 355 | 5.98 |
| 10–14 | 320 338 | 302 029 | 622 367 | 6.00 |
| 15–19 | 298 045 | 278 531 | 576 576 | 5.56 |
| 20–24 | 307 498 | 271 966 | 579 464 | 5.58 |
| 25–29 | 369 377 | 348 382 | 717 759 | 6.92 |
| 30–34 | 378 916 | 361 033 | 739 949 | 7.13 |
| 35–39 | 338 542 | 320 188 | 658 730 | 6.35 |
| 40–44 | 323 615 | 310 620 | 634 235 | 6.11 |
| 45–49 | 338 455 | 328 772 | 667 227 | 6.43 |
| 50–54 | 339 035 | 329 537 | 668 572 | 6.44 |
| 55–59 | 324 658 | 317 015 | 641 673 | 6.18 |
| 60–64 | 285 462 | 283 764 | 569 226 | 5.48 |
| 65-69 | 265 210 | 271 524 | 536 734 | 5.17 |
| 70-74 | 268 233 | 282 384 | 550 617 | 5.30 |
| 75-79 | 219 254 | 237 761 | 457 015 | 4.40 |
| 80-84 | 125 935 | 155 095 | 281 030 | 2.71 |
| 85-89 | 64 699 | 98 675 | 163 374 | 1.57 |
| 90-94 | 24 686 | 51 690 | 76 376 | 0.74 |
| 95-99 | 5 132 | 15 359 | 20 491 | 0.20 |
| 100+ | 414 | 2 035 | 2 449 | 0.02 |
| Age group | Male | Female | Total | Percent |
| 0–14 | 945 681 | 892 117 | 1 837 798 | 17.71 |
| 15–64 | 3 303 603 | 3 149 808 | 6 453 411 | 62.18 |
| 65+ | 973 563 | 1 114 523 | 2 088 086 | 20.12 |
Migration

Prior to World War II, emigrants generally outnumbered immigrants. Since then, net migration has been positive with many immigrants coming to Sweden from the 1970s through today.
Emigration
Between 1820 and 1930, approximately 1.3 million Swedes, a third of the country's population at the time,
Immigration

.jpg)
The demographic profile of Sweden has altered considerably due to immigration patterns since the 1970s. As of 2020, Statistics Sweden reported that around 2,686,040 or 25.9% of the inhabitants of Sweden were from a foreign background: that is, each such person either had been born abroad or had been born in Sweden to two parents who themselves had both been born abroad.[40] Also taking into account people with only one parent born abroad, this number increases to one third (33.5%).[41]
Additionally, the birth rate among immigrant women after arriving in Sweden is somewhat higher than among ethnic Swedes.[42] Taking into account the fact that immigrant women have on average fewer[citation needed] children than Swedish women of comparable age, however, the difference in total birth rate is only 0.1 children more if the woman is foreign born – with the disclaimer that some women may have children not immigrating to and not reported in Sweden, who are thus not included in the statistics.[43]
Historical immigration
- World War II
A sizeable community from the
- 1945 to 1967
During the 1950s and 1960s, the recruitment of immigrant labour was an important factor of immigration. The Nordic countries signed a trade agreement in 1952, establishing a common labour market and free movement across borders. This migration within the Nordic countries, especially from Finland, was essential to create the tax-base required for the expansion of the strong public sector now characteristic of Scandinavia.[citation needed] but the influx gave rise to an anti-Finnish sentiment within Sweden and Norway. This continued until 1967, when the labour market became saturated, and Sweden introduced new immigration controls.
On a smaller scale, Sweden took in
Contemporary immigration

Since the early 1970s, immigration to Sweden has been mostly due to refugee migration and family reunification from countries in the Middle East and Latin America.[45] According to Eurostat, in 2010, there were 1.33 million foreign-born residents in Sweden, corresponding to 14.3% of the total population. Of these, 859,000 (64.3%) were born outside the EU and 477,000 (35.7%) were born in another EU Member State.[46][47] By comparison, the Swedish civil registry reports, for 2018, that nearly 1.96 million residents are foreign-born, a 47% increase from 2010. There are 8.27 million Swedish-born residents, giving a total population of 10.23 million, and a 19.1% foreign-born population.[48]
The first group of
Immigrants from
Immigration of
A significant number of
Note that the table below lists the citizenship the person had when arriving in Sweden, and therefore there are no registered
| Country | 1900 | 1930 | 1960 | 1990 | 2000 | 2010 | 2020 | 2021 | 2022 | 2023 |
|---|---|---|---|---|---|---|---|---|---|---|
| – | – | 6 | 5,874 | 14,162 | 20,758 | 193,594 | 196,077 | 197,799 | 197,201 | |
| – | – | 16 | 9,818 | 49,372 | 121,761 | 146,440 | 146,769 | 146,831 | 145,586 | |
| 6,644 | 9,746 | 101,307 | 217,636 | 195,447 | 169,521 | 140,337 | 136,607 | 133,083 | 129,406 | |
| – | 1,065 | 6,347 | 35,631 | 40,123 | 70,253 | 93,762 | 95,076 | 98,387 | 100,706 | |
| 2 | 8 | 115 | 40,084 | 51,101 | 62,120 | 81,301 | 83,122 | 85,488 | 86,838 | |
| – | – | – | 1,441 | 13,082 | 37,846 | 70,184 | 70,087 | 69,477 | 68,290 | |
| – | 19 | 1,532 | 43,346 | 71,972 | 70,819 | 63,419 | 62,444 | 61,554 | 60,636 | |
| – | – | 17 | 534 | 4,287 | 14,420 | 60,858 | 62,803 | 65,662 | 67,738 | |
| – | – | – | – | 51,526 | 56,183 | 60,161 | 60,194 | 60,265 | 60,003 | |
| 15 | 22 | 202 | 25,528 | 31,894 | 42,527 | 52,628 | 54,004 | 55,954 | 56,871 | |
| 5,107 | 8,566 | 37,580 | 37,558 | 38,155 | 48,158 | 51,434 | 52,960 | 55,642 | 56,969 | |
| – | – | – | – | 3,054 | 10,301 | 47,156 | 48,278 | 49,213 | 49,639 | |
| – | – | 20 | 4,934 | 10,353 | 31,378 | 44,339 | 45,109 | 45,631 | 45,940 | |
| 45 | 135 | 361 | 9,054 | 11,110 | 17,863 | 42,790 | 47,369 | 53,973 | 58,094 | |
| 7,978 | 14,731 | 37,253 | 52,744 | 42,464 | 43,480 | 41,062 | 40,625 | 40,277 | 39,951 | |
| 6,872 | 8,726 | 35,112 | 43,931 | 38,190 | 45,548 | 38,929 | 38,474 | 38,070 | 37,655 | |
| 34 | 201 | 520 | 3,896 | 8,150 | 23,998 | 36,023 | 37,172 | 38,461 | 38,253 | |
| 3 | 34 | 719 | 8,785 | 11,776 | 19,741 | 32,741 | 33,695 | 35,565 | 36,738 | |
| 779 | 1,270 | 2,738 | 11,378 | 14,602 | 20,839 | 31,035 | 31,993 | 32,575 | 32,916 | |
| – | – | 15 | 15,986 | 20,038 | 24,116 | 28,885 | 29,313 | 29,770 | 29,876 | |
| 6 | 28 | 69 | 27,635 | 26,842 | 28,387 | 27,918 | 27,894 | 27,869 | 27,756 | |
| 5,130 | 8,852 | 10,874 | 13,001 | 14,413 | 17,179 | 23,290 | 24,173 | 24,970 | 25,739 | |
| 1,506 | – | – | – | 6,523 | 15,511 | 22,774 | 23,455 | 24,775 | 25,568 | |
| 5 | – | 59 | 10,027 | 11,907 | 13,822 | 22,125 | 22,672 | 23,141 | 23,363 | |
| – | – | 11 | 2,291 | 3,100 | 10,265 | 21,172 | 24,183 | 27,292 | 28,614 | |
| – | – | 1 | 6,265 | 10,898 | 14,584 | 21,126 | 21,528 | 21,874 | 21,983 | |
| 5 | 22 | 266 | 13,171 | 10,851 | 11,381 | 19,737 | 19,931 | 20,672 | 21,237 | |
| 50 | 108 | 8,544 | 15,045 | 14,127 | 15,339 | 16,480 | 16,381 | 16,568 | 16,900 | |
| – | 149 | – | 233 | 785 | 6,735 | 15,917 | 16,434 | 17,396 | 17,944 | |
| – | – | – | – | – | 5,324 | 15,874 | 16,719 | 17,567 | 17,927 | |
| – | – | 5 | 2,613 | 5,460 | 9,826 | 15,640 | 16,219 | 16,790 | 17,311 | |
| 200 | 367 | 4,904 | 5,989 | 6,337 | 7,804 | 14,155 | 14,786 | 15,665 | 16,397 | |
| – | – | 73 | 4,650 | 7,317 | 10,531 | 13,060 | 13,411 | 13,782 | 14,055 | |
| 30 | 64 | 867 | 4,917 | 5,079 | 6,763 | 12,930 | 13,409 | 14,060 | 14,534 | |
| 50 | 208 | 2,105 | 3,543 | 4,532 | 8,700 | 12,769 | 13,523 | 14,774 | 15,772 | |
| – | – | – | 1,571 | 2,937 | 6,289 | 12,279 | 12,965 | 13,904 | 13,987 | |
| – | – | – | – | 5,229 | 6,277 | 12,207 | 12,559 | 13,016 | 13,204 | |
| – | – | – | – | 1,459 | 4,741 | 11,899 | 12,891 | 13,937 | 14,297 | |
| – | – | 22 | 2,720 | 4,492 | 7,391 | 11,898 | 12,207 | 12,573 | 12,823 | |
| 255 | 599 | 1,750 | 3,844 | 5,602 | 7,944 | 11,854 | 12,618 | 13,445 | 14,006 | |
| – | – | 47 | 8,205 | 9,170 | 10,398 | 11,719 | 11,795 | 11,945 | 11,985 | |
| 10,268 | 10,768 | 10,866 | ||||||||
| 10,653 | 11,131 | |||||||||
| 10,052 | 10,427 | 10,741 | ||||||||
| 10,323 | 11,154 | |||||||||
| – | – | – | – | – | 2,288 | 11,164 | 11,920 | 12,605 | 12,913 | |
| 41 | 92 | 175 | 2,118 | 3,496 | 6,005 | 10,725 | 11,680 | 12,832 | 13,305 | |
| 10,453 | ||||||||||
| 10,420 | ||||||||||
| Total | 35,627 | 61,657 | 299,879 | 790,445 | 1,003,798 | 1,384,929 | 2,046,731 |
Language
The Swedish language is by far the dominating language in Sweden, and is used by the government administration. English is also widely spoken and is taught in public schools.
Since 1999, Sweden has five officially recognised
The
Similarly,
and its immediate neighbourhood. Finnish is also official language, along with Swedish, in the city of Eskilstuna.[citation needed]During the mid to late 20th century, immigrant communities brought other languages, among others being
Religion
The majority (56.8%) of the population belongs to the
Homelessness
Homelessness in Sweden affects some 34,000 people.[59][60]
The Swedish government's response to homelessness has included commissioning national surveys on homelessness during the last decade that allow for direct comparison between Sweden, Denmark and Norway.[61] The three countries have very similar definitions of homelessness, with minor variations.[62]
Some researchers maintain that measures to counteract homelessness in Sweden are largely dependent on a general premise equating homelessness with addiction, mental illness and deviance.[63] On the other hand, youth homelessness is considered a child protection problem.[64]See also
- Statistics Sweden
- Municipalities of Sweden
- Demographical center of Sweden
- Immigration to Europe
- List of countries by immigrant population
- Aging of Europe
- List of Swedish counties by fertility rate
Notes
- ^ Crude migration change (per 1,000) is a trend analysis, an extrapolation based average population change (current year minus previous) minus natural change of the current year (see table vital statistics). As average population is an estimate of the population in the middle of the year and not end of the year.
- ^ In fertility rates, 2.1 and above represents a stable or increasing population and have been marked blue, while 2.0 and below leads to an aging and, ultimately, declining population.
References
- ^ "Summerad fruktsamhet efter region och kön. År 2000 – 2020". Statistikdatabasen. Archived from the original on 26 January 2021. Retrieved 4 July 2021.
- ^ Radio, Sveriges (20 January 2017). "Swedish population hits 10-million mark – Radio Sweden". Sveriges Radio. Archived from the original on 3 September 2019. Retrieved 19 September 2019.
- ^ "Sweden's population reaches historic ten million milestone". www.thelocal.se. 20 January 2017. Archived from the original on 14 September 2019. Retrieved 19 September 2019.
- ^ "Fler med finsk bakgrund i Sverige". Sveriges Radio. Sverige Radio. 22 February 2013. Archived from the original on 12 June 2018. Retrieved 19 January 2021.
- ^ "Sveriges framtida befolkning 2021–2070". Statistiska Centralbyrån (in Swedish). Archived from the original on 9 September 2021. Retrieved 9 September 2021.
- ^ "Sweden Population 2018", World Population Review, archived from the original on 18 May 2019, retrieved 19 July 2018
- ^ Our World In Data, Gapminder Foundation, archived from the originalon 7 August 2018, retrieved 7 August 2018
- ^ a b "Life expectancy". Our World in Data. Archived from the original on 19 October 2021. Retrieved 11 October 2018.
- ^ Sweden Archived 18 January 2021 at the Wayback Machine. The World Factbook. Central Intelligence Agency.
- ^ "The 2005 population and housing census in Sweden will be totally register-based". Census Knowledge Base. United Nations Statistics Division. Archived from the original on 11 October 2018. Retrieved 11 October 2018.
- ^ Bruhn, Åke (6 July 2001). "The 2005 population and housing census in Sweden will be totally register-based". Symposium on Global Review of 2000 Round of Population and Housing Censuses: Mid-Decade Assessment and Future Prospects. Archived from the original on 1 November 2016. Retrieved 12 March 2017: Does not provide figures, only methodology.
{{cite web}}: CS1 maint: postscript (link) - ^ "World Population Prospects – Population Division – United Nations". Esa.un.org. Archived from the original on 1 December 2017. Retrieved 16 December 2017.
- ^ "Sveriges framtida befolkning 2017–2060" (PDF). Statistics Sweden. Archived (PDF) from the original on 17 April 2017. Retrieved 16 April 2017.
- ^ "Population on 1st January by age and sex". Eurostat Commission. Archived from the original on 22 May 2017. Retrieved 14 June 2017.
- ^ "Densification in half of Sweden's urban areas". Archived from the original on 5 August 2020. Retrieved 9 August 2020.
- ^ "Roughly 87 percent of the population lives in localities and urban areas". Archived from the original on 9 August 2020. Retrieved 9 August 2020.
- ^ a b Statistiska tätorter 2018 Archived 9 September 2020 at the Wayback Machine page 33
- ISBN 978-0-9788460-6-0.
- ^ Aikio, Ante. "The Study of Saami Substrate Toponyms in Finland" (PDF). Archived (PDF) from the original on 11 November 2020. Retrieved 12 June 2020.
- ISBN 9780190231972.
- ^ "National minorities and minority languages". Government Offices of Sweden. Archived from the original (PDF) on 7 March 2021. Retrieved 26 June 2020.
- ^ "Summary of Population Statistics 1960–2019". Statistics Sweden. Archived from the original on 25 September 2020. Retrieved 25 September 2020.
- ^ "Statistics Sweden". Archived from the original on 6 July 2017. Retrieved 7 July 2017.
- ^ "World Factbook EUROPE : SWEDEN", The World Factbook, 12 July 2018, archived from the original on 18 January 2021, retrieved 24 January 2021
- ^ "Immigration and Ethnic Change in Low-Fertility Countries: A third Demographic Transition” Population and Development Review. 32:3. Quoted from page 416. https://web.archive.org/web/20210304211516/https://u.demog.berkeley.edu/~jrw/Biblio/Eprints/%20A-C/coleman.2006_PDR_3rd.DT.pdf)
- ^ Tarvainen, K. (2018). Population projections for Sweden, Norway, Denmark, and Finland, 2015–2065. Bulletin of Geography. Socioeconomic Series, 39(39), 147–160. Retrieved 29 April 2021 from https://web.archive.org/web/20201226134756/https://www.bulletinofgeography.umk.pl/39_2018/10_Tarvainen.pdf
- ^ Wirén, Arne. 6 September 2005. "Fattighjons-Sverige hotar” Metro. Page 6. Retrieved 29 April 2021 from https://web.archive.org/web/20051031033629/http://www.metro.se/content/acrobat/skane/SEMMA_20050929_A_Metro.pdf
- ^ a b c d e f g "Sveriges framtida befolkning, 2003–2020: Svensk och utländsk bakgrund" (PDF). Statistics Sweden (SCB) (in Swedish). May 2003. Archived (PDF) from the original on 19 May 2023.
- ^ a b c d "Number of persons with foreign or Swedish background (detailed division) by region, age and sex. Year 2002 – 2020". Statistikdatabasen. Archived from the original on 19 April 2020. Retrieved 21 December 2021.
- ^ "Population statistics – Population in Sweden by Country/Region of Birth, Citizenship and Swedish/Foreign background, 31 December 2020". Statistiska Centralbyrån. Archived from the original on 19 December 2016. Retrieved 21 December 2021.
- ^ "Population in Sweden by Country/Region of Birth, Citizenship and Swedish/Foreign background, 31 December 2022". Archived from the original on 25 March 2023. Retrieved 25 March 2023.
- ^ "Statistics Sweden". Scb.se. Archived from the original on 5 May 2017. Retrieved 16 December 2017.
- ^ Population by year, visited 13 september 2023
- ^ "Children per woman by country of birth 1970–2020 and projection 2021–2070". Archived from the original on 24 June 2021. Retrieved 24 June 2021.
- ^ "Children per woman by country of birth 1970–2022 and projection 2023–2070".
- ^ "Population statistics". Archived from the original on 17 September 2021. Retrieved 6 September 2021.
- ^ "UNSD — Demographic and Social Statistics". unstats.un.org. Retrieved 10 May 2023.
- ^ "United States – Selected Social Characteristics: 2006". United States Census Bureau. Archived from the original on 12 February 2020. Retrieved 21 March 2014.
- ^ "Ethnocultural Portrait of Canada Highlight Tables, 2006 Census". Statistics Canada. 2 April 2008. Archived from the original on 23 July 2013. Retrieved 30 June 2008.
- ^ "Number of persons by foreign/Swedish background, age, sex and year". Statistics Sweden. Retrieved 31 March 2017.[permanent dead link]
- ^ "Statistikdatabasen – välj tabell". Statistikdatabasen.scb.se. Archived from the original on 26 December 2017. Retrieved 16 December 2017.
- ^ "Visa detaljerad information". Scb.se. Archived from the original on 20 October 2017. Retrieved 16 December 2017.
- ^ "Får utrikes födda fler barn?". Statistiska Centralbyrån. Archived from the original on 14 September 2016. Retrieved 29 October 2016.
- ISBN 91-89609-30-1. Archived from the original (PDF) on 5 June 2007.)
{{cite book}}:|website=ignored (help - ^ Sweden: Restrictive Immigration Policy and Multiculturalism Archived 5 August 2010 at the Wayback Machine, Migration Policy Institute, 2006.
- ^ Vasileva, Katya (2011). "6.5% of the EU population are foreigners and 9.4% are born abroad" (PDF). Statistics in Focus (34). Eurostat. Archived from the original (PDF) on 28 January 2012.
- ^ "Statistikdatabasen – välj tabell". Ssd.scb.se. Archived from the original on 6 April 2011. Retrieved 16 December 2017.
- ^ "Population by country of birth, age and sex. Year 2000 – 2018". Statistikdatabasen. Archived from the original on 26 September 2019. Retrieved 15 September 2019.
- ^ "Assyrier/Syrianer – Vilka är de?" [Assyrians/Syriacs – Who are they?] (in Swedish). Ronnaskolan.sodertalje.se. Archived from the original on 8 February 2009.
- ISSN 1653-6894. Archived from the original(PDF) on 6 November 2006.
- ^ United Nations High Commissioner for Refugees (17 October 2012). "UNHCR | Refworld | The Situation of Roma in Selected Western European Countries". Archived from the original on 17 October 2012. Retrieved 16 January 2020.
- ^ a b "Immigration and emigration in the postwar period, Yugoslav immigration was substantial" (PDF). Statistics Sweden. 2004. p. 96. Archived (PDF) from the original on 20 October 2017. Retrieved 16 December 2017.
- ^ "Sweden tightens rules on Iraqi asylum seekers". reuters.com. 6 July 2007. Archived from the original on 1 January 2016. Retrieved 14 December 2010.
- ^ "Folkmängden efter födelseland, ålder och kön. År 2000 – 2021". Statistikdatabasen. Archived from the original on 11 October 2021. Retrieved 11 March 2022.
- ^ "Sweden". Ethnologue. 19 February 1999. Archived from the original on 4 May 2009. Retrieved 3 October 2013.
- ^ "Svenska kyrkans medlemsutveckling år 1972–2019" [Swedish church's membership development from 1972–2019] (PDF) (in Swedish). Church of Sweden. Archived (PDF) from the original on 29 November 2020. Retrieved 1 August 2020.
- ^ Wendy Sloane (4 October 1995). "Sweden Snaps Strong Ties Between Church and State". The Christian Science Monitor. Archived from the original on 20 October 2017. Retrieved 15 January 2016.
- ISBN 9781784536336.
- ^ "A portrait of modern Sweden in ten statistics". 15 January 2015.
- ^ Vichea, Pang (2 September 2016). "Rebooting lives at the Homeless World Cup".
- ^ Busch-Geertsema, Volker. "Defining and measuring homelessness." Homelessness Research in Europe: Festschrift for Bill Edgar and Joe Doherty (2010): 19-39.
- ^ Benjaminsen, Lars, and Evelyn Dyb. "The Effectiveness of Homeless Policies–Variations among the Scandinavian Countries." European Journal of Homelessness 2 (2008).
- ^ Löfstrand, Cecilia Hansen. "Reforming the work to combat long-term homelessness in Sweden." Acta Sociologica 53, no. 1 (2010): 19-34.
- ^ Healy, Karen, Tommy Lundström, and Marie Sallnäs. "A comparison of out-of-home care for children and young people in Australia and Sweden: Worlds apart?." Australian Social Work 64, no. 4 (2011): 416-431.
External links
- Statistics Sweden – Official Database available in English
| Europe |
|  |
|---|---|---|
| Americas | ||
| Asia |
| |
| Africa | ||
| Oceania | ||
| See also | ||