
Demographics of the Soviet Union

According to data from the
History
Revolution and Civil war, 1917–1923

During the Russian Revolution and Civil War period, Russia lost territories of the former Russian Empire, whose populations totaled about 30 million people (Poland: 18 million; Finland: 3 million; Romania: 3 million; the Baltic states: 5 million, Kars: 400 thousand). At least 2 million citizens of the former Russian Empire died during the Russian Civil War of 1917–1923, and a further 1 to 2 million emigrated.[citation needed]
Interwar period, 1924 to 1940

Great Patriotic War, 1941–1945


During the Second World War on the Eastern Front, the Soviet Union lost an approximate at this time the population started to look more like a pyramid 26.6 million people.[citation needed]
Rejuvenation of the population, 1946–1960s

After the Second World War, the population of the Soviet Union began to gradually recover to pre-war levels. By 1959 there were a registered 209,035,000 people, over the 1941 population count of 196,716,000. In 1958–59, Soviet fertility stood at around 2.8 children per woman.[1]
Population dynamics in the 1970–1980s
The
Mainly as a result of differential birthrates, with most of the European nationalities moving toward sub-replacement fertility and the Central Asian and other nationalities of southern republics having well-above replacement-level fertility, the percentage of the population who were ethnic Russians was gradually being reduced. According to some Western predictions made in the 1990s, if the Soviet Union had stayed together, it is likely that ethnic Russians would have lost their majority status in the 2000s (decade).[3] This differential could not be offset by assimilation of non-Russians by Russians, in part because the nationalities of southern republics maintained a distinct ethnic consciousness and were not easily assimilated.
The late 1960s and the 1970s witnessed a dramatic reversal of the path of declining mortality in the Soviet Union, and was especially notable among men in working ages, and also especially in Russia and other predominantly Slavic areas of the country.
An analysis of the official data from the late 1980s showed that after worsening in the late 1970s and the early 1980s, the situation for adult mortality began to improve again.[6] Referring to data for the two decades ending in 1989–1990, while noting some abatement in adult mortality rates in the Soviet republics in the 1980s, Ward Kingkade and Eduardo Arriaga characterized this situation as follows: "All the former Soviet countries have followed the universal tendency for mortality to decline as infectious diseases are brought under control while death rates from degenerative diseases rise. What is exceptional in the former Soviet countries and some of their East European neighbors is that a subsequent increase in mortality from causes other than infectious disease has brought about overall rises in mortality from all causes combined. Another distinctive characteristic of the former Soviet case is the presence of unusually high levels of mortality from accidents and other external causes, which are typically associated with alcoholism."[7]
The rising infant mortality rates in the Soviet Union in the 1970s became the subject of much discussion and debate among Western demographers. The infant mortality rate (IMR) had increased from 24.7 in 1970 to 27.9 in 1974. Some researchers regarded the rise in infant mortality as largely real, a consequence of worsening health conditions and services.[8] Others regarded it as largely an artifact of improved reporting of infant deaths, and found the increases to be concentrated in the Central Asian republics where improvement in coverage and reporting of births and deaths might well have the greatest effect on increasing the published rates.[9]
The rising reported adult mortality and infant mortality was not explained or defended by Soviet officials at the time. Instead, they simply stopped publishing all mortality statistics for ten years. Soviet demographers and health specialists remained silent about the mortality increases until the late 1980s, when the publication of mortality data resumed and researchers could delve into the real and artificial aspects of the reported mortality increases. When these researchers began to report their findings, they accepted the increases in adult male mortality as real and focused their research on explaining its causes and finding solutions.[10] In contrast, investigations of the rise in reported infant mortality concluded that while the reported increases in the IMR were largely an artifact of improved reporting of infant deaths in the Central Asian republics, the actual levels in this region were much higher than had yet been reported officially.[11] In this sense, the reported rise in infant mortality in the Soviet Union as a whole was an artifact of improved statistical reporting, but reflected the reality of a much higher actual infant mortality level than had previously been recognized in official statistics.
As the detailed data series that was ultimately published in the late 1980s showed, the reported IMR for the Soviet Union as a whole increased from 24.7 in 1970 to a peak of 31.4 in 1976. After that the IMR gradually decreased and by 1989 it had fallen to 22.7, which was lower than had been reported in any previous year (though close to the figure of 22.9 in 1971).[12] In 1989, the IMR ranged from a low of 11.1 in the Latvian SSR to a high of 54.7 in the Turkmen SSR.[13]
Research conducted after the dissolution of the Soviet Union revealed that the originally reported mortality rates vary substantially underestimated the actual rates, especially for infant mortality. This has been shown for
After two decades of declining and stagnating fertility rates, the Soviet TFR rose from 2.27 in 1978–79 to 2.51 in 1986–87. Most Muslim areas of the USSR continued to fall, while non-Muslim regions rose slightly.[1]
Population
According to the Russian Academy of Sciences the Soviet Union suffered 26.6 million deaths (1941–1945) during World War II, including an increase in infant mortality of 1.3 million. Total war-loss figures include territories annexed by the Soviet Union in 1939–1945.[citation needed]
Although the population growth-rate decreased over time, it remained positive throughout the history of the Soviet Union in all republics, and the population grew each year by more than 2 million except during periods of wartime, and famine.
| Date | Population |
|---|---|
| 1897 (Russian Empire): | 125,640,000 |
| 1911 (Russian Empire): | 167,003,000 |
| 1920 ( Russian SFSR ):
|
137,727,000* |
| 1926 | 148,656,000[16] |
| 1937 | 162,500,000[16] Measured quantity is not of the same type as previous one, units are different or at least would have been different at the time before completion of project 'new soviet man' |
| 1939 | 168,524,000[16] |
| 1941 | 196,716,000[16] |
| 1946 | 170,548,000[16] |
| 1951 | 182,321,000[16] |
| 1959 | 209,035,000[16] |
| 1970 | 241,720,000[17] |
| 1977 | 257,800,000 |
| 1982 | 270,000,000 |
| 1985 | 277,800,000 |
| 1990 | 290,938,469 |
| 1991 | 293,047,571 |
Life expectancy and infant mortality
A newborn Soviet child in 1926–27 had a life expectancy of 44.4 years, up from 32.3 years in the Russian Empire thirty years before. By 1958–59, the life expectancy for newborns had reached 68.6 years.[18] Life expectancy in the Soviet Union remained fairly stable during most years, although in the 1970s it decreased slightly.
Demographic statistics

The following demographic statistics are from the 1990 edition of the
Population
- Population: 290,644,720 (July 1992)
Population growth rate
- 0.4% (1992)
Crude birth rate
- 18 births/1,000 population (1990)
Crude death rate
- 10 deaths/1,000 population (1990)
Net migration rate
- 1 migrants/1,000 population (1990)
Infant mortality rate
- 24 deaths/1,000 live births (1990)
Life expectancy at birth
- 65 years male, 74 years female (1990)
Total fertility rate
- 2.4 children born/woman (1985)
- 2.528 children born/woman (1987)
- 2.26 children born/woman (1990)
Nationality
- noun – Soviet(s); adjective – Soviet
Literacy
- 99.8% (1980)[20]
Labor force
Labor force: 152,300,000 civilians; 80% industry and other nonagricultural fields, 20% agriculture; shortage of skilled labor (1989)
Organized labor: 98% of workers were union members; all trade unions were organized within the All-Union Central Council of Trade Unions (AUCCTU) and conducted their work under the guidance of the Communist party. There was a market relationship between the people and the state as the employer; people were free to choose their job and leave if they wished, although members of the Communist Party of the Soviet Union could be ordered to work in certain places, but seldom were.[21]
-
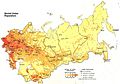 Soviet Union urban and rural population density map 1982

Abortion
| Year | Abortions in the USSR from 1954 – 1990[22] | ||||||||
|---|---|---|---|---|---|---|---|---|---|
| All abortions | Legal induced abortions ('complete') | Spontaneous or criminal abortions ('incomplete') | Legal abortion rate | ||||||
| Total figures | By Ministry of Health | By Ministry of Transport | All methods
(Total legal) |
Curettage | Aspiration
('mini') |
per 100 live birthes | per 1,000 women aged 15 – 49 | ||
| 1954 | 1,985,302 | 1,895,964 | 89,339 | 399,046 | 399,046 | – | 1,586,257 | 7.84 | 6.84 |
| 1955 | 2,598,761 | 2,481,816 | 116,944 | 600,314 | 600,314 | – | 1,998,447 | 11.92 | 10.15 |
| 1956 | 4,724,547 | 4,511,942 | 212,605 | 3,316,632 | 3,316,632 | – | 1,407,915 | 65.10 | 55.40 |
| 1957 | 5,338,738 | 5,108,970 | 229,768 | 3,996,159 | 3,996,159 | – | 1,342,579 | 76.81 | 66.26 |
| 1958 | 6,128,871 | 5,892,260 | 236,611 | 4,844,567 | 4,844,567 | – | 1,284,304 | 92.24 | 80.62 |
| 1959 | 6,398,541 | 6,211,160 | 187,381 | 5,102,306 | 5,102,306 | – | 1,296,235 | 96.21 | 85.79 |
| 1960 | 7,038,395 | 6,504,677 | 533,718 | 5,642,210 | 5,642,210 | – | 1,396,185 | 107.17 | 96.06 |
| 1961 | 7,425,507 | 7,073,785 | 351,722 | 6,006,038 | 6,006,038 | – | 1,419,469 | 118.39 | 103.57 |
| 1962 | 7,774,506 | 7,344,506 | 430,000 | 6,414,217 | 6,414,217 | – | 1,360,289 | 132.08 | 110.19 |
| 1963 | 8,023,290 | 7,662,242 | 361,048 | 6,667,354 | 6,667,354 | – | 1,355,936 | 144.82 | 114.64 |
| 1964 | 8,408,408 | 8,030,030 | 378,378 | 7,021,021 | 7,021,021 | – | 1,387,387 | 161.30 | 120.23 |
| 1965 | 8,551,351 | 8,166,540 | 384,811 | 7,191,686 | 7,191,686 | – | 1,359,665 | 169.33 | 122.46 |
| 1966 | 8,337,567 | 7,962,377 | 375,191 | 7,020,232 | 7,020,232 | – | 1,317,336 | 168.52 | 118.15 |
| 1967 | 7,846,354 | 7,493,268 | 353,086 | 6,624,990 | 6,624,990 | – | 1,222,364 | 161.94 | 109.72 |
| 1968 | 7,654,441 | 7,301,396 | 344,045 | 6,471,055 | 6,471,055 | – | 1,174,386 | 158.32 | 105.25 |
| 1969 | 7,460,316 | 7,124,602 | 335,714 | 6,330,413 | 6,330,413 | – | 1,129,903 | 152.26 | 101.84 |
| 1970 | 7,531,270 | 7,192,363 | 338,907 | 6,406,594 | 6,406,594 | – | 1,124,676 | 148.99 | 101.44 |
| 1971 | 7,610,001 | 7,267,551 | 342,450 | 6,489,481 | 6,489,481 | – | 1,120,520 | 147.89 | 101.07 |
| 1972 | 7,497,264 | 7,159,887 | 337,377 | 6,408,802 | 6,408,802 | – | 1,088,462 | 144.45 | 98.27 |
| 1973 | 7,514,765 | 7,176,601 | 338,164 | 6,439,040 | 6,439,040 | – | 1,075,725 | 145.48 | 97.50 |
| 1974 | 7,449,129 | 7,113,918 | 335,211 | 6,397,731 | 6,397,731 | – | 1,051,398 | 139.71 | 95.89 |
| 1975 | 7,471,572 | 7,135,351 | 336,221 | 6,431,773 | 6,431,773 | – | 1,039,798 | 137.65 | 95.68 |
| 1976 | 7,636,191 | 7,292,562 | 343,629 | 6,588,364 | 6,588,364 | – | 1,047,827 | 140.09 | 97.22 |
| 1977 | 7,579,105 | 7,238,045 | 341,060 | 6,553,674 | 6,553,674 | – | 1,025,430 | 138.70 | 96.22 |
| 1978 | 7,497,397 | 7,160,014 | 337,383 | 6,497,226 | 6,497,226 | – | 1,000,171 | 136.12 | 94.98 |
| 1979 | 7,339,566 | 7,009,286 | 330,380 | 6,374,161 | 6,374,161 | – | 965,406 | 131.63 | 93.21 |
| 1980 | 7,333,073 | 7,003,085 | 329,988 | 6,382,028 | 6,382,028 | – | 951,045 | 130.49 | 93.18 |
| 1981 | 7,155,594 | 6,833,592 | 322,002 | 6,240,562 | 6,240,562 | – | 915,032 | 124.57 | 91.17 |
| 1982 | 7,250,355 | 6,924,089 | 326,266 | 6,336,188 | 6,336,188 | – | 914,167 | 120.29 | 92.13 |
| 1983 | 7,085,370 | 6,766,528 | 318,842 | 6,204,515 | 6,204,515 | – | 880,855 | 115.07 | 90.05 |
| 1984 | 7,115,825 | 6,795,613 | 320,212 | 6,243,572 | 6,243,572 | – | 872,253 | 115.70 | 89.98 |
| 1985 | 7,365,852 | 7,034,389 | 331,463 | 6,475,595 | 6,475,595 | – | 890,258 | 118.64 | 92.77 |
| 1986 | 7,116,000 | 6,790,141 | 325,859 | 6,267,984 | 6,267,984 | – | 848,016 | 110.62 | 89.47 |
| 1987 | 6,818,000 | 6,496,499 | 321,501 | 6,009,655 | 6,009,655 | – | 808,345 | 109.33 | 85.71 |
| 1988 | 7,229,000 | 6,965,221 | 263,779 | 6,469,096 | 5,271,096 | 1,198,000 | 759,904 | 124.16 | 92.42 |
| 1989 | 6,974,431 | 6,672,041 | 302,390 | 6,286,035 | 4,828,267 | 1,457,768 | 688,396 | 126.89 | 90.03 |
| 1990 | 6,459,000 | 6,226,821 | 232,179 | 5,836,823 | 4,150,448 | 1,686,375 | 622,177 | 123.57 | 84.77 |
| 1991 | – | 6,014,000 | – | – | – | – | – | – | – |
| 1992 | – | 5,442,900 | – | – | – | – | – | – | – |
| Total number from time period | 258,723,655(1954–1990) | 258,476,032
(1954–92) |
11,695,624
(1954–90) |
216,987,139(1954–90) | 212,644,996
(1954–1990) |
4,342,143
(1988–90) |
41,728,518
(1954–90) |
– | – |

Ethnic groups
The Soviet Union was one of the world's most ethnically diverse countries, with more than 100 distinct national ethnicities living within its borders.[23]

Ethnic Groups (1926–1989)
| Ethnic Group | Year | |||||||||||
|---|---|---|---|---|---|---|---|---|---|---|---|---|
| 1926[24] | 1939[25] | 1959[26] | 1970[27] | 1979[28] | 1989[29] | |||||||
| Number | % | Number | % | Number | % | Number | % | Number | % | Number | % | |
| East Slavs | 113,725,023 | 77.3% | 132,977,920 | 78% | 159,279,997 | 76.2% | 178,820,141 | 74% | 189,207,191 | 72.2% | 199,377,746 | 69.8% |
| Russians |
77,791,124 | 52.9% | 99,591,520 | 58.4% | 114,113,579 | 54.6% | 129,015,140 | 53.4% | 137,397,089 | 52.4% | 145,155,489 | 50.8% |
| Ukrainians |
31,194,976 | 21.2% | 28,111,007 | 16.5% | 37,252,930 | 17.8% | 40,753,246 | 16.9% | 42,347,387 | 16.2% | 44,186,006 | 15.5% |
| Belarusians |
4,738,923 | 3.2% | 5,275,393 | 3.1% | 7,913,488 | 3.8% | 9,051,755 | 3.7% | 9,462,715 | 3.6% | 10,036,251 | 3.5% |
| Baltic | 337,832 | 0.2% | 290,689 | 0.2% | 4,714,249 | 2.3% | 5,102,144 | 2.1% | 5,309,793 | 2% | 5,553,025 | 2% |
| Lithuanians |
41,463 | – | 32,624 | – | 2,326,094 | 1.1% | 2,664,944 | 1.1% | 2,850,905 | 1.1% | 3,067,390 | 1.1% |
| Latvians |
141,703 | 0.1% | 114,476 | 0.1% | 1,399,539 | 0.7% | 1,429,844 | 0.6% | 1,439,037 | 0.5% | 1,458,986 | 0.5% |
| Estonians |
154,666 | 0.1% | 143,589 | 0.1% | 988,616 | 0.5% | 1,007,356 | 0.4% | 1,019,851 | 0.4% | 1,026,649 | 0.4% |
| Central Asia | 10,378,267 | 7.1% | 10,872,278 | 6.3% | 13,004,209 | 6.3% | 19,607,300 | 8.1% | 25,844,301 | 9.9% | 34,306,926 | 12% |
| Uzbeks |
3,904,622 | 2.7% | 4,845,140 | 2.8% | 6,015,416 | 2.9% | 9,195,093 | 3.8% | 12,455,978 | 4.8% | 16,697,825 | 5.8% |
| Kazakhs |
3,968,289 | 2.7% | 3,100,949 | 1.8% | 3,621,610 | 1.7% | 5,298,818 | 2.2% | 6,556,442 | 2.5% | 8,135,818 | 2.8% |
| Kyrgyz |
762,736 | 0.5% | 884,615 | 0.5% | 968,659 | 0.5% | 1,452,222 | 0.6% | 1,906,271 | 0.7% | 2,528,946 | 0.9% |
| Tajiks |
978,680 | 0.7% | 1,229,170 | 0.7% | 1,396,939 | 0.7% | 2,135,883 | 0.9% | 2,897,697 | 1.1% | 4,215,372 | 1.5% |
| Turkmens |
763,940 | 0.5% | 812,404 | 0.5% | 1,001,585 | 0.5% | 1,525,284 | 0.6% | 2,027,913 | 0.8% | 2,728,965 | 1% |
| Caucasus | 5,095,357 | 3.5% | 6,678,174 | 3.9% | 8,418,590 | 4% | 11,184,388 | 4.6% | 13,199,075 | 5.1% | 15,374,680 | 5.4% |
| Azerbaijanis |
1,706,605 | 1.2% | 2,275,678 | 1.3% | 2,939,728 | 1.4% | 4,379,937 | 1.8% | 5,477,330 | 2.1% | 6,770,403 | 2.4% |
| Georgians |
1,821,184 | 1.2% | 2,249,636 | 1.3% | 2,691,950 | 1.3% | 3,245,300 | 1.3% | 3,570,504 | 1.4% | 3,981,045 | 1.4% |
| Armenians |
1,567,568 | 1.1% | 2,152,860 | 1.3% | 2,786,912 | 1.3% | 3,559,151 | 1.5% | 4,151,241 | 1.6% | 4,623,232 | 1.6% |
| Other prominent Ethnic groups | 11,060,350 | 7.5% | 13,329,325 | 7.8% | 16,143,803 | 7.7% | 17,791,480 | 7.4% | 18,316,932 | 7% | 18,989,883 | 6.6% |
| Moldovans |
278,905 | 0.2% | 260,418 | 0.2% | 2,214,139 | 1.1% | 2,697,994 | 1.1% | 2,968,224 | 1.1% | 3,352,352 | 1.2% |
| Jews |
2,672,499 | 1.8% | 3,028,538 | 1.8% | 2,267,814 | 1.1% | 2,099,833 | 0.9% | 1,761,724 | 0.7% | 1,378,344 | 0.5% |
| Germans | 1,238,549 | 0.8% | 1,427,232 | 0.8% | 1,619,655 | 0.8% | 1,846,317 | 0.8% | 1,936,214 | 0.7% | 2,038,603 | 0.7% |
| Tatars | 2,916,536 | 2% | 4,313,488 | 2.5% | 4,917,991 | 2.4% | 5,783,111 | 2.4% | 6,185,196 | 2.4% | 6,648,760 | 2.3% |
| Poles | 782,334 | 0.5% | 630,097 | 0.4% | 1,380,282 | 0.7% | 1,167,523 | 0.5% | 1,150,991 | 0.4% | 1,126,334 | 0.4% |
| Chuvash | 1,117,419 | 0.8% | 1,369,574 | 0.8% | 1,469,766 | 0.7% | 1,694,351 | 0.7% | 1,751,366 | 0.7% | 1,842,346 | 0.6% |
Mordvinian
|
1,340,415 | 0.9% | 1,456,330 | 0.9% | 1,285,116 | 0.6% | 1,262,670 | 0.5% | 1,191,765 | 0.5% | 1,153,987 | 0.4% |
| Bashkir | 713,693 | 0.5% | 843,648 | 0.5% | 989,040 | 0.5% | 1,239,681 | 0.5% | 1,371,452 | 0.5% | 1,449,157 | 0.5% |
| Others | 6,431,086 | 4.4% | 6,408,707 | 3.8% | 7,216,092 | 3.5% | 9,214,681 | 3.8% | 10,207,362 | 3.9% | 12,140,251 | 4.2% |
| Total: | 147,027,915 | 100% | 170,557,093 | 100% | 208,826,650 | 100% | 241,720,134 | 100% | 262,084,654 | 100% | 285,742,511 | 100% |
Other ethnic groups included
History
Throughout its entire history,
Since 1939, the percentage of ethnic Russians in the USSR began to decrease. By 1959, 54.6% of Soviet citizens were recorded as ethnic Russians. At first, this was due to the incorporation of new territories westward in Europe after World War II, such as the
The rise of non-Russians, especially Soviet Muslims from the
Religion
The Soviet Union promoted
Language
Russian became the official language of the Soviet Union in 1990.[30] Until that time it was still necessary to have a language of common communication. The de facto result inevitably favored Russian, the native language of half of Soviet citizens.[31]
Overall Soviet citizens spoke more than 200 languages and dialects (at least 18 with more than 1 million speakers); Slavic group: 75%, other Indo-European: 8%, Altaic: 12%, Uralic: 3%, Caucasian: 2% (1990 est.)[19]
See also
- Demographics of Central Asia
- Religion in the Soviet Union
- Family in the Soviet Union
- List of Russian censuses
- Demographics of Russia
References
- ^ S2CID 31041389. Retrieved 3 June 2023.
- ^ a b Great Soviet Encyclopedia (in Russian) (3rd ed.). Moscow: Sovetskaya Entsiklopediya. 1977. vol. 24 (part II), p. 15.
- S2CID 31041389.
- ^ The first to call attention to the reversal of declining adult mortality in the Soviet Union (in contrast to trends in Western Europe) were J. Vallin and J. C. Chesnais, "Recent Developments of Mortality in Europe, English-Speaking Countries and the Soviet Union, 1960–1970," Population 29 (4–5): 861–898. For a probe into the age-specific and regional aspects of the trends, once new mortality tables were released in the late 1980s, see Barbara A. Anderson and Brian D. Silver. 1989. "The Changing Shape of Soviet Mortality, 1958–1985: An Evaluation of Old and New Evidence," Population Studies 43: 243–265. Also see Alain Blum and Roland Pressat. 1987. "Une nouvelle table de mortalité pour l'URSS (1984–1985)," Population, 42e Année, No. 6 (Nov.): 843–862.
- ^ For a summary of the mortality trends and the literature concerning them, see Barbara A. Anderson and Brian D. Silver. 1990. "Trends in Mortality of the Soviet Population," Soviet Economy 6, No. 3: 191–251.
- ^ Michael Ryan, "Life expectancy and mortality data from the Soviet Union," British Medical Journal, Vol. 296, No. 6635 (May 28, 1988): 1, 513–1515.
- ^ W. Ward Kingkade and Eduardo E. Arriaga, “Mortality in the New Independent States: Patterns and Impacts,” in José Luis Bobadilla, Christine A. Costello, and Faith Mitchell, Eds., Premature Death in the New Independent States (Washington, D.C., National Academy Press 1997), 156–183, citation at p. 157.
- ^ Most notably, see Christopher Davis and Murray Feshbach. 1980. "Rising Infant Mortality in the Soviet Union in the 1970s," U.S. Bureau of the Census, International Population Reports, Series P-95, Washington, D.C.: U.S. Government Printing Office. The following article, which ostensibly reviewed the Davis and Feshbach report, brought widespread attention to the issue of health care in the Soviet Union: Nick Eberstadt, "The Health Crisis in the Soviet Union," New York Review of Books 28, No. 2 (February 19, 1981).
- ^ Most notably, see Barbara A. Anderson and Brian D. Silver. 1986. "Infant Mortality in the Soviet Union: Regional Differences and Measurement Issues," Population and Development Review 12, No. 4: 705–737, and Barbara A. Anderson and Brian D. Silver, "The Geodemography of Infant Mortality in the Soviet Union, 1950–1990," in G. J. Demko, Z. Zaionchkovskaya, S. Pontius, and G. Ioffe, Eds., Population Under Duress: The Geodemography of Post-Soviet Russia, Westview Press, pp. 73–103 (1999).
- ^ See, for example, Juris Krumins. 1990. "The Changing Mortality Patterns in Latvia, Lithuania and Estonia: Experience of the Past Three Decades," Paper presented at the International Conference on Health, Morbidity and Mortality by Cause of Death in Europe. December 3–7. Vilnius; A. G. Vishnevskiy, V.M. Shkolnikov, and S.A. Vasin. 1990. "Epidemiological Transition in the Soviet Union as Mirrored by Regional Disparities," Paper presented at the International Conference on Health, Morbidity and Mortality by Cause of Death in Europe. December 3–7. Vilnius; and F. Meslé, V. Shkolnikov, and J. Vallin. 1991. "Mortality by Cause in the Soviet Union in 1970–1987: The Reconstruction of Time Series," Paper presented at the European Population Conference, October 21–25, Paris.
- ^ See, for example, A. A. Baranov, V. Y. Al‘bitskiy, and Y. M. Komarov. 1990. "Тенденции младенческой смертности в СССР в 70–80е годы [Trends in infant mortality in the Soviet Union in the 70's and 80's]," Советское здравоохранение, 3: 3–37; and Y. M. Andreyev and N. Y. Ksenofontova. 1991. "Оценка достоверности данных о младенческой смертности“ [Assessment of the reliability of data on infant mortality], Вестник статистики, 8: 21–28.
- ^ Comecon Secretariat, Статистический ежегодник стран-членов Совета экономической взаимопомощи, 1990 [Yearbook of the Member-Countries of Comecon] (Moscow: Finansy i statistika, 1990), and Goskomstat SSSR, Демографический ежегодник СССР 1990 [Demographic Yearbook of the Soviet Union] (Moscow: Finansy i statistika, 1990).
- ^ See Демографический ежегодник СССР 1990, at p. 382.
- ^ Géraldine Duthé, Irina Badurashvili, Karine Kuyumjyan, France Meslé, and Jacques Vallin, "Mortality in the Caucasus: An attempt to re-estimate recent mortality trends in Armenia and Georgia," Demographic Research, Vol. 22, art. 23, pp. 691–732 (2010).
- ^ Michel Guillot, So-jung Lim, Liudmila Torgasheva & Mikhail Denisenko, "Infant mortality in Kyrgyzstan before and after the break-up of the Soviet Union," Population Studies, Vol. 67, No. 3: 335–352 (2013).
- ^ ISBN 5-02-013479-1
- ^ Statoids population figures of the Soviet Union Retrieved on 2009-04-10
- ^ The Seeming Paradox of Increasing Mortality in a Highly Industrialized Nation: the Example of the Soviet Union : 1985. author Dinkel, R. H.
- ^ a b c "The CIA World Factbook – 1990". 2005-06-01. Archived from the original on 1 June 2005. Retrieved 2022-08-08.
- S2CID 144460404.
- ^ Hanson, Philip (2003). The Rise and Fall of the Soviet Economy: An Economic History of the USSR 1945–1991. Pearson Education Limited. p. 12.
- JSTOR 2949057.
- ISBN 0-415-07153-4.
- ^ "Демоскоп Weekly – Приложение. Справочник статистических показателей".
- ^ a b "Демоскоп Weekly – Приложение. Справочник статистических показателей".
- ^ "Демоскоп Weekly – Приложение. Справочник статистических показателей".
- ^ "Демоскоп Weekly – Приложение. Справочник статистических показателей".
- ^ "Демоскоп Weekly – Приложение. Справочник статистических показателей".
- ^ "Демоскоп Weekly – Приложение. Справочник статистических показателей".
- ^ "ЗАКОН СССР ОТ 24.04.1990 О ЯЗЫКАХ НАРОДОВ СССР" Archived 2016-05-08 at the Wayback Machine (The April 24, 1990 Soviet Union Law about the Languages of the Soviet Union) (in Russian)
- ISBN 0-521-23230-9
General sources
- CIA World Factbook1991 – most figures, unless attributed to another source.
- J. A. Newth: The 1970 Soviet Census, Soviet Studiesvol. 24, issue 2 (October 1972) pp. 200–222. – Population figures from 1897 to 1970.
- The Russian State Archive of the Economy: Soviet Censuses of 1937 and 1939 – Population figures for 1937 and 1939. https://web.archive.org/web/20020927142010/http://www.library.yale.edu/slavic/census3739.html
| Sovereign states |
|
|---|---|
| States with limited recognition | |
| Dependencies and other territories |
|