
Dvorak technique

The Dvorak technique (developed between 1969 and 1984 by Vernon Dvorak) is a widely used system to estimate tropical cyclone intensity (which includes tropical depression, tropical storm, and hurricane/typhoon/intense tropical cyclone intensities) based solely on visible and infrared satellite images. Within the Dvorak satellite strength estimate for tropical cyclones, there are several visual patterns that a cyclone may take on which define the upper and lower bounds on its intensity. The primary patterns used are curved band pattern (T1.0-T4.5), shear pattern (T1.5–T3.5), central dense overcast (CDO) pattern (T2.5–T5.0), central cold cover (CCC) pattern, banding eye pattern (T4.0–T4.5), and eye pattern (T4.5–T8.0).
Both the central dense overcast and embedded eye pattern use the size of the CDO. The CDO pattern intensities start at T2.5, equivalent to minimal tropical storm intensity (40 mph, 65 km/h). The shape of the central dense overcast is also considered. The eye pattern utilizes the coldness of the cloud tops within the surrounding mass of thunderstorms and contrasts it with the temperature within the eye itself. The larger the temperature difference is, the stronger the tropical cyclone. Once a pattern is identified, the storm features (such as length and curvature of banding features) are further analyzed to arrive at a particular T-number. The CCC pattern indicates little development is occurring, despite the cold cloud tops associated with the quickly evolving feature.
Several agencies issue Dvorak intensity numbers for tropical cyclones and their precursors, including the
Evolution of the method

The initial development of this technique occurred in 1969 by Vernon Dvorak, using satellite pictures of tropical cyclones within the northwest Pacific Ocean. The system as it was initially conceived involved pattern matching of cloud features with a development and decay model. As the technique matured through the 1970s and 1980s, measurement of cloud features became dominant in defining tropical cyclone intensity and central pressure of the tropical cyclone's low-pressure area. Use of infrared satellite imagery led to a more objective assessment of the strength of tropical cyclones with eyes, using the cloud top temperatures within the eyewall and contrasting them with the warm temperatures within the eye itself. Constraints on short term intensity change are used less frequently than they were back in the 1970s and 1980s. The central pressures assigned to tropical cyclones have required modification, as the original estimates were 5–10 hPa (0.15–0.29 inHg) too low in the Atlantic and up to 20 hPa (0.59 inHg) too high in the northwest Pacific. This led to the development of a separate wind-pressure relationship for the northwest Pacific, devised by Atkinson and Holliday in 1975, then modified in 1977.[1]
As human analysts using the technique lead to subjective biases, efforts have been made to make more objective estimates using computer programs, which have been aided by higher-resolution satellite imagery and more powerful computers. Since tropical cyclone satellite patterns can fluctuate over time, automated techniques use a six-hour averaging period to lead to more reliable intensity estimates. Development of the objective Dvorak technique began in 1998, which performed best with tropical cyclones that had eyes (of hurricane or typhoon strength). It still required a manual center placement, keeping some subjectivity within the process. By 2004, an advanced objective Dvorak technique was developed which utilized banding features for systems below hurricane intensity and to objectively determine the tropical cyclone's center. A central pressure bias was uncovered in 2004 relating to the slope of the tropopause and cloud top temperatures which change with latitude that helped improve central pressure estimates within the objective technique.[1]
Details of the method
| T-Number | 1-min Winds | Category ( SSHWS )
|
Min. Pressure (millibars) | |||
|---|---|---|---|---|---|---|
| (knots) | (mph) | (km/h) | Atlantic | NW Pacific | ||
| 1.0 – 1.5 | 25 | 29 | 45 | below TD | ---- | ---- |
| 2.0 | 30 | 35 | 55 | TD | 1009 | 1000 |
| 2.5 | 35 | 40 | 65 | TS | 1005 | 998 |
| 3.0 | 45 | 52 | 83 | TS | 1000 | 991 |
| 3.5 | 55 | 63 | 102 | TS-Cat 1 | 994 | 984 |
| 4.0 | 65 | 75 | 120 | Cat 1 | 987 | 976 |
| 4.5 | 77 | 89 | 143 | Cat 1–Cat 2 | 979 | 966 |
| 5.0 | 90 | 104 | 167 | Cat 2–Cat 3 | 970 | 954 |
| 5.5 | 102 | 117 | 189 | Cat 3 | 960 | 941 |
| 6.0 | 115 | 132 | 213 | Cat 4 | 948 | 927 |
| 6.5 | 127 | 146 | 235 | Cat 4 | 935 | 915 |
| 7.0 | 140 | 161 | 260 | Cat 5 | 921 | 898 |
| 7.5 | 155 | 178 | 287 | Cat 5 | 906 | 879 |
| 8.0 | 170 | 196 | 315 | Cat 5 | 890 | 858 |
| 8.5† | 185 | 213 | 343 | Cat 5 | 873 | 841 |
| Note: The pressures shown for the NW Pacific basin are lower as the pressure of the entire basin are relatively lower than that of the Atlantic basin.[3] †Values of 8.1–8.5 are only assigned by the CIMSS and NOAA automated advanced Dvorak systems and not used in subjective analyses.[4] | ||||||

In a developing cyclone, the technique takes advantage of the fact that cyclones of similar intensity tend to have certain characteristic features, and as they strengthen, they tend to change in appearance in a predictable manner. The structure and organization of the tropical cyclone are tracked over 24 hours to determine if the storm has weakened, maintained its intensity, or strengthened. Various central cloud and banding features are compared with templates that show typical storm patterns and their associated intensity.[5] If infrared satellite imagery is available for a cyclone with a visible eye pattern, then the technique utilizes the difference between the temperature of the warm eye and the surrounding cold cloud tops to determine intensity (colder cloud tops generally indicate a more intense storm). In each case a "T-number" (an abbreviation for Tropical Number) and a Current Intensity (CI) value are assigned to the storm. These measurements range between 1 (minimum intensity) and 8 (maximum intensity).[3] The T-number and CI value are the same except for weakening storms, in which case the CI is higher.[6][7] For weakening systems, the CI is held as the tropical cyclone intensity for 12 hours, though research from the National Hurricane Center indicates that six hours is more reasonable.[8] The table at right shows the approximate surface wind speed and sea level pressure that corresponds to a given T-number.[9] The amount a tropical cyclone can change in strength per 24-hour period is limited to 2.5 T-numbers per day.[1]
Pattern types
Within the Dvorak satellite strength estimate for tropical cyclones, there are several visual patterns that a cyclone may take on which define the upper and lower bounds on its intensity. The primary patterns used are curved band pattern (T1.0-T4.5), shear pattern (T1.5-T3.5), central dense overcast (CDO) pattern (T2.5-T5.0), banding eye pattern (T4.0-T4.5), eye pattern (T4.5 – T8.0), and central cold cover (CCC) pattern.[10] Both the central dense overcast and embedded eye pattern utilize the size of the CDO. The CDO pattern intensities start at T2.5, equivalent to minimal tropical storm intensity (40 miles per hour (64 km/h)). The shape of the central dense overcast is also considered. The farther the center is tucked into the CDO, the stronger it is deemed.[11] Tropical cyclones with maximum sustained winds between 65 miles per hour (105 km/h) and 100 miles per hour (160 km/h) can have their center of circulations obscured by cloudiness of the central dense overcast within visible and infrared satellite imagery, which makes diagnosis of their intensity a challenge.[12]
The CCC pattern, with its large and quickly developing mass of thick cirrus clouds spreading out from an area of convection near a tropical cyclone center within a short time frame, indicates little development. When it develops, rainbands and cloud lines around the tropical cyclone weaken and the thick cloud shield obscures the circulation center. While it resembles a CDO pattern, it is rarely seen.[10]
The eye pattern utilizes the coldness of the cloud tops within the surrounding mass of thunderstorms and contrasts it with the temperature within the eye itself. The larger the temperature difference is, the stronger the tropical cyclone.[11] Winds within tropical cyclones can also be estimated by tracking features within the CDO using rapid scan geostationary satellite imagery, whose pictures are taken minutes apart rather than every half-hour.[13]
Once a pattern is identified, the storm features (such as length and curvature of banding features) are further analyzed to arrive at a particular T-number.[14]
Usage
Several agencies issue Dvorak intensity numbers for tropical cyclones and their precursors. These include the National Hurricane Center's Tropical Analysis and Forecast Branch (TAFB), the National Oceanic and Atmospheric Administration's Satellite Analysis Branch (SAB), and the Joint Typhoon Warning Center at the Naval Pacific Meteorology and Oceanography Center in Pearl Harbor, Hawaii.[9]
The National Hurricane Center will often quote Dvorak T-numbers in their tropical cyclone products. The following example is from discussion number 3 of Tropical Depression 24 (eventually Hurricane Wilma) of the 2005 Atlantic hurricane season:[15]
BOTH TAFB AND SAB CAME IN WITH A DVORAK SATELLITE INTENSITY ESTIMATE OF T2.5/35 KT. HOWEVER ...OFTENTIMES THE SURFACE WIND FIELD OF LARGE DEVELOPING LOW PRESSURE SYSTEMS LIKE THIS ONE WILL LAG ABOUT 12 HOURS BEHIND THE SATELLITE SIGNATURE. THEREFORE... THE INITIAL INTENSITY HAS ONLY BEEN INCREASED TO 30 KT.
Note that in this case the Dvorak T-number (in this case T2.5) was simply used as a guide but other factors determined how the NHC decided to set the system's intensity.
The
- Satellite Images of Selected Tropical Storms and hurricanes with Associated T-Number
-
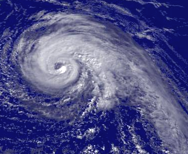
 Tropical Storm Wilma at T3.0
 -
 Tropical Storm Dennis at T4.0
 -
 Hurricane Jeanne at T5.0
 -
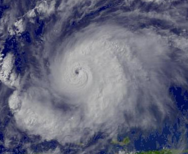 Hurricane Emily at T6.0


Benefits and disadvantages
The most significant benefit of the use of the technique is that it has provided a more complete history of tropical cyclone intensity in areas where aircraft reconnaissance is neither possible nor routinely available. Intensity estimates of
See also
Other tools used to determine tropical cyclone intensity:
- Quikscat
- TRMM
References
- ^ S2CID 15193271. Retrieved 2012-09-26.
- ^ Satellite and Information Service Division (April 17, 2005). "Dvorak Current Intensity Chart". National Oceanic and Atmospheric Administration. Retrieved 2006-06-12.
- ^ a b Landsea, Chris (2006). "Subject: H1) What is the Dvorak technique and how is it used?". Hurricane Research Division. Retrieved 2012-09-09.
- ^ Timothy L. Olander; Christopher S. Velden (February 2015). ADT – Advanced Dvorak Technique Users' Guide (McIDAS Version 8.2.1) (PDF). Cooperative Institute for Meteorological Satellite Studies (Report). University of Wisconsin–Madison. p. 49. Retrieved October 29, 2015.
- ^ Naval Research Laboratory. "Tropical Cyclone Forecasters Reference Guide". United States Navy. Archived from the original on 2006-08-11. Retrieved 2006-05-29.
- ^ Leffler, J.W. "T-Number Curve Comparison between JTWC and JMA". Archived from the original on 2006-07-25.
- ^ National Oceanic and Atmospheric Administration Satellite and Information Service (2011-08-26). "The Dvorak Technique Explained". National Oceanic and Atmospheric Administration. Retrieved 2006-05-29.
- ^ a b Burton, Andrew; Christopher Velden (2011-04-16). "Proceedings of the International Workshop on Satellite Analysis of Tropical Cyclones Report No. TCP-52" (PDF). World Meteorological Organization. pp. 3–4. Retrieved 2012-11-23.
- ^ S2CID 913230. Retrieved 2012-09-09.
- ^ .
- ^ a b Dvorak, Vernon F. (February 1973). "A Technique For the Analysis and Forecasting of Tropical Cyclone Intensities From Satellite Pictures". National Oceanic and Atmospheric Administration: 5–8.
{{cite journal}}: Cite journal requires|journal=(help) - ^ Wimmers, Anthony; Chistopher Velden (2012). "Advances in Objective Tropical Cyclone Center Fixing Using Multispectral Satellite Imagery". American Meteorological Society. Retrieved 2012-08-12.
- hdl:2060/19790002501.
- ^ De Maria, Mark (1999-04-19). "Satellite Application is Tropical Weather Forecasting". Archived from the original on 2006-08-13. Retrieved 2006-05-29.
- ^ Stewart, Stacy (2005-10-16). "NHC Tropical Depression 24 Discussion Number 3". National Hurricane Center. Retrieved 2006-05-29.
- ^ "Cyclone Center". www.cyclonecenter.org. Retrieved 2015-08-05.
External links
- Agencies issuing Dvorak intensity estimates
- Joint Typhoon Warning Center Archived 2010-03-01 at the Wayback Machine
- UW–CIMSS (Advanced Dvorak Technique)
- NOAA/NESDIS Satellite Analysis Branch
- About the TAFB
- Other
- Tropical Cyclone Intensity Analysis and Forecasting from Satellite Imagery Dvorak, 1974. (PDF, 1.3 MB)
- Dvorak Tropical Cyclone Wind Speed Biases Determined from Reconnaissance-based "Best Track" Data (1997–2003) Franklin and Brown
- The Dvorak Technique Through Time[permanent dead link] Dr. Jack Beven. (WRF File. Requires WebEx player)