
Economy of South America
This article's lead section may be too short to adequately summarize the key points. (February 2024) |
It has been suggested that Latin American economy be merged into this article. (Discuss) Proposed since February 2024. |
 The Greater São Paulo has the largest gross metropolitan product in South America. | |
| Statistics | |
|---|---|
| Population | 434 million[1][2] |
| GDP | |
| GDP rank | |
GDP growth | 1.6% (2023 est.)[5] |
GDP per capita | |
GDP per capita rank | |
Millionaires (US$) | 915,000 (2022)[8] |
| Public finances | |
| 75.1% of GDP (2023 est.)[9] | |
| Most numbers are from the International Monetary Fund. IMF South America Datasets All values, unless otherwise stated, are in US dollars. | |
| World economy |
|---|
The economy of South America comprises approximately 434 million people living in the 12 sovereign states and three dependent territories of South America, which encompasses 6 percent of the world's population. South America ranks fifth[10] in terms of nominal GDP by continent, behind North America and after Oceania.
South America has two major trade blocks: Mercosur and the Andean Community. Brazil is the largest economy in South America in terms of Nominal GDP, it has a vast and diverse economic landscape encompassing agriculture, manufacturing, services, and natural resources. Due to Brazil's major economy, it has a large influence over its neighbors, and even globally. Argentina which is South America's second largest economy, boasts a rich history of industrialization and a well-developed agricultural sector. Despite economic challenges and very high inflation, Argentina uses its abundant natural resources and skilled workforce to drive economic growth and innovation. Together, Brazil and Argentina serve as economic powerhouses and as such, are major influences to surrounding countries. Uruguay stands out as it boasts the highest GDP per capita in the region. Renowned for its stable political environment, strong social welfare system, and diversified economy, Uruguay has consistently ranked among the top nations in terms of human development and standard of living. Uruguay has a large agriculture sector and has made previous strategic investments in technology and innovation, Uruguay's economy thrives on both domestic consumption and international trade. Guyana ranks second which is attributed to its oil and gas sector.[11]
History
20th century
From the 1930s to the 1980s, countries in South America used import substitution, an economic policy that replaces foreign businesses as well as imports with domestic production. This was a policy made to increase domestic manufacturing. Furthermore, national spending on arms soared during periods of military rule. Increasingly, South American countries began to borrow from foreign private banks and international lending institutions, such as the World Bank and the Inter-American Development Bank, to fund existing programs while also trying to expand their economic productivity through investments. However, this policy created a debt crisis in South America.[12]
The continent has fallen further behind North America over the past two centuries. This can be explained by South America's high concentration on primary commodities as well as the state of the educational system and institutional structure, some of which are still related to its colonial past, others to recent political developments.[13]
From the 1990s on, countries in South America switched over to the
.21st century
In 2016, four countries, which include Brazil, Ecuador, Argentina, and Venezuela, experienced a decline in output. Other countries in the region were observing a slowdown in growth rates.[14] Brazil saw this decline in output due to increasing unemployment levels, worsening financial conditions, and political issues, which, in turn, led to a decrease in private domestic consumption and investment.[14] Argentina also experienced a recession in private consumption and investment; however, it was because of the removal of public service subsidies due to a short-term rise in inflation. In contrast, Peru differed from other countries in the region, demonstrating an increase in growth rates thanks to copper production.
In 2017, the economy started to recover for the first time since 2014. The main contributor to economic growth is private consumption.
In 2017,
By country
| Country | GDP (nominal) $bn 2023 [16] |
GDP (PPP) $bn 2023 [16][17] |
GDP per capita $,000 2023 [16] |
Merchandise exports $bn 2022 [18] |
Human Development Index 2021 [19] |
% with less than $2.15 per day 2021 [20] |
|---|---|---|---|---|---|---|
| Argentina | 622 | 1,240 | 27 | 103 | 0.84 | 1 |
| Bolivia | 47 | 125 | 10 | 15 | 0.69 | 2 |
| Brazil | 2,130 | 4,100 | 20 | 380 | 0.75 | 6 |
| Chile | 344 | 600 | 30 | 107 | 0.86 | 0.7 |
| Colombia | 364 | 1,000 | 19 | 72 | 0.75 | 7 |
| Ecuador | 120 | 243 | 13 | 36 | 0.74 | 3 |
| Falkland Islands[21] | 0.2 | 71 | ||||
| French Guiana[22] | 5 | 20 | ||||
| Guyana | 16 | 49 | 61 | 5 | 0.71 | |
| Paraguay | 44 | 117 | 16 | 15 | 0.72 | 1.3 |
| Peru | 265 | 550 | 16 | 71 | 0.76 | 3 |
| Suriname | 3.5 | 11 | 18 | 3 | 0.73 | |
| Uruguay | 76 | 103 | 29 | 23 | 0.81 | 0.1 |
| Venezuela | 92 | 21 | 8 | 23 | 0.69 | |
| Total | 4,100 | 8,200 | 19 | 850 |
Economy of:
Economic sectors
Agriculture


_REFON_1.JPG)
Throughout history, since the
As one of the most important contributors of the world's agricultural market,
Other exports from the
In the
The four countries with the strongest agriculture are Brazil, Argentina, Chile and Colombia. Currently:
- Brazil is the world's largest producer of ;
- Argentina is the world's largest producer of ;
- Chile is one of the 5 largest world producers of cherry and cranberry, and one of the 10 largest world producers of grape, apple, kiwi, peach, plum and hazelnut, focusing on exporting high-value fruits;
- Colombia is one of the 5 largest producers in the world of coffee, avocado and palm oil, and one of the 10 largest producers in the world of sugarcane, banana, pineapple and cocoa;
- Peru is the world's largest producer of quinoa; is one of the 5 largest producers of avocado, blueberry, artichoke and asparagus; one of the 10 largest producers in the world of coffee and cocoa; one of the 15 largest producers in the world of potato and pineapple, and also has a considerable production of grape, sugarcane, rice, banana, maize and cassava; its agriculture is considerably diversified;
Animal husbandry

In 2018, Argentina was the 4th largest producer of beef in the world, with a production of 3 million tons (behind only USA, Brazil and China). Uruguay is also a major meat producer. In 2018, it produced 589 thousand tons of beef.[35]
In
Industry


The World Bank annually lists the top manufacturing countries by total manufacturing value. According to the 2019 list, Brazil has the thirteenth most valuable industry in the world (US$173.6 billion), Venezuela the thirtieth largest (US$58.2 billion, however, it depends on oil to obtain this value), Argentina the 31st largest (US$57.7 billion), Colombia the 46th largest (US$35.4 billion), Peru the 50th largest (US$28.7 billion) and Chile the 51st largest (US$28.3 billion).[37]
80% of the manufacturing of the Latin America region falls on Argentina, Brazil and Mexico.[38]
In 2019, Argentina was the 31st world producer of steel, the 28th producer of vehicles, the 22nd world producer of beer, the 4th world producer of soybean oil and the 3rd world producer of sunflower oil, among other industrial products.[56][57][58][59]
Mining


Mining is one of the most important economic sectors in South America, especially for Chile, Peru and Bolivia, whose economies are highly dependent on this sector. The continent has large productions of gold (mainly in Peru, Brazil and Argentina);[60] silver (mainly in Peru, Chile, Bolivia and Argentina);[61] copper (mainly in Chile, Peru and Brazil);[62] iron ore (Brazil, Peru and Chile);[63] zinc (Peru, Bolivia and Brazil);[64] molybdenum (Chile and Peru);[65] lithium (Chile, Argentina and Brazil);[66] lead (Peru and Bolivia);[67] bauxite (Brazil);[68] tin (Peru, Bolivia and Brazil);[69] manganese (Brazil);[70] antimony (Bolivia and Ecuador);[71] nickel (Brazil);[72] niobium (Brazil);[73] rhenium (Chile);[74] iodine (Chile),[75] among others.
Chile contributes about a third of the world copper production.[82] In addition to copper, Chile was, in 2019, the world's largest producer of iodine[83] and rhenium,[84] the second largest producer of lithium[85] and molybdenum,[65] the sixth largest producer of silver,[86] the seventh largest producer of salt,[87] the eighth largest producer of potash,[88] the thirteenth producer of sulfur[89] and the thirteenth producer of iron ore[90] in the world.
In 2019, Peru was the 2nd largest world producer of copper[91] and silver,[86] 8th largest world producer of gold,[92] 3rd largest world producer of lead,[67] 2nd largest world producer of zinc,[93] 4th largest world producer of tin,[94] 5th largest world producer of boron[95] and 4th largest world producer of molybdenum.[65]
In 2019, Bolivia was the 8th largest world producer of silver;[86] 4th largest world producer of boron;[95] 5th largest world producer of antimony;[96] 5th largest world producer of tin;[94] 6th largest world producer of tungsten;[97] 7th largest producer of zinc,[98] and the 8th largest producer of lead.[67][99][100]
In 2019, Argentina was the 4th largest world producer of lithium,[85] the 9th largest world producer of silver,[86] the 17th largest world producer of gold[92] and the 7th largest world producer of boron.[95]
Oil and gas

In the production of oil, Brazil was the 10th largest oil producer in the world in 2019, with 2.8 million barrels / day. Venezuela was the 21st largest, with 877 thousand barrels / day, Colombia in 22nd with 886 thousand barrels / day, Ecuador in 28th with 531 thousand barrels / day and Argentina 29th with 507 thousand barrels / day. As Venezuela and Ecuador consume little oil and export most of their production, they are part of OPEC. Venezuela had a big drop in production after 2015 (where it produced 2.5 million barrels / day), falling in 2016 to 2.2 million, in 2017 to 2 million, in 2018 to 1.4 million and in 2019 to 877 thousand, due to lack of investments.[105]
In the production of natural gas, in 2018, Argentina produced 1524 bcf (billion cubic feet), Venezuela 946, Brazil 877, Bolivia 617, Peru 451, Colombia 379.[106]
In the beginning of 2020, in the production of
Tourism

In the list of world tourist destinations, in 2018, Argentina was the 47th most visited country, with 6.9 million international tourists (and revenues of US$5.5 billion); Brazil was the 48th most visited with 6.6 million tourists (and revenues of US$5.9 billion); Chile in position 53 with 5.7 million tourists (and revenues of US$2.9 billion); Peru in position 60 with 4.4 million tourists (and income of US$3.9 billion); Colombia 65th with 3.8 million tourists (and income of US$5.5 billion); Uruguay 69th with 3.4 million tourists (and income of US$2.3 billion). Please note that the number of tourists does not always reflect the monetary amount the country gets from tourism. Some countries carry out higher level tourism, obtaining more benefits. Tourism in South America is still little evolved: in Europe, for example, countries obtain annual tourist values such as U $73.7 billion (Spain), or U $67.3 billion (France). While Europe received 710 million tourists in 2018, Asia 347 million and North America 142.2 million, South America received only 37 million, Central America 10.8 million and the Caribbean 25.7 million.[108]
Gallery
-
 Grape plantation in Argentina. Argentina and Chile are among the 10 largest grape and wine producers in the world and Brazil among the 20 largest.
 -
 Maize in Dourados. Brazil and Argentina are among the 5 largest world producers
 -
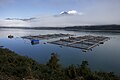 Salmon farming in Chile. One third of all salmon sold in the world comes from the country.
 -
 Neugebauer Chocolate Factory in Arroio do Meio. South America specializes in food processing
 -
 Steel-maker CSN, in Volta Redonda. Brazil is one of the 10 largest steel producers in the world, and Argentina is one of the 30 largest
 -
 Klabin industrial complex, in Ortigueira. Brazil is the second largest pulp producer and the eighth largest paper producer in the world
 -
 Portico of the Democrata men's shoe factory, in Franca. Brazil is the fourth largest shoe manufacturer in the world.
 -
 Hering, in Santa Catarina, Brazil. The country has one of the 5 largest textile industries in the world
 -
 Mercedes-Benz plant in São Paulo. Mexico and Brazil are among the 10 largest vehicle manufacturers in the world and Argentina among the 30 largest.
 -
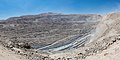 Copper mine in Chile. Latin America produces more than half of the world's copper
 -
 Colombian emerald. The country is the largest producer of emeralds in the world, and Brazil is one of the largest producers
 -
 Copacabana Palace, the best hotel in South America, in Rio de Janeiro. Tourism brings important currencies to the continent.
 -
 Honey production in Argentina. The country is the third largest producer of honey in the world.
 -
 Sunflower plantation in Argentina. The country is the world's third largest producer of sunflower seed.
 -
 Chilean cherries. Chile is one of the top 5 producers of sweet cherries in the world.
 -
 Chilean kiwi. The country is one of the 10 largest kiwi producers in the world.
 -
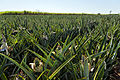
 Palm plantation in Magdalena. Colombia is one of the top 5 palm oil producers in the world.
 -
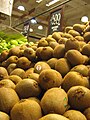
 Pineapple in Brazil. The country is the 3rd largest producer in the world. South America produces close to 20% of the world's pineapple.


,_Brazil.jpg)

.jpg)


Transport
Roads and highways


.jpg)
.jpg)
.jpg)
Transport in South America is basically carried out using the
Brazil has more than 1.7 million km of
Due to the
Airports
There are more than 2,000 airports in Brazil. The country has the second largest number of airports in the world, behind only the United States.
Ports
About
Railways
The Brazilian
Waterways
Among the main Brazilian
Energy
Brazil


The Brazilian government has undertaken an ambitious program to reduce dependence on imported petroleum. Imports previously accounted for more than 70% of the country's oil needs but Brazil became self-sufficient in oil in 2006–2007. Brazil was the 10th largest oil producer in the world in 2019, with 2.8 million barrels / day. Production manages to supply the country's demand.[105] In the beginning of 2020, in the production of oil and natural gas, the country exceeded 4 million barrels of oil equivalent per day, for the first time. In January this year, 3.168 million barrels of oil per day and 138.753 million cubic meters of natural gas were extracted.[107]
Brazil is one of the main world producers of hydroelectric power. In 2019, Brazil had 217 hydroelectric plants in operation, with an installed capacity of 98,581 MW, 60.16% of the country's energy generation.[116] In the total generation of electricity, in 2019 Brazil reached 170,000 megawatts of installed capacity, more than 75% from renewable sources (the majority, hydroelectric).[117][118]
In 2013, the
As of July 2022,[ref] according to ONS, total installed capacity of wind power was 22 GW, with average capacity factor of 58%.[121][122] While the world average wind production capacity factors is 24.7%, there are areas in Northern Brazil, specially in Bahia State, where some wind farms record with average capacity factors over 60%;[123][14] the average capacity factor in the Northeast Region is 45% in the coast and 49% in the interior.[124] In 2019, wind energy represented 9% of the energy generated in the country.[125] In 2019, it was estimated that the country had an estimated wind power generation potential of around 522 GW (this, only onshore), enough energy to meet three times the country's current demand.[126][127] In 2021 Brazil was the 7th country in the world in terms of installed wind power (21 GW),[128][129] and the 4th largest producer of wind energy in the world (72 TWh), behind only China, USA and Germany.[130]
Nuclear energy accounts for about 4% of Brazil's electricity.
As of October 2022,[ref] according to ONS, total installed capacity of
In 2020, Brazil was the 2nd largest country in the world in the production of energy through biomass (energy production from solid biofuels and renewable waste), with 15,2 GW installed.[138]
Other countries
After Brazil, Colombia is the country in South America that most stands out in energy production. In 2020, the country was the 20th largest petroleum producer in the world, and in 2015 it was the 19th largest exporter. In natural gas, the country was, in 2015, the 40th largest producer in the world. Colombia's biggest highlight is in coal, where the country was, in 2018, the world's 12th largest producer and the 5th largest exporter. In renewable energies, in 2020, the country ranked 45th in the world in terms of installed wind energy (0.5 GW), 76th in the world in terms of installed solar energy (0.1 GW) and 20th in the world in terms of installed hydroelectric power (12.6 GW). Venezuela, which was one of the world's largest oil producers (about 2.5 million barrels/day in 2015) and one of the largest exporters, due to its political problems, has had its production drastically reduced in recent years: in 2016, it dropped to 2.2 million, in 2017 to 2 million, in 2018 to 1.4 million and in 2019 to 877 thousand, reaching only 300,000 barrels/day at a given point. The country also stands out in hydroelectricity, where it was the 14th country in the world in terms of installed capacity in 2020 (16,5 GW). Argentina was, in 2017, the 18th largest producer in the world, and the largest producer in Latin America, of natural gas, in addition to being the 28th largest oil producer; although the country has the Vaca Muerta field, which holds close to 16 billion barrels of technically recoverable shale oil, and is the second largest shale natural gas deposit in the world, the country lacks the capacity to exploit the deposit: it is necessary capital, technology and knowledge that can only come from offshore energy companies, who view Argentina and its erratic economic policies with considerable suspicion, not wanting to invest in the country. In renewable energies, in 2020, the country ranked 27th in the world in terms of installed wind energy (2.6 GW), 42nd in the world in terms of installed solar energy (0.7 GW) and 21st in the world in terms of installed hydroelectric power (11.3 GW). The country has great future potential for the production of wind energy in the Patagonia region. Chile, although currently not a major energy producer, has great future potential for solar energy production in the Atacama Desert region. Paraguay stands out today in hydroelectric production thanks to the Itaipu Power Plant. Bolivia stands out in the production of natural gas, where it was the 31st largest in the world in 2015. Ecuador, because it consumes little energy, is part of OPEC and was the 27th largest oil producer in the world in 2020, being the 22nd largest exporter in 2014.[139][140][141][142][128]
See also
- Latin American economy
- List of Latin American and Caribbean countries by GDP (nominal)
- List of Latin American and Caribbean countries by GDP (PPP)
References
- ^ "World Population Prospects 2022". United Nations Department of Economic and Social Affairs, Population Division. Retrieved 17 July 2022.
- ^ "World Population Prospects 2022: Demographic indicators by region, subregion and country, annually for 1950-2100" (XSLX) ("Total Population, as of 1 July (thousands)"). United Nations Department of Economic and Social Affairs, Population Division. Retrieved 17 July 2022.
- ^ "GDP (Nominal), current prices". International Monetary Fund. Archived from the original on 25 February 2017. Retrieved 5 November 2022.
- ^ "GDP (PPP), current prices". International Monetary Fund. Archived from the original on 26 October 2022. Retrieved 5 November 2022.
- ^ International Monetary Fund (2022). "Real GDP growth". IMF Data Mapper. International Monetary Fund. Archived from the original on 14 November 2020. Retrieved 5 November 2022.
- ^ International Monetary Fund (2022). "Nominal GDP per capita". IMF Data Mapper. International Monetary Fund. Archived from the original on 11 January 2020. Retrieved 5 November 2022.
- ^ International Monetary Fund (2022). "GDP PPP per capita". IMF Data Mapper. International Monetary Fund. Archived from the original on 8 November 2019. Retrieved 5 November 2022.
- ^ Shorrocks, Anthony; Davies, James; Lluberas, Rodrigo (2022). Global Wealth Databook 2022 (PDF). Credit Suisse Research Institute. Archived (PDF) from the original on 19 October 2022. Retrieved 17 January 2023.
- ^ International Monetary Fund (2022). "General government gross debt". IMF Data Mapper. International Monetary Fund. Archived from the original on 18 January 2023. Retrieved 5 November 2022.
- ^ "Report for Selected Countries and Subjects". IMF. Retrieved 29 February 2024.
- ^ "Guyana Datasets". www.imf.org. Retrieved 1 March 2024.
- ^ "Encyclopædia Britannica". South America. Encyclopædia Britannica Inc. Archived from the original on 29 April 2023. Retrieved 17 June 2015.
- ISBN 9781107507180.
- ^ a b c d Recent developments Archived 31 March 2022 at the Wayback Machine World Bank Retrieved 28 July 2023
- ^ a b Recent developments Archived 12 July 2018 at the Wayback Machine World Bank Retrieved 28 July 2023
- ^ a b c "World Economic Outlook Database, October 2023 Edition". IMF.org. International Monetary Fund. Archived from the original on 13 October 2023. Retrieved 11 April 2023.
- ^ "WEO Database, October 2023. Report for Selected Countries and Subjects: World, European Union". IMF.org. International Monetary Fund. 10 October 2023. Archived from the original on 13 October 2023. Retrieved 10 October 2023.
- ^ "Exports of goods and services (BoP, current US$)". World Bank Open Data. Archived from the original on 17 February 2023. Retrieved 20 August 2023.
- ^ "Human Development Report 2014. Human development indices" (PDF). The United Nations. January 2011. p. 23. Archived (PDF) from the original on 4 February 2012. Retrieved 24 May 2011.
- ^ "World Bank Open Data". Archived from the original on 16 December 2023. Retrieved 16 December 2023.
- ^ Falkland Islands (Islas Malvinas) Archived 9 January 2021 at the Wayback Machine. The World Factbook. Central Intelligence Agency.
- ^ "Produits intérieurs bruts régionaux et valeurs ajoutées régionales de 1990 à 2022 | Insee". Archived from the original on 21 March 2023. Retrieved 16 December 2023.
- ^ "Agria Corp". South American Market. Agria Corporation. Archived from the original on 6 January 2023. Retrieved 21 February 2018.
- ^ a b "National Geographic". South America Resources. National Geographic. 4 January 2012. Archived from the original on 29 April 2023. Retrieved 21 February 2018.
- ^ "BrazilGovNews". Brazil breaks another record in coffee exports. BrazilGovNews. Archived from the original on 29 April 2023. Retrieved 21 February 2018.
- ^ "The Observatory of Economic Complexity". Brazil. The Observatory of Economic Complexity. Archived from the original on 31 March 2019. Retrieved 21 February 2018.
- ^ a b c "The Observatory of Economic Complexity". Argentina. The Observatory of Economic Complexity. Archived from the original on 21 May 2019. Retrieved 21 February 2018.
- ^ "Encyclopedia Britannica". Agriculture. Encyclopedia Britannica. Archived from the original on 29 April 2023. Retrieved 21 February 2018.
- ^ "South American countries production in 2018, by FAO". Archived from the original on 30 October 2018. Retrieved 26 September 2020.
- ^ "Conheça os 3 países que desafiam o Brasil nas exportações de frango". 22 January 2020. Archived from the original on 27 January 2020. Retrieved 25 September 2020.
- ^ "maiores exportadores de carne de frango entre os anos de 2015 e 2019". 30 May 2019. Archived from the original on 1 June 2019. Retrieved 25 September 2020.
- ^ "IBGE: rebanho de bovinos tinha 218,23 milhões de cabeças em 2016". 29 September 2017. Archived from the original on 8 September 2018. Retrieved 25 September 2020.
- ^ "Brasil é o 3º maior produtor de leite do mundo, superando o padrão Europeu em alguns municípios". Archived from the original on 17 September 2020. Retrieved 25 September 2020.
- ^ "principais países produtores de carne suína entre 2017 e a estimativa para 2019". 23 July 2019. Archived from the original on 26 January 2020. Retrieved 25 September 2020.
- ^ "Argentina production in 2018, by FAO". Archived from the original on 30 October 2018. Retrieved 26 September 2020.
- ^ "Producción de carne y leche, por FAO". Archived from the original on 16 October 2020. Retrieved 18 October 2020.
- ^ "Manufacturing, value added (current US$)". Archived from the original on 7 January 2020. Retrieved 18 October 2020.
- ^ "Latin America Economic Outlook July 2015" (PDF). deloitte.com. Archived (PDF) from the original on 26 February 2024. Retrieved 28 July 2023.
- ^ "Alimentos Processados | A indústria de alimentos e bebidas na sociedade brasileira atual". alimentosprocessados.com.br. Archived from the original on 25 March 2018. Retrieved 18 October 2020.
- ^ "Faturamento da indústria de alimentos cresceu 6,7% em 2019". G1. 18 February 2020. Archived from the original on 19 February 2020. Retrieved 18 October 2020.
- ^ "Indústria de alimentos e bebidas faturou R$ 699,9 bi em 2019". Agência Brasil. 18 February 2020. Archived from the original on 19 February 2020. Retrieved 18 October 2020.
- ^ "Produção nacional de celulose cai 6,6% em 2019, aponta Ibá". Valor Econômico. 21 February 2020. Archived from the original on 21 February 2020. Retrieved 18 October 2020.
- ^ "Sabe qual é o estado brasileiro que mais produz Madeira?". 9 October 2017. Archived from the original on 12 October 2017. Retrieved 18 October 2020.
- ^ "São Mateus é o 6º maior produtor de madeira em tora para papel e celulose no país, diz IBGE". G1. 28 September 2017. Archived from the original on 29 September 2022. Retrieved 18 October 2020.
- ^ "Indústrias calçadistas em Franca, SP registram queda de 40% nas vagas de trabalho em 6 anos". G1. 14 July 2019. Archived from the original on 14 July 2019. Retrieved 18 October 2020.
- ^ Digital, Agência Maya: Criação de Sites e Marketing. "Fenac – Centro de Eventos e Negócios | Produção de calçados deve crescer 3% em 2019". fenac.com.br. Archived from the original on 1 November 2019. Retrieved 18 October 2020.
- ^ "Abicalçados apresenta Relatório Setorial 2019". abicalcados.com.br. Archived from the original on 22 April 2020. Retrieved 18 October 2020.
- ^ "Exportação de Calçados: Saiba mais". 27 February 2020. Archived from the original on 15 April 2022. Retrieved 18 October 2020.
- ^ Comércio, Diário do (24 January 2020). "Minas Gerais produz 32,3% do aço nacional em 2019". Archived from the original on 14 June 2020. Retrieved 18 October 2020.
- ^ "O novo mapa das montadoras, que agora rumam para o interior do País". 8 March 2019. Archived from the original on 8 March 2019. Retrieved 18 October 2020.
- ^ "Indústria automobilística do Sul do Rio impulsiona superavit na economia". G1. 12 July 2017. Archived from the original on 19 July 2017. Retrieved 18 October 2020.
- ^ "Indústria Química no Brasil" (PDF). Archived from the original (PDF) on 9 October 2022. Retrieved 18 October 2020.
- ^ "Estudo de 2018" (PDF). Archived (PDF) from the original on 9 October 2022. Retrieved 18 October 2020.
- ^ "Produção nacional da indústria de químicos cai 5,7% em 2019, diz Abiquim". economia.uol.com.br. Archived from the original on 14 June 2020. Retrieved 18 October 2020.
- ^ "Industria Textil no Brasil". Archived from the original on 19 June 2020. Retrieved 18 October 2020.
- ^ "World vehicle production in 2019". Archived from the original on 20 November 2021. Retrieved 21 December 2021.
- ^ "World crude steel production" (PDF). Archived from the original (PDF) on 30 January 2020. Retrieved 21 December 2021.
- ^ "Global crude steel output increases by 3.4% in 2019". Archived from the original on 30 January 2020. Retrieved 21 December 2021.
- ^ "Statistics of world production of barley beer and oils". Archived from the original on 30 October 2018. Retrieved 21 December 2021.
- ^ "USGS Online Publications Directory". pubs.usgs.gov. Archived from the original on 15 June 2021. Retrieved 21 December 2021.
- ^ "Production statistics of USGS Silver" (PDF). Archived (PDF) from the original on 15 May 2021. Retrieved 21 December 2021.
- ^ "Copper production statistics for the USGS" (PDF). Archived (PDF) from the original on 9 October 2022. Retrieved 21 December 2021.
- ^ "Production statistics of USGS iron ore" (PDF). Archived (PDF) from the original on 9 October 2022. Retrieved 21 December 2021.
- ^ "Zinc production statistics from USGS" (PDF). Archived (PDF) from the original on 9 October 2022. Retrieved 21 December 2021.
- ^ a b c "USGS Molybdenum Production Statistics" (PDF). Archived (PDF) from the original on 9 October 2022. Retrieved 21 December 2021.
- ^ "USGS lithium production statistics" (PDF). Archived (PDF) from the original on 9 October 2022. Retrieved 21 December 2021.
- ^ a b c "USGS Lead Production Statistics" (PDF). Archived (PDF) from the original on 15 May 2021. Retrieved 21 December 2021.
- ^ "USGS Bauxite Production Statistics" (PDF). Archived (PDF) from the original on 30 October 2022. Retrieved 21 December 2021.
- ^ "USGS tin production statistics" (PDF). Archived (PDF) from the original on 13 August 2021. Retrieved 21 December 2021.
- ^ "Manganese production statistics from the USGS" (PDF). Archived (PDF) from the original on 10 October 2022. Retrieved 21 December 2021.
- ^ "USGS antimony production statistics" (PDF). Archived (PDF) from the original on 9 October 2022. Retrieved 21 December 2021.
- ^ "USGS Nickel Production Statistics" (PDF). Archived (PDF) from the original on 9 October 2022. Retrieved 21 December 2021.
- ^ "USGS Niobium Production Statistics" (PDF). Archived (PDF) from the original on 9 October 2022. Retrieved 21 December 2021.
- ^ "USGS rhenium production statistics" (PDF). Archived (PDF) from the original on 21 June 2021. Retrieved 21 December 2021.
- ^ "USGS iodine production statistics" (PDF). Archived (PDF) from the original on 25 June 2021. Retrieved 21 December 2021.
- ^ "ANM". gov.br Agência Nacional de Mineração. 14 July 2023. Archived from the original on 4 August 2020. Retrieved 21 December 2021.
- ^ "Brasil extrai cerca de 2 gramas de ouro por habitante em 5 anos". R7.com. 29 June 2019. Archived from the original on 12 July 2020. Retrieved 21 December 2021.
- ^ "G1 > Economia e Negócios – NOTÍCIAS – Votorantim Metais adquire reservas de zinco da Masa". g1.globo.com. Archived from the original on 18 January 2021. Retrieved 21 December 2021.
- ^ "Nióbio: G1 visita em MG complexo industrial do maior produtor do mundo". G1. 12 December 2019. Archived from the original on 12 December 2019. Retrieved 21 December 2021.
- ^ "Serviço Geológico do Brasil". cprm.gov.br. Archived from the original on 6 September 2019. Retrieved 21 December 2021.
- ^ "Rio Grande do Sul: o maior exportador de pedras preciosas do Brasil". Band.com.br. Archived from the original on 2 May 2018. Retrieved 21 December 2021.
- ^ "Copper production in 2019 by USGS" (PDF). Archived (PDF) from the original on 9 October 2022. Retrieved 21 December 2021.
- ^ "USGS Iodine Production Statistics" (PDF). Archived (PDF) from the original on 25 June 2021. Retrieved 21 December 2021.
- ^ "USGS Rhenium Production Statistics" (PDF). Archived (PDF) from the original on 21 June 2021. Retrieved 21 December 2021.
- ^ a b "USGS Lithium Production Statistics" (PDF). Archived (PDF) from the original on 9 October 2022. Retrieved 21 December 2021.
- ^ a b c d "USGS Silver Production Statistics" (PDF). Archived (PDF) from the original on 15 May 2021. Retrieved 21 December 2021.
- ^ "USGS Salt Production Statistics" (PDF). Archived (PDF) from the original on 9 October 2022. Retrieved 21 December 2021.
- ^ "USGS Potash Product ion Statistics" (PDF). Archived (PDF) from the original on 9 October 2022. Retrieved 21 December 2021.
- ^ "USGS Sulfur Production Statistics" (PDF). Archived (PDF) from the original on 9 October 2022. Retrieved 21 December 2021.
- ^ "USGS Iron Ore Production Statistics" (PDF). Archived (PDF) from the original on 9 October 2022. Retrieved 21 December 2021.
- ^ "USGS Copper Production Statistics" (PDF). Archived (PDF) from the original on 9 October 2022. Retrieved 21 December 2021.
- ^ a b "USGS Gold Production Statistics" (PDF). Archived (PDF) from the original on 9 October 2022. Retrieved 21 December 2021.
- ^ "USGS Zinc Production Statistics" (PDF). Archived (PDF) from the original on 9 October 2022. Retrieved 21 December 2021.
- ^ a b "USGS Tin Production Statistics" (PDF). Archived (PDF) from the original on 13 August 2021. Retrieved 21 December 2021.
- ^ a b c "USGS Boron Production Statistics" (PDF). Archived (PDF) from the original on 18 July 2021. Retrieved 21 December 2021.
- ^ "USGS Antimony Production Statistics" (PDF). Archived (PDF) from the original on 9 October 2022. Retrieved 21 December 2021.
- ^ "USGS Tungsten Production Statistics" (PDF). Archived (PDF) from the original on 5 July 2021. Retrieved 21 December 2021.
- ^ "USGS ZincProduction Statistics" (PDF). Archived (PDF) from the original on 9 October 2022. Retrieved 21 December 2021.
- ^ "The state of mining in South America – an overview". Archived from the original on 7 December 2020. Retrieved 19 December 2014.
- ^ a b "ANM". Agência Nacional de Mineração. 14 July 2023. Archived from the original on 4 August 2020. Retrieved 21 December 2021.
- ^ "BBC Brasil – Notícias – Região colombiana vive 'febre das esmeraldas'". www.bbc.com. Archived from the original on 21 December 2021. Retrieved 21 December 2021.
- ^ "Colombia Gold Production, 1990 – 2021 | CEIC Data". www.ceicdata.com. Archived from the original on 16 August 2021. Retrieved 21 December 2021.
- ^ "Colombia Silver Production, 1990 – 2021 | CEIC Data". www.ceicdata.com. Archived from the original on 16 August 2021. Retrieved 21 December 2021.
- ^ Campbell, Keith. "The state of mining in South America – an overview". Mining Weekly. Archived from the original on 14 April 2021. Retrieved 1 March 2021.
- ^ a b "Production of Crude Oil including Lease Condensate 2019". Archived from the original on 4 March 2021. Retrieved 13 October 2020.
- ^ "Natural Gas production". Archived from the original on 19 October 2020. Retrieved 13 October 2020.
- ^ a b "Produção de petróleo e gás no Brasil ultrapassa 4 milhões de boe/d pela primeira vez". anp.gov.br. Archived from the original on 20 February 2020. Retrieved 8 November 2020.
- ISBN 978-92-844-2115-2. Archivedfrom the original on 30 August 2019. Retrieved 18 October 2020.
- ^ a b "Anuário CNT do transporte 2018". Archived from the original on 11 November 2019. Retrieved 5 November 2020.
- ^ "Transporte en Cifras Estadísticas 2015". Archived from the original on 27 January 2021. Retrieved 5 November 2020.
- ^ "Carta Caminera 2017" (PDF). Archived (PDF) from the original on 14 April 2021. Retrieved 5 November 2020.
- ^ "Brasil tem 9 dos maiores aeroportos da América Latina". Archived from the original on 11 January 2021. Retrieved 8 November 2020.
- ^ "Port Activity of Latin America and the Caribbean 2018" (PDF). Archived (PDF) from the original on 14 January 2021. Retrieved 8 November 2020.
- ^ "The World Factbook — Central Intelligence". Archived from the original on 12 August 2021. Retrieved 24 January 2021.
- ^ "Diagnostico Transporte" (PDF). Archived (PDF) from the original on 7 March 2023. Retrieved 6 November 2020.
- ^ "How many power plants do we have in Brazil?". Archived from the original on 30 March 2023. Retrieved 8 November 2020.
- ^ "Brasil alcança 170 mil megawatts de capacidade instalada em 2019". Archived from the original on 13 April 2021. Retrieved 8 November 2020.
- ^ "Uso de água em termoelétricas" (PDF). Archived from the original (PDF) on 1 April 2018.
- ^ "O BNDES e a questão energética e logística da Região Sudeste" (PDF). Archived (PDF) from the original on 3 April 2023. Retrieved 8 November 2020.
- ^ "Power: World's biggest hydroelectric facility". 19 May 2006. Archived from the original on 19 May 2006.
- ^ "Boletim Mensal de Geração Eólica Fevereiro/2021" (PDF) (in Portuguese). Operador Nacional do Sistema Elétrico – ONS. 20 February 2021. pp. 6, 14. Archived (PDF) from the original on 10 April 2021. Retrieved 7 April 2021.
- ^ "Eólica supera 22 GW em operação no Brasil" (in Brazilian Portuguese). Megawhat. 21 July 2022. Archived from the original on 15 March 2023. Retrieved 2 August 2022.
- ^ "Brasil é o país com melhor fator de aproveitamento da energia eólica". Governo do Brasil (in Brazilian Portuguese). Archived from the original on 7 October 2018. Retrieved 7 October 2018.
- ^ "Boletim Trimestral de Energia Eólica – Junho de 2020" (PDF) (in Brazilian Portuguese). Empresa de Pesquisa Energética. 23 June 2020. p. 4. Archived (PDF) from the original on 9 October 2022. Retrieved 24 October 2020.
- ^ a b "Quantas usinas geradoras de energia temos no Brasil?". Archived from the original on 30 March 2023. Retrieved 8 November 2020.
- ^ "Ventos promissores a caminho". Archived from the original on 27 November 2022. Retrieved 8 November 2020.
- ^ "Brazilian onshore wind potential could be 880 GW, study indicates". Archived from the original on 14 August 2020. Retrieved 8 November 2020.
- ^ a b "RENEWABLE CAPACITY STATISTICS 2021" (PDF). Archived (PDF) from the original on 27 August 2021. Retrieved 23 April 2021.
- ^ "Global wind statistics" (PDF). IRENA. 22 April 2022. Archived (PDF) from the original on 9 October 2022. Retrieved 22 April 2022.
- ^ Hannah Ritchie and Max Roser, Wind Power generation Archived 4 August 2020 at the Wayback Machine
- ^ "Nuclear Power in Brazil. Briefing Paper # 95". Uranium Information Centre. May 2007. Archived from the original on 8 February 2007. Retrieved 19 May 2007.
- ^ "Brazil plans to build seven nuclear reactors". Mecropress. 23 October 2006. Archived from the original on 19 February 2007. Retrieved 19 May 2007.
- ^ "Solar atinge 21 GW e R$ 108,6 bi em investimentos no Brasil". Archived from the original on 1 April 2023. Retrieved 27 October 2022.
- ^ "Quais as melhores regiões do Brasil para geração de energia fotovoltaica? – Sharenergy". Sharenergy (in Brazilian Portuguese). 3 February 2017. Archived from the original on 7 October 2018. Retrieved 7 October 2018.
- ^ "Boletim Mensal de Geração Solar Fotovoltaica Setembro/2020" (PDF) (in Portuguese). Operador Nacional do Sistema Elétrico – ONS. 13 October 2020. pp. 6, 13. Archived (PDF) from the original on 9 October 2022. Retrieved 21 October 2020.
- ^ "RENEWABLE CAPACITY STATISTICS 2022" (PDF). Archived (PDF) from the original on 9 October 2022. Retrieved 27 October 2022.
- ^ "Hannah Ritchie, Max Roser: Solar Power Generation". Archived from the original on 4 August 2020. Retrieved 27 October 2022.
- ^ "RENEWABLE CAPACITY STATISTICS 2021 page 41" (PDF). Archived (PDF) from the original on 27 August 2021. Retrieved 24 May 2021.
- ^ "Annual production of oil and other liquids". Archived from the original on 27 June 2020. Retrieved 13 October 2020.
- ^ IEA. Key World Energy Statistics 2014. Natural Gas. Archived 21 October 2014 at the Wayback Machine Access date – 17 January 2021
- ^ "html CIA. The World Factbook. Natural gas – production".
- ^ "Statistical Review of World Energy 2018". Archived from the original on 15 January 2023. Retrieved 26 June 2021.
Economy of the Americas | ||
|---|---|---|
|  | |
| Sovereign states |
| |
| ||