
Electroencephalography
| Electroencephalography | |
|---|---|
 Epileptic spike and wave discharges monitored EEG |
Electroencephalography (EEG) is a method to record an
Voltage fluctuations measured by the EEG
A healthy human EEG will show certain patterns of activity that correlate with how awake a person is. The range of frequencies one observes are between 1 and 30 Hz, and amplitudes will vary between 20 and 100 μV. The observed frequencies are subdivided into various groups:
EEG can detect abnormal
Derivatives of the EEG technique include
Uses
Epilepsy

EEG is the gold standard diagnostic procedure to confirm epilepsy. The sensitivity of a routine EEG to detect interictal epileptiform discharges at epilepsy centers has been reported to be in the range of 29–55%.[5] Given the low to moderate sensitivity, a routine EEG (typically with a duration of 20–30 minutes) can be normal in people that have epilepsy. When an EEG shows interictal epileptiform discharges (e.g. sharp waves, spikes, spike-and-wave, etc.) it is confirmatory of epilepsy in nearly all cases (high specificity), however up to 3.5% of the general population may have epileptiform abnormalities in an EEG without ever having had a seizure (low false positive rate)[5] or with a very low risk of developing epilepsy in the future.[6]
When a routine EEG is normal and there is a high suspicion or need to confirm epilepsy, it may be repeated or performed with a longer duration in the epilepsy monitoring unit (EMU) or at home with an ambulatory EEG. In addition, there are activating maneuvers such as photic stimulation, hyperventilation and sleep deprivation that can increase the diagnostic yield of the EEG.[5]
Epilepsy Monitoring Unit (EMU)
At times, a routine EEG is not sufficient to establish the diagnosis or determine the best course of action in terms of treatment. In this case, attempts may be made to record an EEG while a
Epilepsy monitoring is often considered when patients continue having events despite being on anti-seizure medications or if there is concern that the patient's events have an alternate diagnosis, e.g.,
Other brain disorders
An EEG might also be helpful for diagnosing or treating the following disorders:[9]
- Brain tumor
- Brain damage from head injury
- Brain dysfunction that can have a variety of causes (encephalopathy)
- Inflammation of the brain (encephalitis)
- Stroke
- Sleep disorders
It can also:
- distinguish syncope (fainting), sub-cortical movement disorders and migrainevariants
- differentiate "organic" encephalopathy or delirium from primary psychiatric syndromes such as catatonia
- serve as an adjunct test of brain death in comatose patients
- prognosticate in comatose patients (in certain instances) or in newborns with brain injury from various causes around the time of birth
- determine whether to wean anti-epileptic medications.
Intensive Care Unit (ICU)
EEG can also be used in intensive care units for brain function monitoring to monitor for non-convulsive seizures/non-convulsive status epilepticus, to monitor the effect of sedative/anesthesia in patients in medically induced coma (for treatment of refractory seizures or increased intracranial pressure), and to monitor for secondary brain damage in conditions such as subarachnoid hemorrhage (currently a research method).
In cases where significant brain injury is suspected, e.g., after cardiac arrest, EEG can provide some prognostic information.
If a patient with epilepsy is being considered for
Home ambulatory EEG
Sometimes it is more convenient or clinically necessary to perform ambulatory EEG recordings in the home of the patient. These studies typically have a duration of 24–72 hours.[citation needed]
Research use
EEG and the related study of
Advantages
Several other methods to study brain function exist, including functional magnetic resonance imaging (fMRI), positron emission tomography (PET), magnetoencephalography (MEG), nuclear magnetic resonance spectroscopy (NMR or MRS), electrocorticography (ECoG), single-photon emission computed tomography (SPECT), near-infrared spectroscopy (NIRS), and event-related optical signal (EROS). Despite the relatively poor spatial sensitivity of EEG, the "one-dimensional signals from localised peripheral regions on the head make it attractive for its simplistic fidelity and has allowed high clinical and basic research throughput".[15] Thus, EEG possesses some advantages over some of those other techniques:
- Hardware costs are significantly lower than those of most other techniques [16]
- EEG prevents limited availability of technologists to provide immediate care in high traffic hospitals.[17]
- EEG only requires a quiet room and briefcase-size equipment, whereas fMRI, SPECT, PET, MRS, or MEG require bulky and immobile equipment. For example, MEG requires equipment consisting of liquid helium-cooled detectors that can be used only in magnetically shielded rooms, altogether costing upwards of several million dollars;[18] and fMRI requires the use of a 1-ton magnet in, again, a shielded room.
- EEG can readily have a high temporal resolution, (although sub-millisecond resolution generates less meaningful data), because the two to 32 data streams generated by that number of electrodes is easily stored and processed, whereas 3D spatial technologies provide thousands or millions times as many input data streams, and are thus limited by hardware and software.[19] EEG is commonly recorded at sampling rates between 250 and 2000 Hz in clinical and research settings.
- EEG is relatively tolerant of subject movement, unlike most other neuroimaging techniques. There even exist methods for minimizing, and even eliminating movement artifacts in EEG data [20]
- EEG is silent, which allows for better study of the responses to auditory stimuli.
- EEG does not aggravate claustrophobia, unlike fMRI, PET, MRS, SPECT, and sometimes MEG[21]
- EEG does not involve exposure to high-intensity (>1 Tesla) magnetic fields, as in some of the other techniques, especially MRI and MRS. These can cause a variety of undesirable issues with the data, and also prohibit use of these techniques with participants that have metal implants in their body, such as metal-containing pacemakers[22]
- EEG does not involve exposure to radioligands, unlike positron emission tomography.[23]
- ERP studies can be conducted with relatively simple paradigms, compared with IE block-design fMRI studies
- Relatively non-invasive, in contrast to electrocorticography, which requires electrodes to be placed on the actual surface of the brain.
EEG also has some characteristics that compare favorably with behavioral testing:
- EEG can detect covert processing (i.e., processing that does not require a response)[24]
- EEG can be used in subjects who are incapable of making a motor response[25]
- EEG is a method widely used in the study of sport performance, valued for its portability and lightweight design [26]
- Some ERP components can be detected even when the subject is not attending to the stimuli
- Unlike other means of studying reaction time, ERPs can elucidate stages of processing (rather than just the result)[27]
- the simplicity of EEG readily provides for tracking of brain changes during different phases of life. EEG sleep analysis can indicate significant aspects of the timing of brain development, including evaluating adolescent brain maturation.
- In EEG there is a better understanding of what signal is measured as compared to other research techniques, e.g. the BOLD response in MRI.
Disadvantages
- Low spatial resolution on the scalp. fMRI, for example, can directly display areas of the brain that are active, while EEG requires intense interpretation just to hypothesize what areas are activated by a particular response.[29]
- Depending on the orientation and location of the dipole causing an EEG change, there may be a false localization due to the inverse problem.[30]
- EEG poorly measures neural activity that occurs below the upper layers of the brain (the cortex).
- Unlike PET and MRS, cannot identify specific locations in the brain at which various neurotransmitters, drugs, etc. can be found.[23]
- Often takes a long time to connect a subject to EEG, as it requires precise placement of dozens of electrodes around the head and the use of various gels, saline solutions, and/or pastes to maintain good conductivity, and a cap is used to keep them in place. While the length of time differs dependent on the specific EEG device used, as a general rule it takes considerably less time to prepare a subject for MEG, fMRI, MRS, and SPECT.
- Signal-to-noise ratio is poor, so sophisticated data analysis and relatively large numbers of subjects are needed to extract useful information from EEG.[31]
- EEGs are not currently very compatible with individuals who have coarser and/or textured hair. Even protective styles can pose issues during testing. Researchers are currently trying to build better options for patients and technicians alike. [32] Furthermore, researchers are starting to implement more culturally-informed data collection practices to help reduce racial biases in EEG research. [33]
With other neuroimaging techniques
Simultaneous EEG recordings and fMRI scans have been obtained successfully,[34][35][36][37] though recording both at the same time effectively requires that several technical difficulties be overcome, such as the presence of ballistocardiographic artifact, MRI pulse artifact and the induction of electrical currents in EEG wires that move within the strong magnetic fields of the MRI. While challenging, these have been successfully overcome in a number of studies.[38][39]
MRI's produce detailed images created by generating strong magnetic fields that may induce potentially harmful displacement force and torque. These fields produce potentially harmful radio frequency heating and create image artifacts rendering images useless. Due to these potential risks, only certain medical devices can be used in an MR environment.
Similarly, simultaneous recordings with MEG and EEG have also been conducted, which has several advantages over using either technique alone:
- EEG requires accurate information about certain aspects of the skull that can only be estimated, such as skull radius, and conductivities of various skull locations. MEG does not have this issue, and a simultaneous analysis allows this to be corrected for.
- MEG and EEG both detect activity below the surface of the cortex very poorly, and like EEG, the level of error increases with the depth below the surface of the cortex one attempts to examine. However, the errors are very different between the techniques, and combining them thus allows for correction of some of this noise.
- MEG has access to virtually no sources of brain activity below a few centimetres under the cortex. EEG, on the other hand, can receive signals from greater depth, albeit with a high degree of noise. Combining the two makes it easier to determine what in the EEG signal comes from the surface (since MEG is very accurate in examining signals from the surface of the brain), and what comes from deeper in the brain, thus allowing for analysis of deeper brain signals than either EEG or MEG on its own.[40]
Recently, a combined EEG/MEG (EMEG) approach has been investigated for the purpose of source reconstruction in epilepsy diagnosis.[41]
EEG has also been combined with positron emission tomography. This provides the advantage of allowing researchers to see what EEG signals are associated with different drug actions in the brain.[42]
Recent studies using
Mechanisms
The brain's electrical charge is maintained by billions of
The
Scalp EEG activity shows
Method
.jpg)
In conventional scalp EEG, the recording is obtained by placing
Electrode locations and names are specified by the
Each electrode is connected to one input of a differential amplifier (one amplifier per pair of electrodes); a common system reference electrode is connected to the other input of each differential amplifier. These amplifiers amplify the voltage between the active electrode and the reference (typically 1,000–100,000 times, or 60–100 dB of voltage gain). In analog EEG, the signal is then filtered (next paragraph), and the EEG signal is output as the deflection of pens as paper passes underneath. Most EEG systems these days, however, are digital, and the amplified signal is digitized via an analog-to-digital converter, after being passed through an anti-aliasing filter. Analog-to-digital sampling typically occurs at 256–512 Hz in clinical scalp EEG; sampling rates of up to 20 kHz are used in some research applications.
During the recording, a series of activation procedures may be used. These procedures may induce normal or abnormal EEG activity that might not otherwise be seen. These procedures include hyperventilation, photic stimulation (with a strobe light), eye closure, mental activity, sleep and sleep deprivation. During (inpatient) epilepsy monitoring, a patient's typical seizure medications may be withdrawn.
The digital EEG signal is stored electronically and can be filtered for display. Typical settings for the
The EEG signals can be captured with opensource hardware such as OpenBCI and the signal can be processed by freely available EEG software such as EEGLAB or the Neurophysiological Biomarker Toolbox.
As part of an evaluation for epilepsy surgery, it may be necessary to insert electrodes near the surface of the brain, under the surface of the dura mater. This is accomplished via burr hole or craniotomy. This is referred to variously as "electrocorticography (ECoG)", "intracranial EEG (I-EEG)" or "subdural EEG (SD-EEG)". Depth electrodes may also be placed into brain structures, such as the amygdala or hippocampus, structures, which are common epileptic foci and may not be "seen" clearly by scalp EEG. The electrocorticographic signal is processed in the same manner as digital scalp EEG (above), with a couple of caveats. ECoG is typically recorded at higher sampling rates than scalp EEG because of the requirements of Nyquist theorem – the subdural signal is composed of a higher predominance of higher frequency components. Also, many of the artifacts that affect scalp EEG do not impact ECoG, and therefore display filtering is often not needed.
A typical adult human EEG signal is about 10 µV to 100 µV in amplitude when measured from the scalp.[53]
Since an EEG voltage signal represents a difference between the voltages at two electrodes, the display of the EEG for the reading encephalographer may be set up in one of several ways. The representation of the EEG channels is referred to as a montage.
- Sequential montage
- Each channel (i.e., waveform) represents the difference between two adjacent electrodes. The entire montage consists of a series of these channels. For example, the channel "Fp1-F3" represents the difference in voltage between the Fp1 electrode and the F3 electrode. The next channel in the montage, "F3-C3", represents the voltage difference between F3 and C3, and so on through the entire array of electrodes.
- Referential montage
- Each channel represents the difference between a certain electrode and a designated reference electrode. There is no standard position for this reference; it is, however, at a different position than the "recording" electrodes. Midline positions are often used because they do not amplify the signal in one hemisphere vs. the other, such as Cz, Oz, Pz etc. as online reference. The other popular offline references are:
- REST reference: which is an offline computational reference at infinity where the potential is zero. REST (reference electrode standardization technique) takes the equivalent sources inside the brain of any a set of scalp recordings as springboard to link the actual recordings with any an online or offline( average, linked ears etc.) non-zero reference to the new recordings with infinity zero as the standardized reference.[54]
- "linked ears": which is a physical or mathematical average of electrodes attached to both earlobes or mastoids.
- Average reference montage
- The outputs of all of the amplifiers are summed and averaged, and this averaged signal is used as the common reference for each channel.
- Laplacian montage
- Each channel represents the difference between an electrode and a weighted average of the surrounding electrodes.[55]
When analog (paper) EEGs are used, the technologist switches between montages during the recording in order to highlight or better characterize certain features of the EEG. With digital EEG, all signals are typically digitized and stored in a particular (usually referential) montage; since any montage can be constructed mathematically from any other, the EEG can be viewed by the electroencephalographer in any display montage that is desired.
The EEG is read by a
Dry EEG electrodes
In the early 1990s Babak Taheri, at University of California, Davis demonstrated the first single and also multichannel dry active electrode arrays using micro-machining. The single channel dry EEG electrode construction and results were published in 1994.[56] The arrayed electrode was also demonstrated to perform well compared to silver/silver chloride electrodes. The device consisted of four sites of sensors with integrated electronics to reduce noise by impedance matching. The advantages of such electrodes are: (1) no electrolyte used, (2) no skin preparation, (3) significantly reduced sensor size, and (4) compatibility with EEG monitoring systems. The active electrode array is an integrated system made of an array of capacitive sensors with local integrated circuitry housed in a package with batteries to power the circuitry. This level of integration was required to achieve the functional performance obtained by the electrode. The electrode was tested on an electrical test bench and on human subjects in four modalities of EEG activity, namely: (1) spontaneous EEG, (2) sensory event-related potentials, (3) brain stem potentials, and (4) cognitive event-related potentials. The performance of the dry electrode compared favorably with that of the standard wet electrodes in terms of skin preparation, no gel requirements (dry), and higher signal-to-noise ratio.[57]
In 1999 researchers at
In 2018, a functional dry electrode composed of a polydimethylsiloxane elastomer filled with conductive carbon nanofibers was reported. This research was conducted at the U.S. Army Research Laboratory.[59] EEG technology often involves applying a gel to the scalp which facilitates strong signal-to-noise ratio. This results in more reproducible and reliable experimental results. Since patients dislike having their hair filled with gel, and the lengthy setup requires trained staff on hand, utilizing EEG outside the laboratory setting can be difficult.[60] Additionally, it has been observed that wet electrode sensors' performance reduces after a span of hours.[59] Therefore, research has been directed to developing dry and semi-dry EEG bioelectronic interfaces.[citation needed]
Dry electrode signals depend upon mechanical contact. Therefore, it can be difficult getting a usable signal because of impedance between the skin and the electrode.[60][59] Some EEG systems attempt to circumvent this issue by applying a saline solution.[61] Others have a semi dry nature and release small amounts of the gel upon contact with the scalp.[60] Another solution uses spring loaded pin setups. These may be uncomfortable. They may also be dangerous if they were used in a situation where a patient could bump their head since they could become lodged after an impact trauma incident.[59]
Currently, headsets are available incorporating dry electrodes with up to 30 channels.[62] Such designs are able to compensate for some of the signal quality degradation related to high impedances by optimizing pre-amplification, shielding and supporting mechanics.[63]
Limitations
EEG has several limitations. Most important is its poor spatial resolution.
EEG recordings do not directly capture axonal
Not only do EEGs capture dendritic currents almost exclusively as opposed to axonal currents, they also show a preference for activity on populations of parallel dendrites and transmitting current in the same direction at the same time.
Therefore, EEG provides information with a large bias to select neuron types, and generally should not be used to make claims about global brain activity. The meninges, cerebrospinal fluid and skull "smear" the EEG signal, obscuring its intracranial source.
It is mathematically impossible to reconstruct a unique intracranial current source for a given EEG signal,
EEG vis-à-vis fMRI, fNIRS, fUS and PET
EEG has several strong points as a tool for exploring brain activity. EEGs can detect changes over milliseconds, which is excellent considering an
EEG can be used simultaneously with fMRI or fUS so that high-temporal-resolution data can be recorded at the same time as high-spatial-resolution data, however, since the data derived from each occurs over a different time course, the data sets do not necessarily represent exactly the same brain activity. There are technical difficulties associated with combining EEG and fMRI including the need to remove the MRI gradient artifact present during MRI acquisition. Furthermore, currents can be induced in moving EEG electrode wires due to the magnetic field of the MRI.
EEG can be used simultaneously with NIRS or fUS without major technical difficulties. There is no influence of these modalities on each other and a combined measurement can give useful information about electrical activity as well as hemodynamics at medium spatial resolution.
EEG vis-à-vis MEG
EEG reflects correlated synaptic activity caused by
Normal activity
-
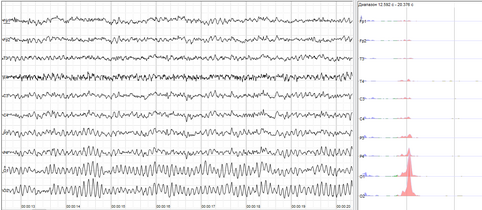 Human EEG with prominent resting state activity – alpha-rhythm. Left: EEG traces (horizontal – time in seconds; vertical – amplitudes, scale 100 μV). Right: power spectra of shown signals (vertical lines – 10 and 20 Hz, scale is linear). Alpha-rhythm consists of sinusoidal-like waves with frequencies in 8–12 Hz range (11 Hz in this case) more prominent in posterior sites. Alpha range is red at power spectrum graph.
 -
 Human EEG with in resting state. Left: EEG traces (horizontal – time in seconds; vertical – amplitudes, scale 100 μV). Right: power spectra of shown signals (vertical lines – 10 and 20 Hz, scale is linear). 80–90% of people have prominent sinusoidal-like waves with frequencies in 8–12 Hz range – alpha rhythm. Others (like this) lack this type of activity.
 -
 Common artifacts in human EEG. 1: Electrooculographic artifact caused by the excitation of eyeball's muscles (related to blinking, for example). Big-amplitude, slow, positive wave prominent in frontal electrodes. 2: Electrode's artifact caused by bad contact (and thus bigger impedance) between P3 electrode and skin. 3: Swallowing artifact. 4: Common reference electrode's artifact caused by bad contact between reference electrode and skin. Huge wave similar in all channels.
 -
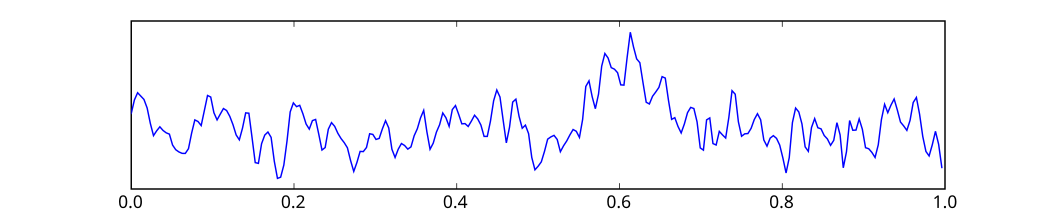 One second of EEG signal


The EEG is typically described in terms of (1) rhythmic activity and (2) transients. The rhythmic activity is divided into bands by frequency. To some degree, these frequency bands are a matter of nomenclature (i.e., any rhythmic activity between 8–12 Hz can be described as "alpha"), but these designations arose because rhythmic activity within a certain frequency range was noted to have a certain distribution over the scalp or a certain biological significance. Frequency bands are usually extracted using spectral methods (for instance Welch) as implemented for instance in freely available EEG software such as EEGLAB or the Neurophysiological Biomarker Toolbox. Computational processing of the EEG is often named quantitative electroencephalography (qEEG).
Most of the cerebral signal observed in the scalp EEG falls in the range of 1–20 Hz (activity below or above this range is likely to be artifactual, under standard clinical recording techniques). Waveforms are subdivided into bandwidths known as alpha, beta, theta, and delta to signify the majority of the EEG used in clinical practice.[69]
Comparison of EEG bands
| Band | Frequency (Hz) | Location | Normally | Pathologically |
|---|---|---|---|---|
| Delta | < 4 | frontally in adults, posteriorly in children; high-amplitude waves |
|
|
| Theta | 4–7 | Found in locations not related to task at hand |
|
|
Alpha
|
8–12 | posterior regions of head, both sides, higher in amplitude on dominant side. Central sites (c3-c4) at rest |
|
|
| Beta | 13–30 | both sides, symmetrical distribution, most evident frontally; low-amplitude waves |
|
|
| Gamma | > 32 | Somatosensory cortex |
| |
| Mu | 8–12 | Sensorimotor cortex |
|
|
The practice of using only whole numbers in the definitions comes from practical considerations in the days when only whole cycles could be counted on paper records. This leads to gaps in the definitions, as seen elsewhere on this page. The theoretical definitions have always been more carefully defined to include all frequencies. Unfortunately there is no agreement in standard reference works on what these ranges should be – values for the upper end of alpha and lower end of beta include 12, 13, 14 and 15. If the threshold is taken as 14 Hz, then the slowest beta wave has about the same duration as the longest spike (70 ms), which makes this the most useful value.

Wave patterns

- Delta waves is the frequency range up to 4 Hz. It tends to be the highest in amplitude and the slowest waves. It is seen normally in adults in slow-wave sleep. It is also seen normally in babies. It may occur focally with subcortical lesions and in general distribution with diffuse lesions, metabolic encephalopathy hydrocephalus or deep midline lesions. It is usually most prominent frontally in adults (e.g. FIRDA – frontal intermittent rhythmic delta) and posteriorly in children (e.g. OIRDA – occipital intermittent rhythmic delta).
- Theta is the frequency range from 4 Hz to 7 Hz. Theta is seen normally in young children. It may be seen in drowsiness or arousal in older children and adults; it can also be seen in meditation.[76] Excess theta for age represents abnormal activity. It can be seen as a focal disturbance in focal subcortical lesions; it can be seen in generalized distribution in diffuse disorder or metabolic encephalopathy or deep midline disorders or some instances of hydrocephalus. On the contrary this range has been associated with reports of relaxed, meditative, and creative states.

- named the first rhythmic EEG activity he observed the "alpha wave". This was the "posterior basic rhythm" (also called the "posterior dominant rhythm" or the "posterior alpha rhythm"), seen in the posterior regions of the head on both sides, higher in amplitude on the dominant side. It emerges with closing of the eyes and with relaxation, and attenuates with eye opening or mental exertion. The posterior basic rhythm is actually slower than 8 Hz in young children (therefore technically in the theta range).
- In addition to the posterior basic rhythm, there are other normal alpha rhythms such as the Alpha can be abnormal; for example, an EEG that has diffuse alpha occurring in coma and is not responsive to external stimuli is referred to as "alpha coma".

- benzodiazepines. It may be absent or reduced in areas of cortical damage. It is the dominant rhythm in patients who are alert or anxious or who have their eyes open.

- Gamma is the frequency range approximately 30–100 Hz. Gamma rhythms are thought to represent binding of different populations of neurons together into a network for the purpose of carrying out a certain cognitive or motor function.[10]
- Mu range is 8–13 Hz and partly overlaps with other frequencies. It reflects the synchronous firing of motor neurons in rest state. Mu suppression is thought to reflect motor mirror neuron systems, because when an action is observed, the pattern extinguishes, possibly because the normal and mirror neuronal systems "go out of sync" and interfere with one other.[75]
"Ultra-slow" or "near-DC" activity is recorded using DC amplifiers in some research contexts. It is not typically recorded in a clinical context because the signal at these frequencies is susceptible to a number of artifacts.
Some features of the EEG are transient rather than rhythmic. Spikes and sharp waves may represent seizure activity or
There are types of activity that are statistically uncommon, but not associated with dysfunction or disease. These are often referred to as "normal variants". The mu rhythm is an example of a normal variant.
The normal electroencephalogram (EEG) varies by age. The prenatal EEG and neonatal EEG is quite different from the adult EEG. Fetuses in the third trimester and newborns display two common brain activity patterns: "discontinuous" and "trace alternant." "Discontinuous" electrical activity refers to sharp bursts of electrical activity followed by low frequency waves. "Trace alternant" electrical activity describes sharp bursts followed by short high amplitude intervals and usually indicates quiet sleep in newborns.[81] The EEG in childhood generally has slower frequency oscillations than the adult EEG.
The normal EEG also varies depending on state. The EEG is used along with other measurements (EOG, EMG) to define sleep stages in polysomnography. Stage I sleep (equivalent to drowsiness in some systems) appears on the EEG as drop-out of the posterior basic rhythm. There can be an increase in theta frequencies. Santamaria and Chiappa cataloged a number of the variety of patterns associated with drowsiness. Stage II sleep is characterized by sleep spindles – transient runs of rhythmic activity in the 12–14 Hz range (sometimes referred to as the "sigma" band) that have a frontal-central maximum. Most of the activity in Stage II is in the 3–6 Hz range. Stage III and IV sleep are defined by the presence of delta frequencies and are often referred to collectively as "slow-wave sleep". Stages I–IV comprise non-REM (or "NREM") sleep. The EEG in REM (rapid eye movement) sleep appears somewhat similar to the awake EEG.
EEG under general anesthesia depends on the type of anesthetic employed. With halogenated anesthetics, such as halothane or intravenous agents, such as propofol, a rapid (alpha or low beta), nonreactive EEG pattern is seen over most of the scalp, especially anteriorly; in some older terminology this was known as a WAR (widespread anterior rapid) pattern, contrasted with a WAIS (widespread slow) pattern associated with high doses of opiates. Anesthetic effects on EEG signals are beginning to be understood at the level of drug actions on different kinds of synapses and the circuits that allow synchronized neuronal activity.[82]
Artifacts

EEG is an extremely useful technique for studying brain activity, but the signal measured is always contaminated by
Artifact removal
It is important to be able to distinguish artifacts from genuine brain activity in order to prevent incorrect interpretations of EEG data. General approaches for the removal of artifacts from the data are, prevention, rejection and cancellation. The goal of any approach is to develop methodology capable of identifying and removing artifacts without affecting the quality of the EEG signal. As artifact sources are quite different the majority of researchers focus on developing algorithms that will identify and remove a single type of noise in the signal. Simple filtering using a notch filter is commonly employed to reject components with a 50/60 Hz frequency. However such simple filters are not an appropriate choice for dealing with all artifacts, as for some, their frequencies will overlap with the EEG frequencies.
Regression algorithms have a moderate computation cost and are simple. They represented the most popular correction method up until the mid-1990s when they were replaced by "blind source separation" type methods. Regression algorithms work on the premise that all artifacts are comprised by one or more reference channels. Subtracting these reference channels from the other contaminated channels, in either the time or frequency domain, by estimating the impact of the reference channels on the other channels, would correct the channels for the artifact. Although the requirement of reference channels ultimately lead to this class of algorithm being replaced, they still represent the benchmark to which modern algorithms are evaluated against.[84] Blind source separation (BSS) algorithms employed to remove artifacts include principal component analysis (PCA) and independent component analysis (ICA) and several algorithms in this class have been successful at tackling most physiological artifacts.[84]
Physiological artifacts
Ocular artifacts
Ocular artifacts affect the EEG signal significantly. This is due to eye movements involving a change in electric fields surrounding the eyes, distorting the electric field over the scalp, and as EEG is recorded on the scalp, it therefore distorts the recorded signal. A difference of opinion exists among researchers, with some arguing ocular artifacts are, or may be reasonably described as a single generator, whilst others argue it is important to understand the potentially complicated mechanisms. Three potential mechanisms have been proposed to explain the ocular artifact.
The first is corneal retinal dipole movement which argues that an electric dipole is formed between the cornea and retina, as the former is positively and the latter negatively charged. When the eye moves, so does this dipole which impacts the electrical field over the scalp, this is the most standard view. The second mechanism is retinal dipole movement, which is similar to the first but differing in that it argues there is a potential difference, hence dipole across the retina with the cornea having little effect. The third mechanism is eyelid movement. It is known that there is a change in voltage around the eyes when the eyelid moves, even if the eyeball does not. It is thought that the eyelid can be described as a sliding potential source and that the impacting of blinking is different to eye movement on the recorded EEG.[85]
Eyelid fluttering artifacts of a characteristic type were previously called Kappa rhythm (or Kappa waves). It is usually seen in the prefrontal leads, that is, just over the eyes. Sometimes they are seen with mental activity. They are usually in the Theta (4–7 Hz) or Alpha (7–14 Hz) range. They were named because they were believed to originate from the brain. Later study revealed they were generated by rapid fluttering of the eyelids, sometimes so minute that it was difficult to see. They are in fact noise in the EEG reading, and should not technically be called a rhythm or wave. Therefore, current usage in electroencephalography refers to the phenomenon as an eyelid fluttering artifact, rather than a Kappa rhythm (or wave).[86]
The propagation of the ocular artifact is impacted by multiple factors including the properties of the subject's skull, neuronal tissues and skin but the signal may be approximated as being inversely proportional to the distance from the eyes squared. The electrooculogram (EOG) consists of a series of electrodes measuring voltage changes close to the eye and is the most common tool for dealing with the eye movement artifact in the EEG signal.[85]
Muscular artifacts
Another source of artifacts are various muscle movements across the body. This particular class of artifact is usually recorded by all electrodes on the scalp due to myogenic activity (increase or decrease of blood pressure). The origin of these artifacts have no single location and arises from functionally independent muscle groups, meaning the characteristics of the artifact are not constant. The observed patterns due to muscular artifacts will change depending on subject sex, the particular muscle tissue, and its degree of contraction. The frequency range for muscular artifacts is wide and overlaps with every classic EEG rhythm. However most of the power is concentrated in the lower range of the observed frequencies of 20 to 300 Hz making the gamma band particularly susceptible to muscular artifacts. Some muscle artifacts may have activity with a frequency as low as 2 Hz, so delta and theta bands may also be affected by muscle activity. Muscular artifacts may impact sleep studies, as unconscious bruxism (grinding of teeth) movements or snoring can seriously impact the quality of the recorded EEG. In addition the recordings made of epilepsy patients may be significantly impacted by the existence of muscular artifacts.[87]
Cardiac artifacts
The potential due to cardiac activity introduces electrocardiograph (ECG) errors in the EEG.[88] Artifacts arising due to cardiac activity may be removed with the help of an ECG reference signal.[83]
Other physiological artifacts
Glossokinetic artifacts are caused by the potential difference between the base and the tip of the tongue. Minor tongue movements can contaminate the EEG, especially in parkinsonian and tremor disorders.[citation needed]
Environmental artifacts
In addition to artifacts generated by the body, many artifacts originate from outside the body. Movement by the patient, or even just settling of the electrodes, may cause electrode pops, spikes originating from a momentary change in the impedance of a given electrode. Poor grounding of the EEG electrodes can cause significant 50 or 60 Hz artifact, depending on the local power system's frequency. A third source of possible interference can be the presence of an IV drip; such devices can cause rhythmic, fast, low-voltage bursts, which may be confused for spikes.[citation needed]
Abnormal activity
Abnormal activity can broadly be separated into
Focal epileptiform discharges represent fast, synchronous potentials in a large number of neurons in a somewhat discrete area of the brain. These can occur as interictal activity, between seizures, and represent an area of cortical irritability that may be predisposed to producing epileptic seizures. Interictal discharges are not wholly reliable for determining whether a patient has epilepsy nor where his/her seizure might originate. (See
Generalized epileptiform discharges often have an anterior maximum, but these are seen synchronously throughout the entire brain. They are strongly suggestive of a generalized epilepsy.
Focal non-epileptiform abnormal activity may occur over areas of the brain where there is focal damage of the cortex or white matter. It often consists of an increase in slow frequency rhythms and/or a loss of normal higher frequency rhythms. It may also appear as focal or unilateral decrease in amplitude of the EEG signal.
Diffuse non-epileptiform abnormal activity may manifest as diffuse abnormally slow rhythms or bilateral slowing of normal rhythms, such as the PBR.
Intracortical Encephalogram electrodes and sub-dural electrodes can be used in tandem to discriminate and discretize artifact from epileptiform and other severe neurological events.
More advanced measures of abnormal EEG signals have also recently received attention as possible biomarkers for different disorders such as Alzheimer's disease.[89]
Remote communication
Systems for decoding imagined speech from EEG have applications such as in brain–computer interfaces.[90]
EEG diagnostics
The
Combat personnel often develop PTSD and mTBI in correlation. Both conditions present with altered low-frequency brain wave oscillations.[92] Altered brain waves from PTSD patients present with decreases in low-frequency oscillations, whereas, mTBI injuries are linked to increased low-frequency wave oscillations. Effective EEG diagnostics can help doctors accurately identify conditions and appropriately treat injuries in order to mitigate long-term effects.[93]
Traditionally, clinical evaluation of EEGs involved visual inspection. Instead of a visual assessment of brain wave oscillation topography, quantitative electroencephalography (qEEG), computerized algorithmic methodologies, analyzes a specific region of the brain and transforms the data into a meaningful "power spectrum" of the area.[91] Accurately differentiating between mTBI and PTSD can significantly increase positive recovery outcomes for patients especially since long-term changes in neural communication can persist after an initial mTBI incident.[93]
Another common measurement made from EEG data is that of complexity measures such as
which are associated with particular pathologies or pathology stages.Economics
Inexpensive EEG devices exist for the low-cost research and consumer markets. Recently, a few companies have miniaturized medical grade EEG technology to create versions accessible to the general public. Some of these companies have built commercial EEG devices retailing for less than US$100.
- In 2004 OpenEEG released its ModularEEG as open source hardware. Compatible open source software includes a game for balancing a ball.
- In 2007 NeuroSky released the first affordable consumer based EEG along with the game NeuroBoy. This was also the first large scale EEG device to use dry sensor technology.[94]
- In 2008 OCZ Technology developed device for use in video games relying primarily on electromyography.
- In 2008 the Final Fantasy developer Square Enix announced that it was partnering with NeuroSky to create a game, Judecca.[95][96]
- In 2009 Mattel partnered with NeuroSky to release the Mindflex, a game that used an EEG to steer a ball through an obstacle course. By far the best-selling consumer based EEG to date.[95][97]
- In 2009 Uncle Milton Industries partnered with NeuroSky to release the Star Wars Force Trainer, a game designed to create the illusion of possessing the Force.[95][98]
- In 2010, NeuroSky added a blink and electromyography function to the MindSet.[99]
- In 2011, NeuroSky released the MindWave, an EEG device designed for educational purposes and games.[100] The MindWave won the Guinness Book of World Records award for "Heaviest machine moved using a brain control interface".[101]
- In 2012, a Japanese gadget project, neurowear, released Necomimi: a headset with motorized cat ears. The headset is a NeuroSky MindWave unit with two motors on the headband where a cat's ears might be. Slipcovers shaped like cat ears sit over the motors so that as the device registers emotional states the ears move to relate. For example, when relaxed, the ears fall to the sides and perk up when excited again.
- In 2014, and the Arduino or PIC microcontroller, and initially costed $399 before increasing in price to $999. It uses standard metal cup electrodes and conductive paste.
- In 2015, Mind Solutions Inc released the smallest consumer BCI to date, the NeuroSync. This device functions as a dry sensor at a size no larger than a Bluetooth ear piece.[102]
- In 2015, A Chinese-based company Android App Stores.[103]
- In 2021, BioSerenity release the Neuronaute and Icecap a single-use disposable EEG headset that allows recording with equivalent quality to traditional cup electrodes.[104][105]
Future research
The EEG has been used for many purposes besides the conventional uses of clinical diagnosis and conventional cognitive neuroscience. An early use was during World War II by the U.S. Army Air Corps to screen out pilots in danger of having seizures;
The EEG is altered by drugs that affect brain functions, the chemicals that are the basis for psychopharmacology. Berger's early experiments recorded the effects of drugs on EEG. The science of pharmaco-electroencephalography has developed methods to identify substances that systematically alter brain functions for therapeutic and recreational use.
Honda is attempting to develop a system to enable an operator to control its
EEGs have been used as evidence in criminal trials in the Indian state of Maharashtra.[109][110] Brain Electrical Oscillation Signature Profiling (BEOS), an EEG technique, was used in the trial of State of Maharashtra v. Sharma to show Sharma remembered using arsenic to poison her ex-fiancé, although the reliability and scientific basis of BEOS is disputed.[111]
A lot of research is currently being carried out in order to make EEG devices smaller, more portable and easier to use. So called "Wearable EEG" is based upon creating low power wireless collection electronics and 'dry' electrodes which do not require a conductive gel to be used.[112] Wearable EEG aims to provide small EEG devices which are present only on the head and which can record EEG for days, weeks, or months at a time, as ear-EEG. Such prolonged and easy-to-use monitoring could make a step change in the diagnosis of chronic conditions such as epilepsy, and greatly improve the end-user acceptance of BCI systems.[113] Research is also being carried out on identifying specific solutions to increase the battery lifetime of Wearable EEG devices through the use of the data reduction approach.
In research, currently EEG is often used in combination with
EEG signals from musical performers were used to create instant compositions and one CD by the Brainwave Music Project, run at the
History


In 1875,
In 1912, Ukrainian physiologist Vladimir Vladimirovich Pravdich-Neminsky published the first animal EEG and the evoked potential of the mammalian (dog).[125] In 1914, Napoleon Cybulski and Jelenska-Macieszyna photographed EEG recordings of experimentally induced seizures.[citation needed]
German physiologist and psychiatrist
In 1934, Fisher and Lowenbach first demonstrated epileptiform spikes. In 1935,
Franklin Offner (1911–1999), professor of biophysics at Northwestern University developed a prototype of the EEG that incorporated a piezoelectric inkwriter called a Crystograph (the whole device was typically known as the Offner Dynograph).
In 1947, The American EEG Society was founded and the first International EEG congress was held. In 1953 Aserinsky and Kleitman described REM sleep.
In the 1950s, William Grey Walter developed an adjunct to EEG called EEG topography, which allowed for the mapping of electrical activity across the surface of the brain. This enjoyed a brief period of popularity in the 1980s and seemed especially promising for psychiatry. It was never accepted by neurologists and remains primarily a research tool.
An electroencephalograph system manufactured by Beckman Instruments was used on at least one of the Project Gemini manned spaceflights (1965–1966) to monitor the brain waves of astronauts on the flight. It was one of many Beckman Instruments specialized for and used by NASA.[129]
The first instance of the use of EEG to control a physical object, a robot, was in 1988. The robot would follow a line or stop depending on the alpha activity of the subject. If the subject relaxed and closed their eyes therefore increasing alpha activity, the bot would move. Opening their eyes thus decreasing alpha activity would cause the robot to stop on the trajectory.[130]
In October 2018, scientists connected the brains of three people to experiment with the process of thoughts sharing. Five groups of three people participated in the experiment using EEG. The success rate of the experiment was 81%.[131]
See also
- Amplitude integrated electroencephalography
- Binaural beats
- Brainwave synchronization
- Cerebral function monitoring
- Comparison of consumer brain-computer interface devices
- Direct brain interfaces
- EEG measures during anesthesia
- EEG microstates
- Electromagnetic pulse
- Electroneurogram
- Electropalatograph
- Emotiv Systems
- European data format
- FieldTrip
- God helmet
- Hemoencephalography
- Hypersynchronization of electrophysiological activity in epilepsy
- Induced activity
- Local field potentials
- Magnetoencephalography
- Mind machine
- Neural oscillations
- Neural synchrony
- Ongoing brain activity
- Michael Graham Saunders
- Spontaneous potential
- EEG analysis
References
- .
- ^ OCLC 1199587061.
- ^ "EEG: MedlinePlus Medical Encyclopedia". medlineplus.gov. Archived from the original on July 5, 2016. Retrieved July 24, 2022.
- ISBN 978-1-4557-0694-5.
- ^ from the original on October 23, 2022. Retrieved October 23, 2022.
- from the original on October 23, 2022. Retrieved October 23, 2022.
- ^ "The Yield of Ambulatory Video-EEG - Predictors of Successful Event Capture". Neurology Clinical Practice. Retrieved December 5, 2023.
- PMID 23402893.
- ^ "EEG (Electroencephalogram) – Mayo Clinic". Mayo Clinic. Archived from the original on August 30, 2019. Retrieved August 30, 2019.
- ^ ISBN 978-0-7817-5126-1.[page needed]
- PMID 27590970.
- PMID 26372528.
- S2CID 3746307.
- from the original on October 7, 2022. Retrieved October 7, 2022.
- ^ PMID 26594331.
- PMID 10082088.
- PMID 22558648.
- ^ from the original on January 26, 2019. Retrieved September 10, 2018.
- S2CID 208592165.
- ISBN 978-1-4244-4123-5.
- PMID 9084025.
- PMID 8798169.
- ^ PMID 17392732.
- ISBN 978-0-323-14700-2.
- S2CID 11857440.
- S2CID 33780406.
- S2CID 19466604.
- PMID 23193115.
- Lay summary in: "Sleep study reveals how the adolescent brain makes the transition to mature thinking". ScienceDaily (Press release). March 19, 2013.
- ^ Srinivasan R (1999). "Methods to Improve the Spatial Resolution of EEG". International Journal. 1 (1): 102–11.
- PMID 18990257.
- ^ Schlögl A, Slater M, Pfurtscheller G (2002). "Presence research and EEG" (PDF). Archived (PDF) from the original on August 11, 2017. Retrieved August 24, 2013.
- PMID 33019375.
- PMID 38565857.
- S2CID 145788101.
- S2CID 11716369.
- PMID 12165350.
- S2CID 6272011.
- ^ US patent 7286871, Mark S. Cohen, "Method and apparatus for reducing contamination of an electrical signal", published 2004-05-20
- PMID 18791470.
- S2CID 250761006.
- PMID 25761059.
- S2CID 31790623.
- ^ Bird J, Manso LJ, Ekart A, Faria DR (September 2018). A Study on Mental State Classification using EEG-based Brain-Machine Interface. Madeira Island, Portugal: 9th international Conference on Intelligent Systems 2018. Retrieved December 3, 2018.
- ^ Bird JJ, Ekart A, Buckingham CD, Faria DR (2019). Mental Emotional Sentiment Classification with an EEG-based Brain-Machine Interface. St Hugh's College, University of Oxford, United Kingdom: The International Conference on Digital Image and Signal Processing (DISP'19). Archived from the original on December 3, 2018. Retrieved December 3, 2018.
- PMID 29549239.
- PMID 19915731.
- ^ Tatum WO, Husain AM, Benbadis SR (2008). Handbook of EEG Interpretation. Demos Medical Publishing.[page needed]
- ^ ISBN 978-0-19-502796-9.[page needed]
- ISBN 978-0-7167-9922-1.[page needed]
- S2CID 17650488.
- PMID 7678386.
- PMID 8195424.
- S2CID 25988980.
- S2CID 250847914.
- S2CID 38459560.
- from the original on December 22, 2019. Retrieved December 10, 2019.
- Bibcode:1994PhDT........82A.
- ^ Hockenberry J (August 2001). "The Next Brainiacs". Wired Magazine.
- ^ PMID 29408942.
- ^ S2CID 26744679.
- ISSN 0924-4247.
- ^ "Dry EEG Headsets | Products | CGX". CGX 2021. Archived from the original on February 13, 2020. Retrieved February 13, 2020.
- ^ "Dry EEG Technology". CGX LLC. Archived from the original on February 13, 2020. Retrieved February 13, 2020.
- PMID 25147541.
- PMID 16613883.
- ISBN 978-0-7167-0110-1.
- PMID 4161317.
- ISBN 978-0-19-530106-9.[page needed]
- PMID 24783746.
- ^ S2CID 18850757.
- PMID 27977700.
- PMID 17008125.
- PMID 17371495.
- PMID 13014777.
- ^ PMID 15993757.
- S2CID 2151810.
- PMID 19300566.
- PMID 9202993.
- PMID 11673699.
- S2CID 24756702.
- S2CID 45733681.
- ^ "The MacIver Lab". Stanford University. Archived from the original on November 23, 2008. Retrieved December 16, 2006.
- ^ PMID 30813520.
- ^ S2CID 214596892.
- ^ from the original on July 31, 2020. Retrieved December 19, 2022.
- ISBN 978-0-397-50598-2.[page needed]
- S2CID 116693954.
- from the original on December 20, 2022, retrieved December 20, 2022
- PMID 19164579.
- PMID 33994922.
- ^ PMID 25698950.
- PMID 27238074.
- ^ a b "Study: EEG can help tell apart PTSD, mild traumatic brain injury". www.research.va.gov. Archived from the original on October 9, 2019. Retrieved October 9, 2019.
- ^ "Mind Games". The Economist. March 23, 2007. Archived from the original on December 12, 2009. Retrieved August 12, 2010.
- ^ a b c Li S (August 8, 2010). "Mind reading is on the market". Los Angeles Times. Archived from the original on January 4, 2013.
- ^ Fruhlinger J (October 9, 2008). "Brains-on with NeuroSky and Square Enix's Judecca mind-control game". Engadget. Archived from the original on October 30, 2010. Retrieved December 2, 2010.
- ^ "New games powered by brain waves". Physorg.com. Archived from the original on June 6, 2011. Retrieved December 2, 2010.
- ^ Snider M (January 7, 2009). "Toy trains 'Star Wars' fans to use The Force". USA Today. Archived from the original on October 23, 2012. Retrieved May 1, 2010.
- ^ "News – NeuroSky Upgrades SDK, Allows For Eye Blink, Brainwave-Powered Games". Gamasutra. June 30, 2010. Archived from the original on February 22, 2017. Retrieved December 2, 2010.
- ^ Fiolet E. "NeuroSky MindWave Brings Brain-Computer Interface to Education". www.ubergizmo.com. Ubergizmo. Archived from the original on December 12, 2017. Retrieved May 18, 2015.
- ^ "NeuroSky MindWave Sets Guinness World Record for "Largest Object Moved Using a Brain-Computer Interface"". NeuroGadget.com. NeuroGadget. Archived from the original on October 15, 2013. Retrieved June 2, 2011.
- ^ "Product Launch! Neurosync – The World's Smallest Brain-Computer-Interface". www.prnewswire.com. July 15, 2015. Archived from the original on December 9, 2018. Retrieved July 21, 2017.
- ^ "APP – Macrotellect". o.macrotellect.com. Archived from the original on January 23, 2017. Retrieved December 8, 2016.
- ^ "510(k) Premarket Notification". www.accessdata.fda.gov. Archived from the original on November 12, 2021. Retrieved November 12, 2021.
- ^ niamhcurran (January 8, 2021). "BioSerenity receives FDA clearance for EEG wearable device system". NeuroNews International. Archived from the original on November 12, 2021. Retrieved November 12, 2021.
- PMID 16789311. Archived from the originalon February 12, 2016.
- S2CID 206099640.
- ^ "Mind over matter: Brain waves control Asimo". Japan Times. April 1, 2009. Archived from the original on April 3, 2009.
- ^ Natu N (July 21, 2008). "This brain test maps the truth". The Times of India. Archived from the original on July 18, 2012. Retrieved April 14, 2021.
- ^ Puranik DA, Jospeh SK, Daundkar BB, Garad MV (November 2009). Brain Signature Profiling In India: Its Status As An Aid In Investigation And As Corroborative Evidence-As Seen From Judgments (PDF). Proceedings of XX All India Forensic Science Conference. pp. 815–822. Archived from the original (PDF) on March 3, 2016.
- from the original on April 16, 2021. Retrieved March 20, 2019.
- S2CID 1891995.
- S2CID 14103460.
- PMID 29488902.
- S2CID 44504680.
- ^ Buettner R, Frick J, Rieg T (November 12, 2019). "High-performance detection of epilepsy in seizure-free EEG recordings: A novel machine learning approach using very specific epileptic EEG sub-bands". ICIS 2019 Proceedings. Archived from the original on January 21, 2021. Retrieved January 13, 2021.
- S2CID 209510497.
- S2CID 3522546.
- PMID 32352037.
- PMID 32457378.
- S2CID 3376296.
- S2CID 122563425.
- PMID 35603010.
- S2CID 205664545.
- ^ Pravdich-Neminsky VV (1913). "Ein Versuch der Registrierung der elektrischen Gehirnerscheinungen". Zentralblatt für Physiologie. 27: 951–60.
- PMID 12486257.
- ^ Millet D (June 2002). The origins of EEG. 7th Annual Meeting of the International Society for the History of the Neurosciences (ISHN). Archived from the original on September 8, 2020. Retrieved November 27, 2010.
- .
- ^ "Beckman Instruments Supplying Medical Flight Monitoring Equipment" (PDF). Space News Roundup. March 3, 1965. pp. 4–5. Archived (PDF) from the original on August 7, 2019. Retrieved August 7, 2019.
- ISBN 978-3-642-37169-1. Archivedfrom the original on January 13, 2023. Retrieved January 13, 2023.
- PMID 30992474.
Further reading
- Nunez PL, Srinivasan R (2007). "PDF". .
- Arns M, Sterman MB (2019). Neurofeedback: How it all started. Nijmegen, The Netherlands: Brainclinics Insights. ISBN 978-90-830013-0-2.
External links
- "A tutorial on simulating and estimating EEG sources in Matlab". Archived from the original on March 7, 2016.
- "A tutorial on analysis of ongoing, evoked, and induced neuronal activity: Power spectra, wavelet analysis, and coherence". Archived from the original on November 7, 2018.