
Energy flow (ecology)

Energy flow is the flow of
The unidirectional flow of energy and the successive loss of energy as it travels up the
Energetics and the carbon cycle

100×1015 grams of carbon/year fixed by photosynthetic organisms, which is equivalent to 4×10¹⁸ kJ/yr = 4×10²¹ J/yr of free energy.Cellular respiration is the reverse reaction, wherein energy of plants is taken in and carbon dioxide and water are given off. The carbon dioxide and water produced can be recycled back into plants.
The first step in energetics is photosynthesis, wherein water and carbon dioxide from the air are taken in with energy from the sun, and are converted into oxygen and glucose.[7] Cellular respiration is the reverse reaction, wherein oxygen and sugar are taken in and release energy as they are converted back into carbon dioxide and water. The carbon dioxide and water produced by respiration can be recycled back into plants.
Energy loss can be measured either by efficiency (how much energy makes it to the next level), or by
Primary production
A
One of the factors that controls primary production is the amount of energy that enters the producer(s), which can be measured using productivity.[12][13][1] Only one percent of solar energy enters the producer, the rest bounces off or moves through.[13] Gross primary productivity is the amount of energy the producer actually gets.[13][14] Generally, 60% of the energy that enters the producer goes to the producer’s own respiration.[12] The net primary productivity is the amount that the plant retains after the amount that it used for cellular respiration is subtracted.[13] Another factor controlling primary production is organic/inorganic nutrient levels in the water or soil that the producer is living in.[14]
Secondary production
Secondary production is the use of energy stored in plants converted by consumers to their own biomass. Different ecosystems have different levels of consumers, all end with one top consumer. Most energy is stored in organic matter of plants, and as the consumers eat these plants they take up this energy. This energy in the herbivores and omnivores is then consumed by
In aquatic environments
Heterotrophs contribute to secondary production and it is dependent on primary productivity and the net primary products.
In terrestrial environments
Secondary production is often described in terms of trophic levels, and while this can be useful in explaining relationships it overemphasizes the rarer interactions. Consumers often feed at multiple trophic levels.[18] Energy transferred above the third trophic level is relatively unimportant.[18] The assimilation efficiency can be expressed by the amount of food the consumer has eaten, how much the consumer assimilates and what is expelled as feces or urine.[19] While a portion of the energy is used for respiration, another portion of the energy goes towards biomass in the consumer.[16] There are two major food chains: The primary food chain is the energy coming from autotrophs and passed on to the consumers; and the second major food chain is when carnivores eat the herbivores or decomposers that consume the autotrophic energy.[16] Consumers are broken down into primary consumers, secondary consumers and tertiary consumers. Carnivores have a much higher assimilation of energy, about 80% and herbivores have a much lower efficiency of approximately 20 to 50%.[16] Energy in a system can be affected by animal emigration/immigration. The movements of organisms are significant in terrestrial ecosystems.[17] Energetic consumption by herbivores in terrestrial ecosystems has a low range of ~3-7%.[17] The flow of energy is similar in many terrestrial environments. The fluctuation in the amount of net primary product consumed by herbivores is generally low. This is in large contrast to aquatic environments of lakes and ponds where grazers have a much higher consumption of around ~33%.[17] Ectotherms and endotherms have very different assimilation efficiencies.[16]
Detritivores
Detritus is a large portion of organic material in ecosystems. Organic material in temperate forests is mostly made up of dead plants, approximately 62%.[18]
In an aquatic ecosystem, leaf matter that falls into streams gets wet and begins to leech organic material. This happens rather quickly and will attract microbes and invertebrates. The leaves can be broken down into large pieces called coarse
Species effect and diversity in an ecosystem can be analyzed through their performance and efficiency.[21] In addition, secondary production in streams can be influenced heavily by detritus that falls into the streams; production of benthic fauna biomass and abundance decreased an additional 47–50% during a study of litter removal and exclusion.[20]
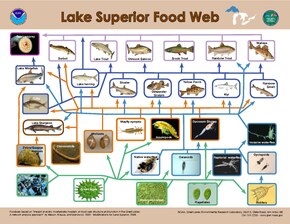
Energy flow across ecosystems
Research has demonstrated that primary producers
Aquatic vs terrestrial ecosystems
Much variation in the flow of energy is found within each type of ecosystem, creating a challenge in identifying variation between ecosystem types. In a general sense, the flow of energy is a function of primary productivity with temperature, water availability, and light availability.[25] For example, among aquatic ecosystems, higher rates of production are usually found in large rivers and shallow lakes than in deep lakes and clear headwater streams.[25] Among terrestrial ecosystems, marshes, swamps, and tropical rainforests have the highest primary production rates, whereas tundra and alpine ecosystems have the lowest.[25] The relationships between primary production and environmental conditions have helped account for variation within ecosystem types, allowing ecologists to demonstrate that energy flows more efficiently through aquatic ecosystems than terrestrial ecosystems due to the various bottom-up and top-down controls in play.[23]
Bottom-up
The strength of bottom-up controls on energy flow are determined by the nutritional quality, size, and growth rates of primary producers in an ecosystem.[14][22] Photosynthetic material is typically rich in nitrogen (N) and phosphorus (P) and supplements the high herbivore demand for N and P across all ecosystems.[26] Aquatic primary production is dominated by small, single-celled phytoplankton that are mostly composed of photosynthetic material, providing an efficient source of these nutrients for herbivores.[22] In contrast, multi-cellular terrestrial plants contain many large supporting cellulose structures of high carbon but low nutrient value.[22] Because of this structural difference, aquatic primary producers have less biomass per photosynthetic tissue stored within the aquatic ecosystem than in the forests and grasslands of terrestrial ecosystems.[22] This low biomass relative to photosynthetic material in aquatic ecosystems allows for a more efficient turnover rate compared to terrestrial ecosystems.[22] As phytoplankton are consumed by herbivores, their enhanced growth and reproduction rates sufficiently replace lost biomass and, in conjunction with their nutrient dense quality, support greater secondary production.[22]
Additional factors impacting primary production includes inputs of N and P, which occurs at a greater magnitude in aquatic ecosystems.
Top-down
Top-down mechanisms exert greater control on aquatic primary producers due to the roll of consumers within an aquatic food web.[24] Among consumers, herbivores can mediate the impacts of trophic cascades by bridging the flow of energy from primary producers to predators in higher trophic levels.[27] Across ecosystems, there is a consistent association between herbivore growth and producer nutritional quality.[26] However, in aquatic ecosystems, primary producers are consumed by herbivores at a rate four times greater than in terrestrial ecosystems.[22] Although this topic is highly debated, researchers have attributed the distinction in herbivore control to several theories, including producer to consumer size ratios and herbivore selectivity.[7]
Modeling of top-down controls on primary producers suggests that the greatest control on the flow of energy occurs when the size ratio of consumer to primary producer is the highest.[29] The size distribution of organisms found within a single trophic level in aquatic systems is much narrower than that of terrestrial systems.[22] On land, the consumer size ranges from smaller than the plant it consumes, such as an insect, to significantly larger, such as an ungulate, while in aquatic systems, consumer body size within a trophic level varies much less and is strongly correlated with trophic position.[22] As a result, the size difference between producers and consumers is consistently larger in aquatic environments than on land, resulting in stronger herbivore control over aquatic primary producers.[22]
Herbivores can potentially control the fate of
See also
- Food web – Natural interconnection of food chains
- Ecological stoichiometry
- Energy – Physical quantity
References
- ^ JSTOR 1930126. Archived from the original(PDF) on 2017-03-29. Retrieved 2020-12-04.
- ^ PMID 3672136.
- ^ S2CID 4424697.
- OCLC 908431622.
- OCLC 849744641.
- ^ "Carbon Cycle". Archived from the original on 12 August 2006.
- ^ ISBN 978-0-7923-5519-9..
100×1015 grams of carbon/year fixed by photosynthetic organisms, which is equivalent to 4×10¹⁸ kJ/yr = 4×10²¹ J/yr of free energy stored as reduced carbon.
- JSTOR 1933451.
- ISBN 978-1-319-01763-7.
- ^ PMID 23129626.
- ^ PMID 17819907.
- ^ ISBN 978-0-12-505290-0.
- ^ a b c d Sigman DM, Hain MP (2012). "The biological productivity of the ocean" (PDF). Nature Education Knowledge. 3 (6): 1–6.[permanent dead link]
- ^ S2CID 4384243.
- ^ OCLC 144222191.
- ^ )
- ^ JSTOR 1942301.
- ^ S2CID 55279332.
- PMID 26962141.
- ^ .
- S2CID 4426751.
- ^ PMID 16519227.
- ^ ISBN 978-1-316-29969-2.
- ^ PMID 18445030.
- ^ OCLC 40734932.
- ^ doi:10.1890/03-4019.
- ^ .
- S2CID 1752696.
- ISSN 1365-2656.
Further reading
- Podolinsky S (2004). "Socialism and the Unity of Physical Forces". S2CID 144332347.
- Weiner DR (2000). Models of Nature: Ecology, Conservation and Cultural Revolution in Soviet Russia. U.S.: University of Pittsburgh Press.