Evolutionary taxonomy
This article may be too technical for most readers to understand. (July 2018) |
Evolutionary taxonomy, evolutionary systematics or Darwinian classification is a branch of
Evolutionary taxonomy differs from strict pre-Darwinian Linnaean taxonomy (producing orderly lists only) in that it builds evolutionary trees. While in phylogenetic nomenclature each taxon must consist of a single ancestral node and all its descendants, evolutionary taxonomy allows for groups to be excluded from their parent taxa (e.g. dinosaurs are not considered to include birds, but to have given rise to them), thus permitting paraphyletic taxa.[2][3]
Origin of evolutionary taxonomy

Evolutionary taxonomy arose as a result of the influence of the theory of
Following the appearance of On the Origin of Species,
Following Darwin's publication,
The past three decades have seen a dramatic increase in the use of DNA sequences for reconstructing phylogeny and a parallel shift in emphasis from evolutionary taxonomy towards Hennig's 'phylogenetic systematics'.[7]
Today, with the advent of modern
New methods in modern evolutionary systematics
reliable, independent, third-party sources. (July 2018) ) |
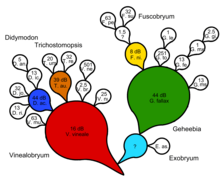
Efforts in combining modern methods of cladistics, phylogenetics, and DNA analysis with classical views of taxonomy have recently appeared. Certain authors have found that phylogenetic analysis is acceptable scientifically as long as paraphyly at least for certain groups is allowable. Such a stance is promoted in papers by Tod F. Stuessy[12] and others. A particularly strict form of evolutionary systematics has been presented by Richard H. Zander in a number of papers, but summarized in his "Framework for Post-Phylogenetic Systematics".[13]
Briefly, Zander's pluralistic systematics is based on the incompleteness of each of the theories: A method that cannot falsify a hypothesis is as unscientific as a hypothesis that cannot be falsified. Cladistics generates only trees of shared ancestry, not serial ancestry. Taxa evolving seriatim cannot be dealt with by analyzing shared ancestry with cladistic methods. Hypotheses such as adaptive radiation from a single ancestral taxon cannot be falsified with cladistics. Cladistics offers a way to cluster by trait transformations but no evolutionary tree can be entirely dichotomous. Phylogenetics posits shared ancestral taxa as causal agents for dichotomies yet there is no evidence for the existence of such taxa. Molecular systematics uses DNA sequence data for tracking evolutionary changes, thus paraphyly and sometimes phylogenetic polyphyly signal ancestor-descendant transformations at the taxon level, but otherwise molecular phylogenetics makes no provision for extinct paraphyly. Additional transformational analysis is needed to infer serial descent.

The Besseyan cactus or commagram is the best evolutionary tree for showing both shared and serial ancestry. First, a cladogram or natural key is generated. Generalized ancestral taxa are identified and specialized descendant taxa are noted as coming off the lineage with a line of one color representing the progenitor through time. A Besseyan cactus or commagram is then devised that represents both shared and serial ancestry. Progenitor taxa may have one or more descendant taxa. Support measures in terms of Bayes factors may be given, following Zander's method of transformational analysis using decibans.
Cladistic analysis groups taxa by shared traits but incorporates a dichotomous branching model borrowed from phenetics. It is essentially a simplified dichotomous natural key, although reversals are tolerated. The problem, of course, is that evolution is not necessarily dichotomous. An ancestral taxon generating two or more descendants requires a longer, less parsimonious tree. A cladogram node summarizes all traits distal to it, not of any one taxon, and continuity in a cladogram is from node to node, not taxon to taxon. This is not a model of evolution, but is a variant of hierarchical cluster analysis (trait changes and non-ultrametric branches. This is why a tree based solely on shared traits is not called an evolutionary tree but merely a cladistic tree. This tree reflects to a large extent evolutionary relationships through trait transformations but ignores relationships made by species-level transformation of extant taxa.

Phylogenetics attempts to inject a serial element by postulating ad hoc, undemonstrable shared ancestors at each node of a cladistic tree. There are in number, for a fully dichotomous cladogram, one less invisible shared ancestor than the number of terminal taxa. We get, then, in effect a dichotomous natural key with an invisible shared ancestor generating each couplet. This cannot imply a process-based explanation without justification of the dichotomy, and supposition of the shared ancestors as causes. The cladistic form of analysis of evolutionary relationships cannot falsify any genuine evolutionary scenario incorporating serial transformation, according to Zander.[14]
Zander has detailed methods for generating support measures for molecular serial descent[15] and for morphological serial descent using Bayes factors and sequential Bayes analysis through Turing deciban or Shannon informational bit addition.[16][17][18][19]
The Tree of Life

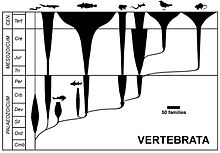
As more and more fossil groups were found and recognized in the late 19th and early 20th century,
These groups still retained their formal Linnaean taxonomic ranks. Some of them are paraphyletic in that, although every organism in the group is linked to a common ancestor by an unbroken chain of intermediate ancestors within the group, some other descendants of that ancestor lie outside the group. The evolution and distribution of the various taxa through time is commonly shown as a spindle diagram (often called a Romerogram after the American palaeontologist Alfred Romer) where various spindles branch off from each other, with each spindle representing a taxon. The width of the spindles are meant to imply the abundance (often number of families) plotted against time.[21]
Terminological difference
The two approaches, evolutionary taxonomy and the phylogenetic systematics derived from
References
- ^ PMID 21659226
- ^ Aubert, D (2015). "A formal analysis of phylogenetic terminology: Towards a reconsideration of the current paradigm in systematics". Phytoneuron. 2015–66: 1–54.
- S2CID 16634677.
- ISBN 978-0-521-07524-4, pgs. 62-63.
- ISBN 978-0-416-72370-0, pg. 142
- ^ PMID 20008390.
- ISBN 978-0-226-74410-0, archived from the originalon 16 May 2008, retrieved 17 January 2011
- Chambers, Robert (1844). Vestiges of the Natural History of Creation. London: John Churchill. p. 122. Retrieved 10 May 2013.
- ^ Huxley, T.H. (1876): Lectures on Evolution. New York Tribune. Extra. no 36. In Collected Essays IV: pp 46-138 original text w/ figures
- ^ Mahner, Martin; Bunge, Mario. Foundations of Biophilosophy. Springer, p. 251.
- .
- ^ Zander, Richard (2013). Framework for Post-Phylogenetic Systematics. St. Louis: Zetetic Publications, Amazon CreateSpace.
- ^ Zander, Richard (2014). "Response to a particularly nasty review in the journal Cladistics". Phytoneuron. 2014 (110): 1–4.
- S2CID 86754093.
- ^ Zander, Richard (2014). "Classical determination of monophyly exemplified with Didymodon s. lat. (Bryophyta). Part 1 of 3, synopsis and simplified concepts" (PDF). Phytoneuron. 2014 (78): 1–7. Retrieved 4 January 2015.
- ^ Zander, Richard (2014). "Classical determination of monophyly, exemplified with Didymodon s. lat. (Bryophyta). Part 2 of 3, concepts" (PDF). Phytoneuron. 2014 (79): 1–23. Retrieved 4 January 2015.
- ^ Zander, Richard (2014). "Classical determination of monophyly exemplified with Didymodon s. lat. (Bryophyta). Part 3 of 3, analysis" (PDF). Phytoneuron. 2014 (80): 1–19. Retrieved 4 January 2015.
- ^ Zander R. H. 2018. Macroevolutionary Systematics of Streptotrichaceae of the Bryophyta and Application to Ecosystem Thermodynamic Stability. Edition 2. Zetetic Publications, CreateSpace Independent Publishing, Amazon, St. Louis.
- ISBN 978-0-226-73103-2
- ^ White, T.; Kazlev, M. A. "Phylogeny and Systematics : Glossary - Romerogram". palaeos.com. Retrieved 21 January 2013.
- .
