File:2016 United States presidential election results map by county.svg

Page contents not supported in other languages.
This is a file from the Wikimedia Commons
Source: Wikipedia, the free encyclopedia.

Original file(SVG file, nominally 555 × 352 pixels, file size: 1.74 MB)

Description
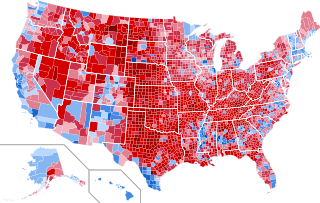
English: Results by county of the United States presidential election, 2016.
 
Clinton—80-90%
 
Clinton—70-80%
 
Clinton—60-70%
 
Clinton—50-60%
 
Clinton—40-50%
 
Clinton—<40%
 
Trump—<40%
 
Trump—40-50%
 
Trump—50-60%
 
Trump—60-70%
 
Trump—70-80%
 
Trump—80-90%
 
Trump—>90%
Date
Source This file was derived from: USA Counties.svg
Author
Ali Zifan and Inqvisitor
Permission
(Reusing this file)
Public domain I, the copyright holder of this work, release this work into the public domain. This applies worldwide.
In some countries this may not be legally possible; if so:
I grant anyone the right to use this work for any purpose, without any conditions, unless such conditions are required by law.
Other versions

[edit]

United States presidential election maps, 2016
  • Results by state, shaded according to winning candidate's percentage of the vote
    Results by state, shaded according to winning candidate's percentage of the vote
  • Results by Vote Distribution Among States. Each state's pie chart is proportional to the number of electoral votes they have.
    Results by Vote Distribution Among States. Each state's pie chart is proportional to the number of electoral votes they have.
  • Results by county. Red denotes counties that went to Trump; blue denotes counties that went to Clinton.
    Results by county. Red denotes counties that went to Trump; blue denotes counties that went to Clinton.
  • Results by county, shaded according to winning candidate's percentage of the vote.
    Results by county, shaded according to winning candidate's percentage of the vote.
  • United States presidential election, 2016 Cartogram
    United States presidential election, 2016 Cartogram
  • Electoral vote cartogram
    Electoral vote
    cartogram
  • Results by state, shaded according to percentage of the vote for Trump
    Results by state, shaded according to percentage of the vote for Trump
  • Results by state, shaded according to percentage of the vote for Clinton
    Results by state, shaded according to percentage of the vote for Clinton
  • Results by county, shaded according to percentage of the vote for Trump
    Results by county, shaded according to percentage of the vote for Trump
  • Results by county, shaded according to percentage of the vote for Clinton
    Results by county, shaded according to percentage of the vote for Clinton
  • Results by county, shaded according to percentage of the vote for Johnson
    Results by county, shaded according to percentage of the vote for Johnson
  • Results by county, shaded according to percentage of the vote for Stein
    Results by county, shaded according to percentage of the vote for Stein
  • Results by county, shaded according to winning candidate's percentage of the vote (Red-Purple-Blue view)
    Results by county, shaded according to winning candidate's percentage of the vote (Red-Purple-Blue view)
  • Results of 2016 U.S. presidential election by congressional district, shaded by vote margin.
    Results of 2016 U.S. presidential election by congressional district, shaded by vote margin.
  • County swing from 2012 to 2016
    County swing from 2012 to 2016
Results (States by county)
  • Alabama
    Alabama
  • Alaska
    Alaska
  • Arizona
    Arizona
  • Arkansas
    Arkansas
  • California
    California
  • Colorado
    Colorado
  • Connecticut
    Connecticut
  • Delaware
    Delaware
  • District of Columbia
    District of Columbia
  • Florida
    Florida
  • Georgia
    Georgia
  • Hawaii
    Hawaii
  • Idaho
    Idaho
  • Illinois
    Illinois
  • Indiana
    Indiana
  • Iowa
    Iowa
  • Kansas
    Kansas
  • Kentucky
    Kentucky
  • Louisiana
    Louisiana
  • Maine
    Maine
  • Maryland
    Maryland
  • Massachusetts
    Massachusetts
  • Michigan
    Michigan
  • Minnesota
    Minnesota
  • Mississippi
    Mississippi
  • Missouri
    Missouri
  • Montana
    Montana
  • Nebraska
    Nebraska
  • Nevada
    Nevada
  • New Hampshire
    New Hampshire
  • New Jersey
    New Jersey
  • New Mexcio
    New Mexcio
  • New York
    New York
  • North Carolina
    North Carolina
  • North Dakota
    North Dakota
  • Ohio
    Ohio
  • Oklahoma
    Oklahoma
  • Oregon
    Oregon
  • Pennsylvania
    Pennsylvania
  • Rhode Island
    Rhode Island
  • South Carolina
    South Carolina
  • South Dakota
    South Dakota
  • Tennessee
    Tennessee
  • Texas
    Texas
  • Utah
    Utah
  • Vermont
    Vermont
  • Virginia
    Virginia
  • Washington
    Washington
  • West Virginia
    West Virginia
  • Wisconsin
    Wisconsin
  • Wyoming
    Wyoming

Captions

Add a one-line explanation of what this file represents

Items portrayed in this file

depicts

27 March 2016

image/svg+xml

f969fbdd95406346af14ffaf99c6dcccfe9fd7ac

1,822,539 byte

352 pixel

555 pixel

File history

Click on a date/time to view the file as it appeared at that time.

(newest | oldest) View (newer 10 | ) (10 | 20 | 50 | 100 | 250 | 500)
Date/TimeThumbnailDimensionsUserComment
current23:04, 3 March 2023Thumbnail for version as of 23:04, 3 March 2023555 × 352 (1.74 MB)Gordfather69line width
05:37, 1 December 2019Thumbnail for version as of 05:37, 1 December 2019555 × 352 (1.73 MB)SpeedMcCoolFixed Tazewell County, Illinois
16:06, 21 November 2019Thumbnail for version as of 16:06, 21 November 2019555 × 352 (1.73 MB)SpeedMcCoolUpdated McCone County Montana
01:13, 11 October 2019Thumbnail for version as of 01:13, 11 October 2019555 × 352 (1.73 MB)SpeedMcCoolFixed Potter and Lehigh Counties PA
21:50, 27 October 2018Thumbnail for version as of 21:50, 27 October 2018555 × 352 (1.73 MB)VartempFixed shading for McDonald County, MO.
16:16, 29 July 2017Thumbnail for version as of 16:16, 29 July 2017555 × 352 (1.73 MB)InqvisitorTwo county shading corrections
16:41, 15 February 2017Thumbnail for version as of 16:41, 15 February 2017555 × 352 (1.74 MB)Jayjay8990Reverted to version as of 05:49, 8 February 2017 (UTC)
01:50, 15 February 2017Thumbnail for version as of 01:50, 15 February 2017990 × 627 (983 KB)KingofthedeadReverted to version as of 05:41, 8 February 2017 (UTC) I disagree that the borders are too thin, and this map is much larger and clearer
05:49, 8 February 2017Thumbnail for version as of 05:49, 8 February 2017555 × 352 (1.74 MB)TL565Don't you falsely accuse me of sock puppetry! The map should match the previous county maps and yes the borders are way too thin.
05:41, 8 February 2017Thumbnail for version as of 05:41, 8 February 2017990 × 627 (983 KB)Oganesson007@TL565 Please stop reverting the map with the alternative accounts. Also, This map is half of the size of that with optimal border size and more clarification. In this map (unlike the map that you keep putting here) small counties are clearly visible.
(newest | oldest) View (newer 10 | ) (10 | 20 | 50 | 100 | 250 | 500)

Global file usage

The following other wikis use this file:

Metadata