
File:Binary Boiling Point Diagram new.svg

Size of this PNG preview of this SVG file: 391 × 378 pixels. Other resolutions: 248 × 240 pixels | 497 × 480 pixels | 794 × 768 pixels | 1,059 × 1,024 pixels | 2,118 × 2,048 pixels.
Original file (SVG file, nominally 391 × 378 pixels, file size: 23 KB)
| This is a file from the Wikimedia Commons. Information from its description page there is shown below. Commons is a freely licensed media file repository. You can help. |
| Description |
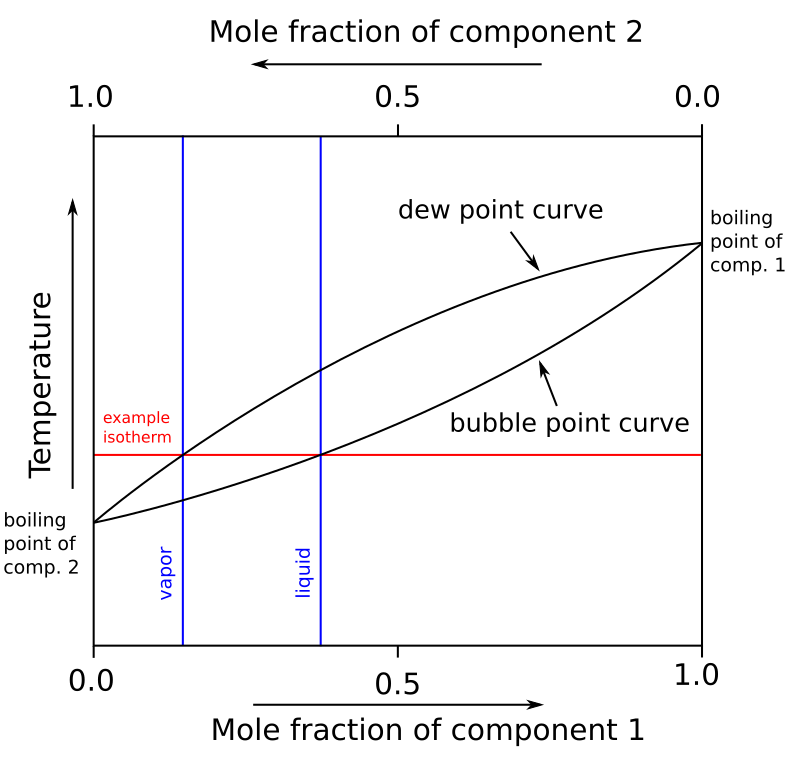
English: Binary Boiling Point Diagram (graph) of a hypothetical mixture of two components without an azeotrope. An example isotherm line is shown to compare vapor and liquid compositions at that temperature.
Русский: График температур кипения некоторой смеси двух не образующих азеотропную смесь компонентов. Приведён пример линии изотермы для сравнения составов пара и жидкости при этой температуре. |
| Date | (UTC) |
| Source | |
| Author |
|
| Other versions |
[]
.png:
Derivative works of this file: |


| This is a retouched picture, which means that it has been digitally altered from its original version. Modifications: vectorized. The original can be viewed here: Binary Boiling Point Diagram.PNG:
|
I, the copyright holder of this work, hereby publish it under the following license:
This file is licensed under the Creative Commons Attribution-Share Alike 2.5 Generic license.
- You are free:
- to share – to copy, distribute and transmit the work
- to remix – to adapt the work
- Under the following conditions:
- attribution – You must give appropriate credit, provide a link to the license, and indicate if changes were made. You may do so in any reasonable manner, but not in any way that suggests the licensor endorses you or your use.
- share alike – If you remix, transform, or build upon the material, you must distribute your contributions under the same or compatible license as the original.
Original upload log
This image is a derivative work of the following images:
- File:Binary_Boiling_Point_Diagram.PNG licensed with Cc-by-sa-2.5
- 2007-03-18T22:36:14Z H Padleckas 380x370 (5721 Bytes) revised previous diagram slightly adding lines to show X2 composition
- 2007-01-25T02:09:10Z Pngbot 380x370 (3006 Bytes) optimized with optipng
- 2006-11-21T17:01:03Z H Padleckas 380x370 (8980 Bytes) Binary Boiling Point Diagram
Uploaded with derivativeFX
File history
Click on a date/time to view the file as it appeared at that time.
| Date/Time | Thumbnail | Dimensions | User | Comment | |
|---|---|---|---|---|---|
| current | 09:33, 18 November 2020 | | 391 × 378 (23 KB) | Hugo | File uploaded using svgtranslate tool (https://svgtranslate.toolforge.org/). Added translation for cs. |
| 10:00, 10 November 2009 |  | 391 × 378 (20 KB) | Michbich | once more | |
| 09:58, 10 November 2009 |  | 391 × 378 (20 KB) | Michbich | tried fixing the fonts | |
| 09:56, 10 November 2009 |  | 391 × 378 (19 KB) | Michbich | {{Information |Description={{en|Binary Boiling Point Diagram (graph) of a hypothetical mixture of two components '''without''' an azeotrope. An example isotherm line is shown to compare vapor and liquid compositions at that temperature.}} |Source=*[[:Fil |
File usage
The following pages on the English Wikipedia use this file (pages on other projects are not listed):
Global file usage
The following other wikis use this file:
- Usage on bn.wikipedia.org
- Usage on el.wikipedia.org
- Usage on es.wikipedia.org
- Usage on fa.wikipedia.org
- Usage on fr.wikipedia.org
- Usage on id.wikipedia.org
- Usage on mk.wikipedia.org
- Usage on sr.wikipedia.org
- Usage on te.wikipedia.org
- Usage on zh.wikipedia.org