
File:Fed funds, one- five- ten-year treasury rates.png
Size of this preview: 800 × 283 pixels. Other resolutions: 320 × 113 pixels | 1,319 × 466 pixels.
Original file (1,319 × 466 pixels, file size: 73 KB, MIME type: image/png)
| This is a file from the Wikimedia Commons. Information from its description page there is shown below. Commons is a freely licensed media file repository. You can help. |
Summary
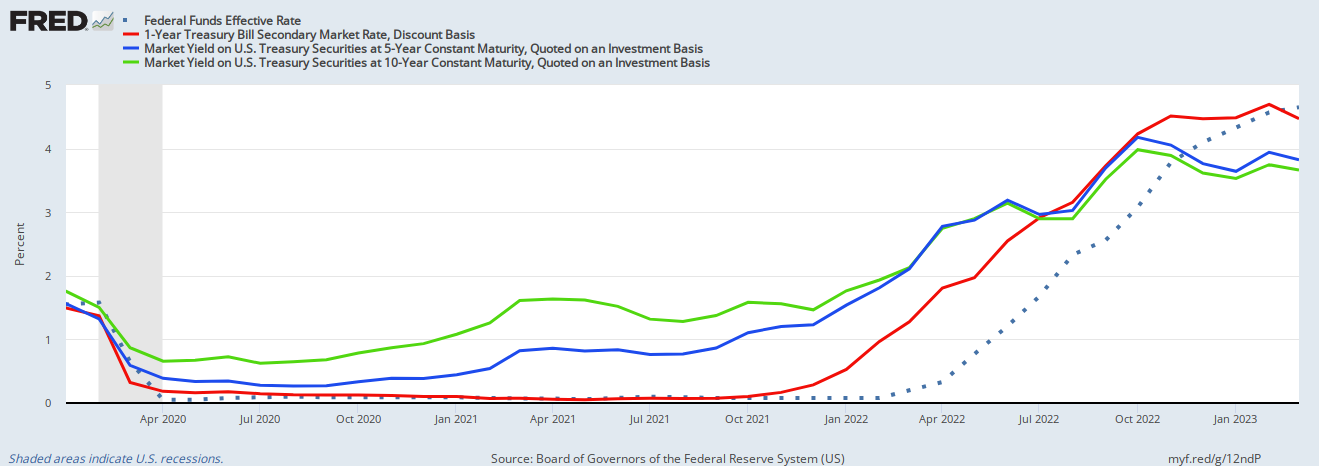
| Description |
English: Interactive chart: https://fred.stlouisfed.org/graph/?g=12ndP |
| Date | |
| Source | Federal Reserve Economic Data |
| Author |
Licensing
This work is in the public domain in the United States because it is a work prepared by an officer or employee of the United States Government as part of that person’s official duties under the terms of Title 17, Chapter 1, Section 105 of the US Code.
Note: This only applies to original works of the Federal Government and not to the work of any individual U.S. state, territory, commonwealth, county, municipality, or any other subdivision. This template also does not apply to postage stamp designs published by the United States Postal Service since 1978. (See § 313.6(C)(1) of Compendium of U.S. Copyright Office Practices). It also does not apply to certain US coins; see The US Mint Terms of Use.
|
 | |
| This file has been identified as being free of known restrictions under copyright law, including all related and neighboring rights. | ||
File history
Click on a date/time to view the file as it appeared at that time.
| Date/Time | Thumbnail | Dimensions | User | Comment | |
|---|---|---|---|---|---|
| current | 20:16, 10 April 2023 | 1,319 × 466 (73 KB) | Soibangla | Uploaded a work by Federal Reserve Economic Data from Interactive chart: https://fred.stlouisfed.org/graph/?g=12naD with UploadWizard |
File usage
The following pages on the English Wikipedia use this file (pages on other projects are not listed):
Global file usage
The following other wikis use this file:
- Usage on ru.wikipedia.org
- Usage on zh.wikipedia.org