
File:LeitzinsenDE (1999–2010).png

Size of this preview: 800 × 526 pixels. Other resolutions: 320 × 210 pixels | 640 × 420 pixels | 1,024 × 673 pixels | 1,370 × 900 pixels.
Original file (1,370 × 900 pixels, file size: 13 KB, MIME type: image/png)
| This is a file from the Wikimedia Commons. Information from its description page there is shown below. Commons is a freely licensed media file repository. You can help. |
.png)
| Description |
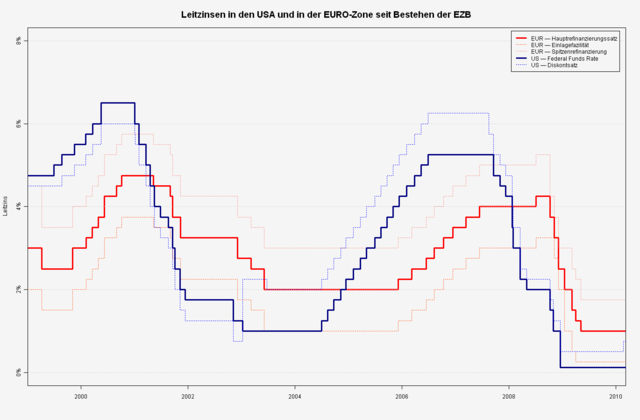
Deutsch: Leitzinsen der EZB (rot) und des Federal Reserve Systems der USA (blau) English: interest rates from the ECB (red) and the (US) Fed bank (blue) Français : Taux directeurs de la BCE (rouge) et de la FED (bleu) |
| Date | |
| Source | data from www.leitzinsen.info, and the central banks; plot generated with GNU R, see source below; eur-dates are from leitzinseninfo, but better is ecb, fedfund and feddiscount |
| Author | Thomas Steiner |
| Permission (Reusing this file) |
Thomas Steiner put it under the CC-by-SA 2.5. |
| Other versions |
in german |

|
This graph image could be re-created using vector graphics as an SVG file. This has several advantages; see Commons:Media for cleanup for more information. If an SVG form of this image is available, please upload it and afterwards replace this template with
{{vector version available|new image name}}.
It is recommended to name the SVG file “LeitzinsenDE (1999–2010).svg”—then the template Vva ) does not need the new image name parameter. |
GNU R source code (can be edited):
 dat.eur=rev(c("07.04.11","07.05.09", "02.04.09", "05.03.09", "15.01.09", "04.12.08", "06.11.08", "08.10.08", "03.07.08", "13.06.07", "14.03.07", "13.12.06", "11.10.06", "09.08.06", "15.06.06", "08.03.06", "06.12.05", "06.06.03", "07.03.03", "06.12.02", "09.11.01", "18.09.01", "31.08.01", "11.05.01", "06.10.00", "01.09.00", "09.06.00", "28.04.00", "17.03.00", "04.02.00", "05.11.99", "09.04.99", "01.01.99"))
 dat.eur=as.Date(dat.eur,format="%d.%m.%y")
 hauptrefin=  rev(c(0.0125, 0.0100, 0.0125, 0.0150, 0.0200, 0.0250, 0.0325, 0.0375, 0.0425, 0.04, 0.0375, 0.035, 0.0325, 0.0300, 0.0275, 0.0250, 0.0225, 0.0200, 0.0250, 0.0275, 0.0325, 0.0375, 0.0425, 0.0450, 0.0475, 0.0450, 0.0425, 0.0375, 0.0350, 0.0325, 0.0300, 0.0250, 0.0300))
 einlagefaz=  rev(c(0.0050, 0.0025, 0.0025, 0.0050, 0.0100, 0.0200, 0.0275, 0.0325, 0.0325, 0.03, 0.0275, 0.025, 0.0225, 0.0200, 0.0175, 0.0150, 0.0125, 0.0100, 0.0150, 0.0175, 0.0225, 0.0275, 0.0325, 0.0350, 0.0375, 0.0350, 0.0325, 0.0275, 0.0250, 0.0225, 0.0200, 0.0150, 0.0200))
 spitzenrefin=rev(c(0.0200, 0.0175, 0.0225, 0.0250, 0.0300, 0.0300, 0.0375, 0.0425, 0.0525, 0.05, 0.0475, 0.045, 0.0425, 0.0400, 0.0375, 0.0350, 0.0325, 0.0300, 0.0350, 0.0375, 0.0425, 0.0475, 0.0525, 0.0550, 0.0575, 0.0550, 0.0525, 0.0475, 0.0450, 0.0425, 0.0400, 0.0350, 0.0450))
 dat.us=rev(c("18.02.10", "16.12.08", "29.10.08", "08.10.08", "30.04.08", "18.03.08", "16.03.08", "30.01.08", "22.01.08", "11.12.07", "31.10.07", "18.09.07", "17.08.07", "29.06.06", "10.05.06", "28.03.06", "31.01.06", "13.12.05", "01.11.05", "20.09.05", "09.08.05", "30.06.05", "03.05.05", "22.03.05", "02.02.05", "14.12.04", "10.11.04", "21.09.04", "10.08.04", "30.06.04", "25.06.03", "09.01.03", "06.11.02", "11.12.01", "06.11.01", "02.10.01", "17.09.01", "21.08.01", "27.06.01", "15.05.01", "18.04.01", "20.03.01", "31.01.01", "04.01.01", "03.01.01", "16.05.00", "21.03.00", "02.02.00", "16.11.99", "24.08.99", "30.06.99", "17.11.98", "15.10.98", "29.09.98", "25.03.97", "31.01.96", "19.12.95", "06.07.95", "01.02.95", "15.11.94", "16.08.94", "17.05.94", "18.04.94", "22.03.94", "04.02.94", "04.09.92", "02.07.92", "09.04.92", "20.12.91", "06.12.91", "06.11.91", "31.10.91", "13.09.91", "06.08.91", "30.04.91", "08.03.91", "01.02.91", "09.01.91", "18.12.90", "07.12.90", "13.11.90", "29.10.90", "13.07.90", "24.02.89", "09.08.88", "04.09.87", "21.08.86"))
 dat.us=as.Date(dat.us,format="%d.%m.%y")
 fundsrate=rev(c(0.00125, 0.00125, 0.0100, 0.0150, 0.0200, 0.0225, 0.0300, 0.0300, 0.0350, 0.0425, 0.0450, 0.0475, 0.0525, 0.0525, 0.0500, 0.0475, 0.0450, 0.0425, 0.0400, 0.0375, 0.0350, 0.0325, 0.0300, 0.0275, 0.0250, 0.0225, 0.0200, 0.0175, 0.0150, 0.0125, 0.0100, 0.0100, 0.0125, 0.0175, 0.0200, 0.0250, 0.0300, 0.0350, 0.0375, 0.0400, 0.0450, 0.0500, 0.0550, 0.0600, 0.0600, 0.0650, 0.0600, 0.0575, 0.0550, 0.0525, 0.0500, 0.0475, 0.0500, 0.0525, 0.0550, 0.0525, 0.0550, 0.0575, 0.0600, 0.0550, 0.0475, 0.0425, 0.0375, 0.0350, 0.0325, 0.0300, 0.0325, 0.0375, 0.0400, 0.0450, 0.0475, 0.0500, 0.0525, 0.0550, 0.0575, 0.0600, 0.0625, 0.0675, 0.0700, 0.0725, 0.0750, 0.0775, 0.0800))
 discount=rev(c(0.0075, 0.005, 0.0125, 0.0175, 0.0225, 0.0250, 0.0325, 0.0350, 0.0400, 0.0475, 0.0500, 0.0525, 0.0575, 0.0625, 0.0600, 0.0575, 0.0550, 0.0525, 0.0500, 0.0475, 0.0450, 0.0425, 0.0400, 0.0375, 0.0350, 0.0325, 0.0300, 0.0275, 0.0250, 0.0225, 0.0200, 0.0225, 0.0075, 0.0125, 0.0150, 0.0200, 0.0250, 0.0300, 0.0325, 0.0350, 0.0400, 0.0450, 0.0500, 0.0550, 0.0575, 0.0600, 0.0550, 0.0525, 0.0500, 0.0475, 0.0450, 0.0450, 0.0475, 0.0500, 0.0500, 0.0500, 0.0525, 0.0525, 0.0525, 0.0475, 0.0400, 0.0350, 0.0325, 0.0300, 0.0300, 0.0300, 0.0300, 0.0350, 0.0350, 0.0450, 0.0450, 0.0500, 0.0500, 0.0550, 0.0550, 0.0600, 0.0600, 0.0600, 0.0650, 0.0700, 0.0700, 0.0700, 0.0700, 0.0700, 0.0650, 0.0600, 0.0550))

 #add today for nice plots
 dat.eur=c(dat.eur,as.Date(format(Sys.time(), "%d.%m.%y"),format="%d.%m.%y"))
 hauptrefin=c(hauptrefin,hauptrefin[length(hauptrefin)])
 einlagefaz=c(einlagefaz,einlagefaz[length(einlagefaz)])
 spitzenrefin=c(spitzenrefin,spitzenrefin[length(spitzenrefin)])
 dat.us=c(dat.us,as.Date(format(Sys.time(), "%d.%m.%y"),format="%d.%m.%y"))
 fundsrate=c(fundsrate,fundsrate[length(fundsrate)])
 discount=c(discount,discount[length(discount)])

 #to create multi-language plots, defaults to german
 LANG="DE"
 cols=c("red","orangered","salmon","navy","blue")
 png(filename=paste("Leitzinsen",LANG,".png",sep=""), width=1370, height=900, pointsize=12)
 par("bg"="whitesmoke")
 plot(dat.eur,hauptrefin,type="s",ylim=range(0,spitzenrefin,fundsrate,discount),yaxt="n",col=cols[1],lwd=3,xaxs="i",xlab="",ylab="")
 grid(NA, NULL, lwd=1)
 yticks=axTicks(2)
 axis(side=2,at=yticks,labels=paste(format(100*yticks,digits=3),"%",sep=""))
 box()

 lines(dat.eur,einlagefaz,type="s",col=cols[2],lwd=1,lty=3)
 lines(dat.eur,spitzenrefin,type="s",col=cols[3],lwd=1,lty=3)
 lines(dat.us[5:length(dat.us)],fundsrate,type="s",col=cols[4],lwd=3,lty=1)
 lines(dat.us,discount,type="s",col=cols[5],lwd=1,lty=3)

 if (LANG=="DE") {
  title(main="Leitzinsen in den USA und in der EURO-Zone seit Bestehen der EZB",ylab="Leitzins",cex.main=1.6)
  legend(x="topright",inset=0.01,legend=c("EUR — Hauptrefinanzierungssatz", "EUR — Einlagefazilität", "EUR — Spitzenrefinanzierung", "US — Federal Funds Rate", "US — Diskontsatz"),col=cols,lwd=c(3,1,1,3,1),lty=c(1,3,3,1,3),bg="whitesmoke")
 } else if (LANG=="FR") {
  title(main="Taux directeurs aux États-Unis et dans la Zone euro",ylab="Taux",cex.main=1.6)
  legend(x="topright",inset=0.01,legend=c("EUR — Taux de refinancement", "EUR — Taux de rémunération des dépôts", "EUR — Taux de  prêt marginal", "US — Taux directeur", "US — Taux d'escompte"),col=cols,lwd=c(3,1,1,3,1),lty=c(1,3,3,1,3),bg="whitesmoke")
 } else if (LANG=="EN") {
  title(main="US and Eurozone central banks' rates",ylab="Rates",cex.main=1.6)
  legend(x="topright",inset=0.01,legend=c("EUR — Main refinancing operations rate", "EUR — Deposit rate", "EUR — Marginal lending rate", "US — Federal Funds rate", "US — Discount rate"),col=cols,lwd=c(3,1,1,3,1),lty=c(1,3,3,1,3),bg="whitesmoke")
 }
 dev.off()
This file is licensed under the Creative Commons Attribution-Share Alike 2.5 Generic license.
- You are free:
- to share – to copy, distribute and transmit the work
- to remix – to adapt the work
- Under the following conditions:
- attribution – You must give appropriate credit, provide a link to the license, and indicate if changes were made. You may do so in any reasonable manner, but not in any way that suggests the licensor endorses you or your use.
- share alike – If you remix, transform, or build upon the material, you must distribute your contributions under the same or compatible license as the original.
for future improvements, the data in tables
"Date"	"Deposit facility"	"Main refinancing operations - Fixed rate tenders Fixed rate"	"Main refinancing operations - Variable rate tenders Minimum bid rate"	"Marginal lending facility"
2008-11-12	2,75	3,25	-	3,75
2008-10-15	3,25	3,75	-	4,25
2008-10-09	3,25	-	-	4,25
2008-10-08	2,75	-	-	4,75
2008-07-09	3,25	-	4,25	5,25
2007-06-13	3	-	4	5
2007-03-14	2,75	-	3,75	4,75
2006-12-13	2,5	-	3,5	4,5
2006-10-11	2,25	-	3,25	4,25
2006-08-09	2	-	3	4
2006-06-15	1,75	-	2,75	3,75
2006-03-08	1,5	-	2,5	3,5
2005-12-06	1,25	-	2,25	3,25
2003-06-06	1	-	2	3
2003-03-07	1,5	-	2,5	3,5
2002-12-06	1,75	-	2,75	3,75
2001-11-09	2,25	-	3,25	4,25
2001-09-18	2,75	-	3,75	4,75
2001-08-31	3,25	-	4,25	5,25
2001-05-11	3,5	-	4,5	5,5
2000-10-06	3,75	-	4,75	5,75
2000-09-01	3,5	-	4,5	5,5
2000-06-28	3,25	-	4,25	5,25
2000-06-09	3,25	4,25	-	5,25
2000-04-28	2,75	3,75	-	4,75
2000-03-17	2,5	3,5	-	4,5
2000-02-04	2,25	3,25	-	4,25
1999-11-05	2	3	-	4
1999-04-09	1,5	2,5	-	3,5
1999-01-22	2	3	-	4,5
1999-01-04	2,75	3	-	3,25
1999-01-01	2	3	-	4,5

Date  	fedfunds
2008-10-29	1
2008-10-08	1,5
2008-04-30	2
2008-03-18	2,25
2008-01-30	3
2008-01-22	3,5
2007-12-11	4,25
2007-10-31	4,5
2007-09-18	4,75
2006-06-29	5,25
2006-05-10	5
2006-03-28	4,75
2006-01-31	4,5
2005-12-13	4,25
2005-11-01	4
2005-09-20	3,75
2005-08-09	3,5
2005-06-30	3,25
2005-05-03	3
2005-03-22	2,75
2005-02-02	2,5
2004-12-14	2,25
2004-11-10	2
2004-09-21	1,75
2004-08-10	1,5
2004-06-30	1,25
2003-06-25	1
2002-11-06	1,25
2001-12-11	1,75
2001-11-06	2
2001-10-01	2,5
2001-09-17	3
2001-08-21	3,5
2001-06-27	3,75
2001-05-15	4
2001-04-18	4,5
2001-03-20	5
2001-01-31	5,5
2001-01-03	6
2000-05-16	6,5
2000-03-21	6
2000-02-02	5,75
1999-11-16	5,5
1999-08-24	5,25
1999-06-30	5

"New York"	Primary* Credit	Secondary** Credit
2008-10-29	1,25%	1,75%
2008-10-08	1,75%	2,25%
2008-04-30	2,25%	2,75%
2008-03-18	2,50%	3,00%
2008-03-17	3,25%	3,75%
2008-01-30	3,50%	4,00%
2008-01-22	4,00%	4,50%
2007-12-11	4,75%	5,25%
2007-10-31	5,00%	5,50%
2007-09-18	5,25%	5,75%
2007-08-17	5.75%	6.25%
2006-06-29	6,25%	6,75%
2006-05-10	6,00%	6,50%
2006-03-28	5,75%	6,25%
2006-01-31	5,50%	6,00%
2005-12-13	5,25%	5,75%
2005-11-01	5,00%	5,50%
2005-09-20	4,75%	5,25%
2005-08-09	4,50%	5,00%
2005-06-30	4,25%	4,75%
2005-05-03	4,00%	4,50%
2005-03-22	3,75%	4,25%
2005-02-02	3,50%	4,00%
2004-12-14	3,25%	3,75%
2004-11-10	3,00%	3,50%
2004-09-21	2,75%	3,25%
2004-08-10	2,50%	3,00%
2004-06-30	2,25%	2,75%
2003-06-25	2,00%	2,50%
File history
Click on a date/time to view the file as it appeared at that time.
| Date/Time | Thumbnail | Dimensions | User | Comment | |
|---|---|---|---|---|---|
| current | 19:07, 9 March 2010 | | 1,370 × 900 (13 KB) | Thire | us data update |
| 23:31, 30 May 2009 |  | 1,370 × 900 (15 KB) | Thire | hgfhf | |
| 07:03, 19 April 2009 |  | 1,370 × 900 (15 KB) | Thire | update mid apr: eur (3changes) | |
| 11:17, 10 January 2009 |  | 1,370 × 900 (14 KB) | Thire | ||
| 21:50, 13 November 2008 |  | 1,370 × 900 (12 KB) | Thire | {{Information |Description= |Source= |Date= |Author= |Permission= |other_versions= }} | |
| 08:12, 11 October 2008 |  | 1,370 × 900 (16 KB) | Thire | {{Information |Description= |Source= |Date= |Author= |Permission= |other_versions= }} | |
| 09:19, 10 August 2008 |  | 1,370 × 900 (16 KB) | Thire | {{Information |Description= |Source= |Date= |Author= |Permission= |other_versions= }} | |
| 19:23, 3 July 2008 |  | 1,089 × 688 (10 KB) | MaCRoEco | {{Information |Description= |Source= |Date= |Author= |Permission= |other_versions= }} | |
| 21:48, 2 May 2008 |  | 1,370 × 900 (15 KB) | Thire | {{Information| |Description = {{en|interest rates from the ECB and the (US) Fed bank}} {{fr|Taux directeurs de la BCE (rouge) et de la FED (bleu)}} |Source = data from [http://www.leitzinsen.info/ www.leitzinsen.info], and the central banks; plot generate |
File usage
No pages on the English Wikipedia use this file (pages on other projects are not listed).
.png)