File:Ngrip bolling allerod do18 1.png

Page contents not supported in other languages.
This is a file from the Wikimedia Commons
Source: Wikipedia, the free encyclopedia.

Original file(1,275 × 944 pixels, file size: 240 KB, MIME type: image/png)

Summary

Description
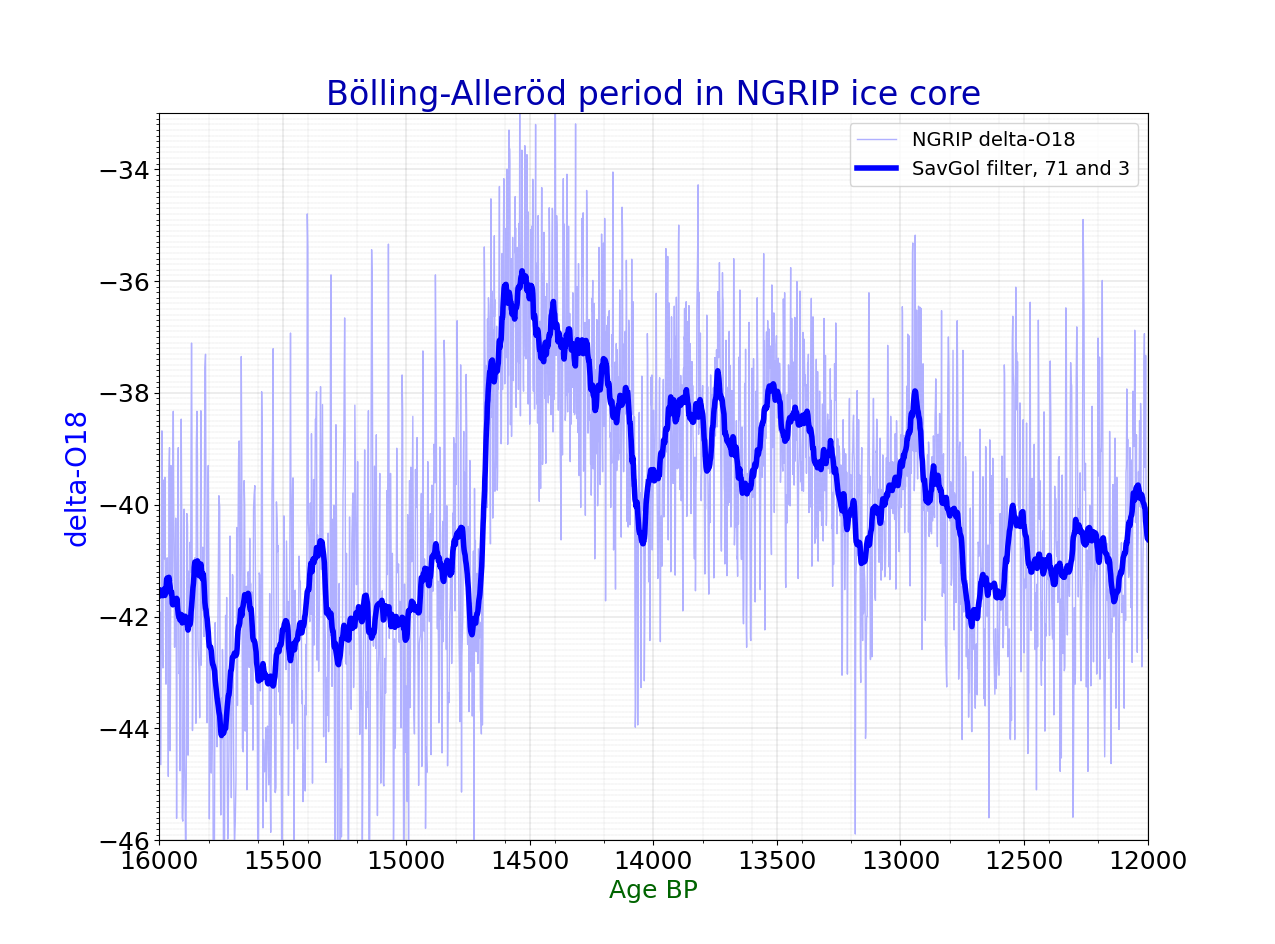
English: Bölling-Alleröd Greenland ice core NGRIP temperature data.


Data for this file is from http://www.iceandclimate.nbi.ku.dk/data/NGRIP_d18O_and_dust_5cm.xls http://www.iceandclimate.nbi.ku.dk/data/ processed to csv


δ18O values and dust concentrations


The dataset provides NGRIP δ18O values, dust concentrations, and GICC05 ages in 5cm depth resolution for the period 0-60 ka (δ18O) and 10-60 ka (dust).

The dataset accompany the following papers:

NGRIP members, Nature, 431, 147-151, 2004. DOI: 10.1038/nature02805

Gkinis et al., Earth Planet. Sci. Lett., 405, 132-141, 2014. DOI: 10.1016/j.epsl.2014.08.022

Ruth et al., J. Geophys. Res., 108, 4098, 2003. DOI: 4010.1029/2002JD002376

    1. drawing climate diagram in python 3
    2. version 2.11
    3. 11.9.2020


import matplotlib.pyplot as plt import numpy as np import pandas as pd from scipy import interpolate from matplotlib.ticker import (MultipleLocator, AutoMinorLocator) import scipy.signal

def running_mean(x, N):

   cumsum = np.cumsum(np.insert(x, 0, 0)) 
   return (cumsum[N:] - cumsum[:-N]) / float(N)


datafilename="ngrip1.csv" captioni="Bölling-Alleröd period in NGRIP ice core" savename="ngrip_dryas.svg"

figsizex=16 figsizey=8

  1. x = []
  2. y = []
  3. y2= []


dfin0=pd.read_csv(datafilename, sep=";")

lst1=['gicc05_age','delta_O18']

dfin1 = dfin0[dfin0.columns.intersection(lst1)]

x0=dfin1['gicc05_age'] y0=dfin1['delta_O18']

  1. y20=dfin1['GISP_dO18']
  2. y30=dfin1['GISP2_dO18']


x=np.array(x0) y=np.array(y0)


size0=14 size1=16 size2=18 size3=24


  1. y_savgol = scipy.signal.savgol_filter(y,31, 3)

y_savgol = scipy.signal.savgol_filter(y,71, 3)


  1. y_running = running_mean(y, 31)


x_sm = np.array(x) y_sm = np.array(y) x_smooth = np.linspace(x_sm.min(), x_sm.max(), 20000) funk1 = interpolate.interp1d(x_sm, y_sm, kind="cubic") y_smooth = funk1(x_smooth)


fig, ax1 = plt.subplots()


  1. ax1.axis((11600,14000,0,ymax1))

ax1.set_xlim(12000,16000) ax1.set_ylim(-33.0, -46.0)

  1. ax1.set_ylim(-35.0, -42.0)

plt.gca().invert_xaxis() plt.gca().invert_yaxis()

ax1.set_ylabel('delta-O18', color='#0000ff', fontsize=size2+2)


ax1.plot(x,y, color="#b0b0ff", linewidth=1,label="NGRIP delta-O18")

  1. ax1.plot(x_smooth,y_smooth, color="#0000ff", linewidth=3,label="NGRIP delta-O18")

ax1.plot(x,y_savgol, color="#0000FF", linewidth=4, label="SavGol filter, 71 and 3")

  1. ax1.plot(x,y_running, color="#FF0000", linewidth=3)


  1. ax1.plot(x,data_avg1, color="#ff0000", linewidth=2, linestyle=":", label="Average of NGRIP, GISP, GISP2 delta-O18")


ax1.tick_params(axis='both', which='major', labelsize=size2)

ax1.xaxis.set_minor_locator(MultipleLocator(1000)) ax1.xaxis.set_minor_locator(MultipleLocator(200))

ax1.yaxis.set_minor_locator(MultipleLocator(1.0)) ax1.yaxis.set_minor_locator(MultipleLocator(0.1))

ax1.grid(which='major', linestyle='-', linewidth='0.1', color='black') ax1.grid(which='minor', linestyle=':', linewidth='0.1', color='black')


ax1.set_xlabel('Age BP', color="darkgreen", fontsize=size2)


ax1.set_title(captioni, fontsize=size3, color="#0000af")

plt.legend(fontsize=size0)

fig = plt.gcf() fig.set_size_inches(figsizex, figsizey, forward=True)


plt.savefig(savename, format="svg", dpi = 100)

plt.show()


Old stuff:


The data is from oxygen isotope ratio delta-O18.

Source of oxygen isotope data is "North Greenland Ice Core Project Oxygen Isotope Data." IGBP PAGES/World Data Center for Paleoclimatology Data Contribution Series # 2004-059. NOAA/NGDC Paleoclimatology Program, Boulder CO, USA.

The original data file has processed with R and plotted with ggplot2, with the following code:

library(tidyverse)
library(readr)
# Loads the data, skipping the first 79 lines (comments)
ngrip_d18o_50yr <- read_table2("ftp://ftp.ncdc.noaa.gov/pub/data/paleo/icecore/greenland/summit/ngrip/isotopes/ngrip-d18o-50yr.txt", 
                               skip = 79)
# Filters the relevant time period, pipes into ggplot()
ngrip_d18o_50yr %>% filter(Age <= 16000 & Age >= 12000) %>% 
  # Creates the plot
  ggplot(aes(x=Age, y=d18O)) + geom_path(color="red") + scale_x_reverse() +
  labs(x="Age, ss09sea, years before 2000 AD", y="delta 18O, permille") + theme_bw()
Date
Source Own work
Author Merikanto, bender235

Licensing

I, the copyright holder of this work, hereby publish it under the following license:
w:en:Creative Commons
attribution share alike
This file is licensed under the Creative Commons Attribution-Share Alike 4.0 International license.
You are free:
  • to share – to copy, distribute and transmit the work
  • to remix – to adapt the work
Under the following conditions:
  • attribution – You must give appropriate credit, provide a link to the license, and indicate if changes were made. You may do so in any reasonable manner, but not in any way that suggests the licensor endorses you or your use.
  • share alike – If you remix, transform, or build upon the material, you must distribute your contributions under the same or compatible license as the original.

Captions

Bölling-Alleröd Greenland ice core NGRIP temperature data.

Items portrayed in this file

depicts

30 December 2018

image/png

File history

Click on a date/time to view the file as it appeared at that time.

Date/TimeThumbnailDimensionsUserComment
current18:17, 12 September 2020Thumbnail for version as of 18:17, 12 September 20201,275 × 944 (240 KB)MerikantoNew data and layout
18:26, 30 December 2018Thumbnail for version as of 18:26, 30 December 2018985 × 794 (11 KB)Bender235created new version, using ggplot2
15:14, 30 November 2015Thumbnail for version as of 15:14, 30 November 2015985 × 794 (65 KB)MerikantoUser created page with UploadWizard
The following pages on the English Wikipedia use this file (pages on other projects are not listed):

Global file usage

The following other wikis use this file:

Metadata