
File:Pretiglian curve lisiecki raymo 2005 1.png
Original file (1,600 × 766 pixels, file size: 141 KB, MIME type: image/png)
| This is a file from the Wikimedia Commons. Information from its description page there is shown below. Commons is a freely licensed media file repository. You can help. |
Summary
| Description |
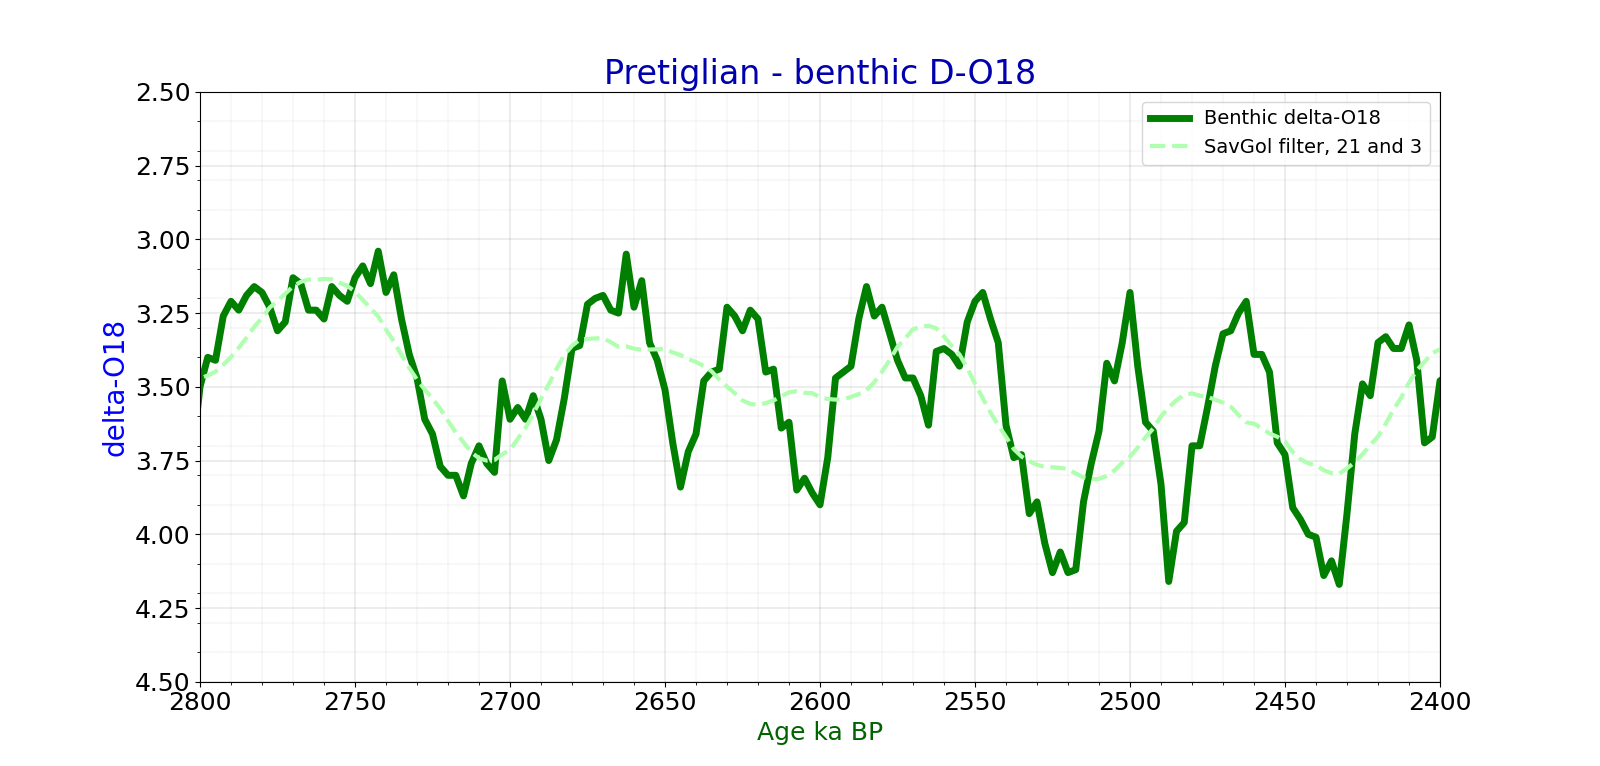
English: Pretiglian(pretegelen) cold stage oxygen isotope curve drawn from Lisiecki % Raymo 2005 LR04 data
Please cite: Lisiecki, L. E., and M. E. Raymo (2005), A Pliocene- Pleistocene stack of 57 globally distributed benthic d18O records, Paleoceanography,20, PA1003, doi:10.1029/2004PA001071. The data file is on http://www.lorraine-lisiecki.com/LR04stack.txt |
| Date | |
| Source | Own work |
| Author | Merikanto |
Addttional information
- drawing climate diagram in python 3
- version 2.11
- 13.9.2020
-
import matplotlib.pyplot as plt
import numpy as np
import pandas as pd
from scipy import interpolate
from matplotlib.ticker import (MultipleLocator, AutoMinorLocator)
import scipy.signal


datafilename="lisiecki2.csv"
captioni="Pretiglian - benthic D-O18"
savename="lisiecki.svg"
figsizex=16
figsizey=8
dfin0=pd.read_csv(datafilename, sep=";")
lst1=['time_ka','benthic_dO18']
dfin1 = dfin0[dfin0.columns.intersection(lst1)]
x0=dfin1['time_ka']
y0=dfin1['benthic_dO18']
x=np.array(x0)
y=np.array(y0)
size0=14
size1=16
size2=18
size3=24
- y_savgol = scipy.signal.savgol_filter(y,31, 3)
y_savgol = scipy.signal.savgol_filter(y,31, 3)
- y_running = running_mean(y, 31)
x_sm = np.array(x)
y_sm = np.array(y)
x_smooth = np.linspace(x_sm.min(), x_sm.max(), 20000)
funk1 = interpolate.interp1d(x_sm, y_sm, kind="cubic")
y_smooth = funk1(x_smooth)


fig, ax1 = plt.subplots()
- ax1.axis((11600,14000,0,ymax1))
- ax1.set_xlim(2200,3600)
ax1.set_xlim(2400,2800)
ax1.set_ylim(2.5,4.5)
- ax1.set_ylim(-35.0, -42.0)
plt.gca().invert_xaxis()
plt.gca().invert_yaxis()
ax1.set_ylabel('delta-O18', color='#0000ff', fontsize=size2+2)


ax1.plot(x,y, color="#007f00", linewidth=5,label="Benthic delta-O18")
- ax1.plot(x_smooth,y_smooth, color="#0000ff", linewidth=3,label="NGRIP delta-O18")
ax1.plot(x,y_savgol, color="#b0FFb0", linewidth=3,linestyle="--", label="SavGol filter, 21 and 3")
- ax1.plot(x,y_running, color="#FF0000", linewidth=3)
- ax1.plot(x,data_avg1, color="#ff0000", linewidth=2, linestyle=":", label="Average of NGRIP, GISP, GISP2 delta-O18")
ax1.tick_params(axis='both', which='major', labelsize=size2)
ax1.xaxis.set_minor_locator(MultipleLocator(100))
ax1.xaxis.set_minor_locator(MultipleLocator(10))
ax1.yaxis.set_minor_locator(MultipleLocator(1.0))
ax1.yaxis.set_minor_locator(MultipleLocator(0.1))
ax1.grid(which='major', linestyle='-', linewidth='0.1', color='black')
ax1.grid(which='minor', linestyle=':', linewidth='0.1', color='black')


ax1.set_xlabel('Age ka BP', color="darkgreen", fontsize=size2)


ax1.set_title(captioni, fontsize=size3, color="#0000af")
plt.legend(fontsize=size0)
fig = plt.gcf()
fig.set_size_inches(figsizex, figsizey, forward=True)


plt.savefig(savename, format="svg", dpi = 100)
plt.show()
Licensing
| I, the copyright holder of this work, release this work into the public domain. This applies worldwide. In some countries this may not be legally possible; if so: I grant anyone the right to use this work for any purpose, without any conditions, unless such conditions are required by law. |
File history
Click on a date/time to view the file as it appeared at that time.
| Date/Time | Thumbnail | Dimensions | User | Comment | |
|---|---|---|---|---|---|
| current | 18:23, 13 September 2020 | | 1,600 × 766 (141 KB) | Merikanto | Error correction |
| 17:47, 12 September 2020 |  | 1,600 × 766 (151 KB) | Merikanto | New layout | |
| 13:03, 8 August 2008 |  | 430 × 382 (7 KB) | Merikanto~commonswiki | {{Information |Description={{en|1=Pretiglian(pretegelen) cold stage oxygen isotope curve drawn from Lisiecki % Raymo 2005 LR04 data Please cite: Lisiecki, L. E., and M. E. Raymo (2005), A Pliocene- Pleistocene stack of 57 globally distributed benthic d18O |
File usage
Global file usage
The following other wikis use this file:
- Usage on fi.wikipedia.org