Gas chromatography–mass spectrometry

Gas chromatography–mass spectrometry (GC–MS) is an
GC–MS has been regarded as a "
History
The first on-line coupling of gas chromatography to a mass spectrometer was reported in the late 1950s.[4][5] An interest in coupling the methods had been suggested as early as December 1954.[6] The development of affordable and
Instrumentation

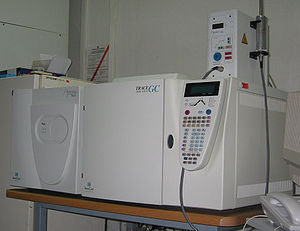
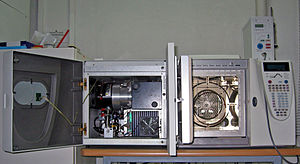
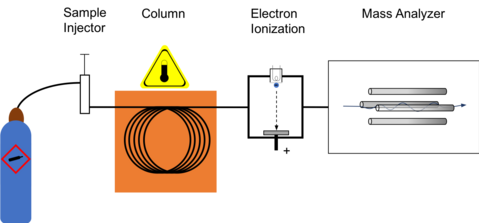
The GC–MS is composed of two major building blocks: the

These two components, used together, allow a much finer degree of substance identification than either unit used separately. It is not possible to make an accurate identification of a particular molecule by gas chromatography or mass spectrometry alone. The mass spectrometry process normally requires a very pure sample while gas chromatography using a traditional detector (e.g. Flame ionization detector) cannot differentiate between multiple molecules that happen to take the same amount of time to travel through the column (i.e. have the same retention time), which results in two or more molecules that co-elute. Sometimes two different molecules can also have a similar pattern of ionized fragments in a mass spectrometer (mass spectrum). Combining the two processes reduces the possibility of error, as it is extremely unlikely that two different molecules will behave in the same way in both a gas chromatograph and a mass spectrometer. Therefore, when an identifying mass spectrum appears at a characteristic retention time in a GC–MS analysis, it typically increases certainty that the analyte of interest is in the sample.
Purge and trap GC–MS
For the analysis of
A faster alternative is the "purge-closed loop" system. In this system the inert gas is bubbled through the water until the concentrations of organic compounds in the vapor phase are at equilibrium with concentrations in the aqueous phase. The gas phase is then analysed directly.[11]
Types of mass spectrometer detectors
The most common type of mass spectrometer (MS) associated with a gas chromatograph (GC) is the quadrupole mass spectrometer, sometimes referred to by the
GC–tandem MS
When a second phase of mass fragmentation is added, for example using a second quadrupole in a quadrupole instrument, it is called tandem MS (MS/MS). MS/MS can sometimes be used to quantitate low levels of target compounds in the presence of a high sample matrix background.
The first quadrupole (Q1) is connected with a collision cell (Q2) and another quadrupole (Q3). Both quadrupoles can be used in scanning or static mode, depending on the type of MS/MS analysis being performed. Types of analysis include product ion scan, precursor ion scan, selected reaction monitoring (SRM) (sometimes referred to as multiple reaction monitoring (MRM)) and neutral loss scan. For example: When Q1 is in static mode (looking at one mass only as in SIM), and Q3 is in scanning mode, one obtains a so-called product ion spectrum (also called "daughter spectrum"). From this spectrum, one can select a prominent product ion which can be the product ion for the chosen precursor ion. The pair is called a "transition" and forms the basis for SRM. SRM is highly specific and virtually eliminates matrix background.
Ionization
After the molecules travel the length of the column, pass through the transfer line and enter into the mass spectrometer they are ionized by various methods with typically only one method being used at any given time. Once the sample is fragmented it will then be detected, usually by an electron multiplier, which essentially turns the ionized mass fragment into an electrical signal that is then detected.
The ionization technique chosen is independent of using full scan or SIM.

Electron ionization
By far the most common and perhaps standard form of ionization is electron ionization (EI). The molecules enter into the MS (the source is a quadrupole or the ion trap itself in an ion trap MS) where they are bombarded with free electrons emitted from a filament, not unlike the filament one would find in a standard light bulb. The electrons bombard the molecules, causing the molecule to fragment in a characteristic and reproducible way. This "hard ionization" technique results in the creation of more fragments of low mass-to-charge ratio (m/z) and few, if any, molecules approaching the molecular mass unit. Hard ionization is considered by mass spectrometrists as the employ of molecular electron bombardment, whereas "soft ionization" is charge by molecular collision with an introduced gas. The molecular fragmentation pattern is dependent upon the electron energy applied to the system, typically 70 eV (electronvolts). The use of 70 eV facilitates comparison of generated spectra with library spectra using manufacturer-supplied software or software developed by the National Institute of Standards (NIST-USA). Spectral library searches employ matching algorithms such as Probability Based Matching[12] and dot-product[13] matching that are used with methods of analysis written by many method standardization agencies. Sources of libraries include NIST,[14] Wiley,[15] the AAFS,[16] and instrument manufacturers.
Cold electron ionization
The "hard ionization" process of electron ionization can be softened by the cooling of the molecules before their ionization, resulting in mass spectra that are richer in information.[17][18] In this method named cold electron ionization (cold-EI) the molecules exit the GC column, mixed with added helium make up gas and expand into vacuum through a specially designed supersonic nozzle, forming a supersonic molecular beam (SMB). Collisions with the make up gas at the expanding supersonic jet reduce the internal vibrational (and rotational) energy of the analyte molecules, hence reducing the degree of fragmentation caused by the electrons during the ionization process.[17][18] Cold-EI mass spectra are characterized by an abundant molecular ion while the usual fragmentation pattern is retained, thus making cold-EI mass spectra compatible with library search identification techniques. The enhanced molecular ions increase the identification probabilities of both known and unknown compounds, amplify isomer mass spectral effects and enable the use of isotope abundance analysis for the elucidation of elemental formulas.[19]
Chemical ionization
In chemical ionization (CI) a reagent gas, typically methane or ammonia is introduced into the mass spectrometer. Depending on the technique (positive CI or negative CI) chosen, this reagent gas will interact with the electrons and analyte and cause a 'soft' ionization of the molecule of interest. A softer ionization fragments the molecule to a lower degree than the hard ionization of EI. One of the main benefits of using chemical ionization is that a mass fragment closely corresponding to the molecular weight of the analyte of interest is produced.[20]
In positive chemical ionization (PCI) the reagent gas interacts with the target molecule, most often with a proton exchange. This produces the species in relatively high amounts.
In negative chemical ionization (NCI) the reagent gas decreases the impact of the free electrons on the target analyte. This decreased energy typically leaves the fragment in great supply.
Analysis
A mass spectrometer is typically utilized in one of two ways: full scan or selective ion monitoring (SIM). The typical GC–MS instrument is capable of performing both functions either individually or concomitantly, depending on the setup of the particular instrument.
The primary goal of instrument analysis is to quantify an amount of substance. This is done by comparing the relative concentrations among the atomic masses in the generated spectrum. Two kinds of analysis are possible, comparative and original. Comparative analysis essentially compares the given spectrum to a spectrum library to see if its characteristics are present for some sample in the library. This is best performed by a computer because there are a myriad of visual distortions that can take place due to variations in scale. Computers can also simultaneously correlate more data (such as the retention times identified by GC), to more accurately relate certain data. Deep learning was shown to lead to promising results in the identification of VOCs from raw GC–MS data.[21]
Another method of analysis measures the peaks in relation to one another. In this method, the tallest peak is assigned 100% of the value, and the other peaks being assigned proportionate values. All values above 3% are assigned. The total mass of the unknown compound is normally indicated by the parent peak. The value of this parent peak can be used to fit with a chemical formula containing the various elements which are believed to be in the compound. The isotope pattern in the spectrum, which is unique for elements that have many natural isotopes, can also be used to identify the various elements present. Once a chemical formula has been matched to the spectrum, the molecular structure and bonding can be identified, and must be consistent with the characteristics recorded by GC–MS. Typically, this identification is done automatically by programs which come with the instrument, given a list of the elements which could be present in the sample.
A "full spectrum" analysis considers all the "peaks" within a spectrum. Conversely, selective ion monitoring (SIM) only monitors selected ions associated with a specific substance. This is done on the assumption that at a given retention time, a set of ions is characteristic of a certain compound. This is a fast and efficient analysis, especially if the analyst has previous information about a sample or is only looking for a few specific substances. When the amount of information collected about the ions in a given gas chromatographic peak decreases, the sensitivity of the analysis increases. So, SIM analysis allows for a smaller quantity of a compound to be detected and measured, but the degree of certainty about the identity of that compound is reduced.
Full scan MS
When collecting data in the full scan mode, a target range of mass fragments is determined and put into the instrument's method. An example of a typical broad range of mass fragments to monitor would be m/z 50 to m/z 400. The determination of what range to use is largely dictated by what one anticipates being in the sample while being cognizant of the solvent and other possible interferences. A MS should not be set to look for mass fragments too low or else one may detect air (found as m/z 28 due to nitrogen), carbon dioxide (m/z 44) or other possible interference. Additionally if one is to use a large scan range then sensitivity of the instrument is decreased due to performing fewer scans per second since each scan will have to detect a wide range of mass fragments.
Full scan is useful in determining unknown compounds in a sample. It provides more information than SIM when it comes to confirming or resolving compounds in a sample. During instrument method development it may be common to first analyze test solutions in full scan mode to determine the retention time and the mass fragment fingerprint before moving to a SIM instrument method.
Selective ion monitoring
In selective ion monitoring (SIM) certain ion fragments are entered into the instrument method and only those mass fragments are detected by the mass spectrometer. The advantages of SIM are that the detection limit is lower since the instrument is only looking at a small number of fragments (e.g. three fragments) during each scan. More scans can take place each second. Since only a few mass fragments of interest are being monitored,
Applications
Environmental monitoring and cleanup
GC–MS is becoming the tool of choice for tracking organic pollutants in the environment. The cost of GC–MS equipment has decreased significantly, and the reliability has increased at the same time, which has contributed to its increased adoption in environmental studies.
Criminal forensics
GC–MS can analyze the particles from a human body in order to help link a criminal to a crime. The analysis of fire debris using GC–MS is well established, and there is even an established American Society for Testing and Materials (ASTM) standard for fire debris analysis. GCMS/MS is especially useful here as samples often contain very complex matrices and results, used in court, need to be highly accurate.
Law enforcement
GC–MS is increasingly used for detection of illegal narcotics, and may eventually supplant drug-sniffing dogs.[1] A simple and selective GC–MS method for detecting marijuana usage was recently developed by the Robert Koch Institute in Germany. It involves identifying an acid metabolite of tetrahydrocannabinol (THC), the active ingredient in marijuana, in urine samples by employing derivatization in the sample preparation.[22] GC–MS is also commonly used in forensic toxicology to find drugs and/or poisons in biological specimens of suspects, victims, or the deceased. In drug screening, GC–MS methods frequently utilize liquid-liquid extraction as a part of sample preparation, in which target compounds are extracted from blood plasma.[23]
Sports anti-doping analysis
GC–MS is the main tool used in sports anti-doping laboratories to test athletes' urine samples for prohibited performance-enhancing drugs, for example
Security
A post–September 11 development,
Chemical warfare agent detection
As part of the post-September 11 drive towards increased capability in homeland security and public health preparedness, traditional GC–MS units with transmission quadrupole mass spectrometers, as well as those with cylindrical ion trap (CIT-MS) and toroidal ion trap (T-ITMS) mass spectrometers have been modified for field portability and near real-time detection of chemical warfare agents (CWA) such as sarin, soman, and VX.[25] These complex and large GC–MS systems have been modified and configured with resistively heated low thermal mass (LTM) gas chromatographs that reduce analysis time to less than ten percent of the time required in traditional laboratory systems.[26] Additionally, the systems are smaller, and more mobile, including units that are mounted in mobile analytical laboratories (MAL), such as those used by the United States Marine Corps Chemical and Biological Incident Response Force MAL and other similar laboratories, and systems that are hand-carried by two-person teams or individuals, much ado to the smaller mass detectors.[27] Depending on the system, the analytes can be introduced via liquid injection, desorbed from sorbent tubes through a thermal desorption process, or with solid-phase micro extraction (SPME).
Chemical engineering
GC–MS is used for the analysis of unknown organic compound mixtures. One critical use of this technology is the use of GC–MS to determine the composition of bio-oils processed from raw biomass.[28] GC–MS is also utilized in the identification of continuous phase component in a smart material, magnetorheological (MR) fluid.[29]
Food, beverage and perfume analysis
Astrochemistry
Several GC–MS systems have left earth. Two were brought to
Medicine
Dozens of congenital metabolic diseases also known as inborn errors of metabolism (IEM) are now detectable by newborn screening tests, especially the testing using gas chromatography–mass spectrometry. GC–MS can determine compounds in urine even in minor concentration. These compounds are normally not present but appear in individuals suffering with metabolic disorders. This is increasingly becoming a common way to diagnose IEM for earlier diagnosis and institution of treatment eventually leading to a better outcome. It is now possible to test a newborn for over 100 genetic metabolic disorders by a urine test at birth based on GC–MS.
In combination with
See also
- Capillary electrophoresis–mass spectrometry
- Ion-mobility spectrometry–mass spectrometry
- Liquid chromatography–mass spectrometry
- Prolate trochoidal mass spectrometer
- Pyrolysis–gas chromatography–mass spectrometry
References
- ISBN 978-0-08-092015-3.
- ^ Jones M. "Gas Chromatography-Mass Spectrometry". American Chemical Society. Retrieved 19 Nov 2019.
- PMID 26434689.
- S2CID 97838389.
- ISSN 0003-2700.
- .
- ^ a b c Brock DC (2011). "A Measure of Success". Chemical Heritage Magazine. 29 (1). Retrieved 22 March 2018.
- ^ Webb-Halpern L (2008). "Detecting Success". Chemical Heritage Magazine. 26 (2): 31.
- ^ "Thermo Instrument Systems Inc. History". International Directory of Company Histories (Volume 11 ed.). St. James Press. 1995. pp. 513–514. Retrieved 23 January 2015.
- ^ "Optimizing the Analysis of Volatile Organic Compounds – Technical Guide" Restek Corporation, Lit. Cat. 59887A
- S2CID 992748.
- .
- PMID 24222034.
- ^ Standard Reference Data. nist.gov
- ^ Wiley's Scientific, Technical, and Medical Databases: Home. wiley.com
- ^ Mass Spectrometry Database Committee. ualberta.ca
- ^ PMID 18225851.
- ^ a b SMB–MS (Supersonic GC–MS). tau.ac.il
- PMID 16897787.
- ^ "IGCSE Coordinated Science:Identification of Ion and Gases | University of Cambridge - KeepNotes". keepnotes.com. Retrieved 2023-12-29.
- S2CID 52989098.
- ISBN 9783527674336. Retrieved 22 January 2018.
- ISBN 9783527674336. Retrieved 22 January 2018.
- .
- .
- .
- PMID 12510732.
- .
- ^ Unuh MH, Muhamad P, Waziralilah NF, Amran MH (2019). "Characterization of Vehicle Smart Fluid using Gas Chromatography-Mass Spectrometry (GCMS)" (PDF). Journal of Advanced Research in Fluid Mechanics and Thermal Sciences. 55 (2): 240–248.
- ^ SEARCHING FOR LIFE ON MARS: The Development of the Viking GCMS. NASA
- S2CID 4369293.
- S2CID 4344046.
- ^ "MSL Science Corner: Sample Analysis at Mars (SAM)". msl-scicorner.jpl.nasa.gov. Archived from the original on 2009-03-20. Retrieved 2019-06-25.
- PMID 16225435.
Bibliography
- Adams RP (2007). Identification of Essential Oil Components By Gas Chromatography/Mass Spectrometry. Allured Pub Corp. ISBN 978-1-932633-21-4.
- Adlard ER, Handley AJ (2001). Gas chromatographic techniques and applications. London: Sheffield Academic. ISBN 978-0-8493-0521-4.
- Barry EF, Grob RE (2004). Modern practice of gas chromatography. New York: Wiley-Interscience. ISBN 978-0-471-22983-4.
- Eiceman GA (2000). "Gas Chromatography". In Meyers RA (ed.). Encyclopedia of Analytical Chemistry: Applications, Theory, and Instrumentation. Chichester: Wiley. p. 10627. ISBN 0-471-97670-9.
- Giannelli PC, Imwinkelried EJ (1999). "Drug Identification: Gas Chromatography.". Scientific Evidence. Vol. 2. Charlottesville: Lexis Law Publishing. p. 362. ISBN 0-327-04985-5.
- McEwen CN, Kitson FG, Larsen BS (1996). Gas chromatography and mass spectrometry: a practical guide. Boston: Academic Press. ISBN 978-0-12-483385-2.
- McMaster C, McMaster MC (1998). GC/MS: a practical user's guide. New York: Wiley. ISBN 978-0-471-24826-2.
- Message GM (1984). Practical aspects of gas chromatography/mass spectrometry. New York: Wiley. ISBN 978-0-471-06277-6.
- Niessen WM (2001). Current practice of gas chromatography–mass spectrometry. New York, N.Y: Marcel Dekker. ISBN 978-0-8247-0473-5.
- Weber A, Maurer HW, Pfleger K (2007). Mass Spectral and GC Data of Drugs, Poisons, Pesticides, Pollutants and Their Metabolites. Weinheim: Wiley-VCH. ISBN 978-3-527-31538-3.
External links
- Gas+chromatography-mass+spectrometry at the U.S. National Library of Medicine Medical Subject Headings (MeSH)
- Golm Metabolome Database, a mass spectral reference database of plant metabolites
