
Geography of Iran
Total land borders: 5,894 km (3,662 mi) Afghanistan: 921 km (572 mi) Armenia: 44 km (27 mi) Azerbaijan (proper): 432 km (268 mi) Azerbaijan (Nakhchivan exclave): 179 km (111 mi) Iraq: 1,599 km (994 mi) Pakistan: 909 km (565 mi) Turkey: 534 km (332 mi) Turkmenistan: 1,148 km (713 mi) | |
| Highest point | Mount Damavand 5,610 m (18,406 ft) |
|---|---|
| Lowest point | Caspian Sea −28 m (−91.9 ft) |
| Longest river | Karun |
| Largest lake | Lake Urmia |
| Exclusive economic zone | 168,718 km2 (65,142 sq mi) |
Geographically, the country of


Typically, one major town dominated each basin, and there were complex economic relationships between the town and the hundreds of villages that surrounded it. In the higher elevations of the mountains rimming the basins, tribally organized groups practiced transhumance, moving with their herds of sheep and goats between traditionally established summer and winter pastures. There are no major river systems in the country, and historically transportation was by means of caravans that followed routes traversing gaps and passes in the mountains. The mountains also impeded easy access to the Persian Gulf and the Caspian Sea.
With an area of 1,648,195 square kilometres (636,372 sq mi), Iran ranks seventeenth in size among the countries of the world. Iran shares
The Persian Gulf and Gulf of Oman
Topography


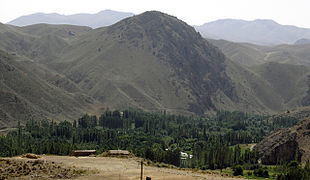
The topography of Iran consists of rugged, mountainous rims surrounding high interior basins. The main mountain chain is the Zagros Mountains, a series of parallel ridges interspersed with plains that bisect the country from northwest to southeast. Many peaks in the Zagros exceed 3,000 metres (9,843 ft) above sea level, and in the south-central region of the country there are at least five peaks that are over 4,000 metres (13,123 ft).
As the Zagros continue into southeastern Iran, the average elevation of the peaks declines dramatically to under 1,500 metres (4,921 ft). Rimming the Caspian Sea littoral is another chain of mountains, the narrow but high Alborz Mountains. Volcanic Mount Damavand, 5,610 metres (18,406 ft), located in the center of the Alborz, is not only the country's highest peak but also the highest mountain on the Eurasian landmass west of the Hindu Kush.
The center of Iran consists of several closed basins that collectively are referred to as the Central Plateau. The average elevation of this plateau is about 900 metres (2,953 ft), but several of the mountains that tower over the plateau exceed 3,000 metres (9,843 ft). The eastern part of the plateau is covered by two salt deserts, the Dasht-e Kavir (Great Salt Desert) and the Dasht-e Lut. Except for some scattered oases, these deserts are uninhabited.
Parts of northwestern Iran are part of the Armenian highlands, which adjoins it topographically with other parts of neighbouring Turkey, Armenia, Azerbaijan, and Georgia.[4]
Iran has only two expanses of lowlands: the Khuzestan Plain in the southwest and the Caspian Sea coastal plain in the north. The former is a roughly triangular-shaped extension of the Mesopotamia plain and averages about 160 kilometres (99 mi) in width. It extends for about 120 kilometres (75 mi) inland, barely rising a few meters above sea level, then meets abruptly with the first foothills of the Zagros. Much of the Khuzestan plain is covered with marshes.
The Caspian plain is both longer and narrower. It extends for some 640 kilometres (400 mi) along the Caspian shore, but its widest point is less than 50 kilometres (31 mi), while at some places less than 2 kilometres (1.2 mi) separate the shore from the Alborz foothills. The Persian Gulf coast south of Khuzestan and the Gulf of Oman coast have no real plains because the Zagros in these areas come right down to the shore.
There are no major rivers in the country. Of the small rivers and streams, the only one that is navigable is the 830 kilometres (520 mi)-long
On the Central Plateau, numerous rivers—most of which have dry beds for the greater part of the year—form from snow melting in the mountains during the spring and flow through permanent channels, draining eventually into salt lakes that also tend to dry up during the summer months. There is a permanent salt lake,
Iran's highlands are home to some of the world's most unexpected glaciers. Their appearance in the dry environment is advantageous for those who depend on glacial ice as a supply of fresh water. In an expedition, Klaus Thymann together with the environmental charity Project Pressure produced a series of archive and expedition photographs that depict the urgency of the situation surrounding climate change and the individuals who rely on such natural ice forms to sustain life in remote areas.[5]

A recent global remote sensing analysis suggested that there were 1,481 km2 of tidal flats in Iran, making it the 22nd ranked country in terms of tidal flat area.[6]
Climate
Iran has a diverse climate. In the northwest, winters are cold with heavy snowfalls and sub-freezing temperatures. Spring and fall are relatively mild, while summers are dry and hot. In the south, winters are mild and summers are very hot, with average daily maximum temperature exceeding 38 °C (100.4 °F) in the month of July. On the Khuzestan Plain, summer heat is accompanied by high humidity.
In general, Iran has a temperate climate in which most of the relatively scant annual precipitation falls from October through April. In most of the country, yearly precipitation averages 400 millimetres (15.7 in) or less. The major exceptions are the higher mountain valleys of the Zagros and the Caspian coastal plain, where precipitation averages at least 600 millimetres (24 in) and is in the form of snow at high altitudes. In the western part of the Caspian, rainfall exceeds 1,500 millimetres (59 in) annually and is distributed relatively evenly throughout the year. This contrasts with some basins of the Central Plateau that receive 100 millimetres (4 in) or less of precipitation. Iran is considered colder than neighboring countries such as Iraq and Turkmenistan, due to its higher elevation.
 |
Caspian mild and wet
Caspian mild
Mediterranean with spring rains
Mediterranean
Cold mountains
Very cold mountains
Cold semi-desert
Hot semi-desert
Dry desert
Hot dry desert
Hot coastal dry
Coastal dry
|
Examples
| Climate data for Tehran Mehrabad - Altitude: 1190.8 m (1951-2010) | |||||||||||||
|---|---|---|---|---|---|---|---|---|---|---|---|---|---|
| Month | Jan | Feb | Mar | Apr | May | Jun | Jul | Aug | Sep | Oct | Nov | Dec | Year |
| Record high °C (°F) | 19.6 (67.3) |
23.0 (73.4) |
29.4 (84.9) |
33.4 (92.1) |
37.0 (98.6) |
41.0 (105.8) |
43.0 (109.4) |
42.0 (107.6) |
38.0 (100.4) |
33.4 (92.1) |
26.4 (79.5) |
21.0 (69.8) |
43.0 (109.4) |
| Mean daily maximum °C (°F) | 7.9 (46.2) |
10.6 (51.1) |
15.7 (60.3) |
22.2 (72.0) |
28.0 (82.4) |
34.0 (93.2) |
36.7 (98.1) |
35.7 (96.3) |
31.6 (88.9) |
24.5 (76.1) |
16.3 (61.3) |
10.1 (50.2) |
22.8 (73.0) |
| Daily mean °C (°F) | 3.8 (38.8) |
6.0 (42.8) |
10.7 (51.3) |
16.8 (62.2) |
22.1 (71.8) |
27.5 (81.5) |
30.3 (86.5) |
29.5 (85.1) |
25.5 (77.9) |
19.0 (66.2) |
11.6 (52.9) |
5.9 (42.6) |
17.4 (63.3) |
| Mean daily minimum °C (°F) | −0.4 (31.3) |
1.4 (34.5) |
5.7 (42.3) |
11.4 (52.5) |
16.3 (61.3) |
21.1 (70.0) |
24.0 (75.2) |
23.4 (74.1) |
19.4 (66.9) |
13.5 (56.3) |
6.8 (44.2) |
1.8 (35.2) |
12.0 (53.7) |
| Record low °C (°F) | −15.0 (5.0) |
−13.0 (8.6) |
−8.0 (17.6) |
−4.0 (24.8) |
2.4 (36.3) |
5.0 (41.0) |
14.0 (57.2) |
13.0 (55.4) |
9.0 (48.2) |
2.8 (37.0) |
−7.0 (19.4) |
−13.0 (8.6) |
−15.0 (5.0) |
| Average precipitation mm (inches) | 34.6 (1.36) |
33.2 (1.31) |
39.6 (1.56) |
31.9 (1.26) |
14.8 (0.58) |
3.0 (0.12) |
2.2 (0.09) |
1.7 (0.07) |
1.2 (0.05) |
10.7 (0.42) |
26.1 (1.03) |
33.7 (1.33) |
232.7 (9.18) |
| Average precipitation days | 9.0 | 8.6 | 10.7 | 10.8 | 8.8 | 3.1 | 2.1 | 1.3 | 1.1 | 5.3 | 7.2 | 8.6 | 76.6 |
| Average snowy days | 5.1 | 2.9 | 1.1 | 0.1 | 0.0 | 0.0 | 0.0 | 0.0 | 0.0 | 0.0 | 0.4 | 2.7 | 12.3 |
| Average relative humidity (%)
|
64 | 56 | 47 | 40 | 33 | 25 | 26 | 26 | 27 | 36 | 49 | 62 | 41 |
| Mean monthly sunshine hours | 168.8 | 179.8 | 203.0 | 220.6 | 287.0 | 346.3 | 345.9 | 333.6 | 302.8 | 249.9 | 202.9 | 168.9 | 3,009.5 |
| Average ultraviolet index | 2 | 3 | 3 | 5 | 6 | 7 | 7 | 7 | 5 | 4 | 3 | 2 | 5 |
| Source 1: Iran Meteorological Organization (records),[7] (temperatures),[8] (precipitation),[9] (humidity),[10] (days with precipitation),[11] | |||||||||||||
| Source 2: Weather Atlas (UV),[14] | |||||||||||||
| Climate data for Tehran-Shomal (north of Tehran), altitude: 1549.1 m, from 1988–2010. | |||||||||||||
|---|---|---|---|---|---|---|---|---|---|---|---|---|---|
| Month | Jan | Feb | Mar | Apr | May | Jun | Jul | Aug | Sep | Oct | Nov | Dec | Year |
| Record high °C (°F) | 17.2 (63.0) |
21.2 (70.2) |
29.0 (84.2) |
32.4 (90.3) |
33.6 (92.5) |
39.2 (102.6) |
40.4 (104.7) |
39.6 (103.3) |
36.2 (97.2) |
31.2 (88.2) |
23.6 (74.5) |
19.6 (67.3) |
40.4 (104.7) |
| Mean daily maximum °C (°F) | 6.1 (43.0) |
8.6 (47.5) |
13.8 (56.8) |
20.0 (68.0) |
25.5 (77.9) |
31.6 (88.9) |
34.4 (93.9) |
33.6 (92.5) |
29.5 (85.1) |
22.8 (73.0) |
14.5 (58.1) |
8.6 (47.5) |
20.8 (69.4) |
| Daily mean °C (°F) | 2.3 (36.1) |
4.4 (39.9) |
9.2 (48.6) |
14.9 (58.8) |
19.8 (67.6) |
25.6 (78.1) |
28.5 (83.3) |
27.6 (81.7) |
23.4 (74.1) |
17.2 (63.0) |
9.9 (49.8) |
4.8 (40.6) |
15.6 (60.1) |
| Mean daily minimum °C (°F) | −1.5 (29.3) |
0.2 (32.4) |
4.6 (40.3) |
9.8 (49.6) |
14.2 (57.6) |
19.7 (67.5) |
22.6 (72.7) |
21.6 (70.9) |
17.3 (63.1) |
11.7 (53.1) |
5.3 (41.5) |
0.9 (33.6) |
10.5 (51.0) |
| Record low °C (°F) | −13.0 (8.6) |
−11.0 (12.2) |
−8.0 (17.6) |
−1.6 (29.1) |
3.0 (37.4) |
12.0 (53.6) |
15.4 (59.7) |
13.5 (56.3) |
8.8 (47.8) |
2.6 (36.7) |
−5.2 (22.6) |
−9.6 (14.7) |
−13.0 (8.6) |
| Average precipitation mm (inches) | 61.9 (2.44) |
68.3 (2.69) |
73.9 (2.91) |
53.2 (2.09) |
24.0 (0.94) |
4.9 (0.19) |
3.8 (0.15) |
2.5 (0.10) |
3.8 (0.15) |
18.4 (0.72) |
41.5 (1.63) |
64.3 (2.53) |
420.5 (16.54) |
| Average precipitation days | 12.3 | 10.9 | 12.3 | 10.0 | 8.9 | 3.3 | 3.4 | 1.6 | 1.3 | 5.8 | 8.6 | 10.7 | 89.1 |
| Average snowy days | 8.9 | 6.6 | 2.5 | 0.1 | 0.1 | 0 | 0 | 0 | 0 | 0 | 0.6 | 4.9 | 23.7 |
| Average relative humidity (%)
|
67 | 59 | 53 | 44 | 39 | 30 | 31 | 31 | 33 | 44 | 57 | 66 | 46 |
| Mean monthly sunshine hours | 135.8 | 146.4 | 185.1 | 215.0 | 274.6 | 322.8 | 331.8 | 327.5 | 292.6 | 245.5 | 171.5 | 135.8 | 2,784.4 |
| Source: [15] | |||||||||||||
| Climate data for Mashhad (1951–2010, extremes 1951–2010) | |||||||||||||
|---|---|---|---|---|---|---|---|---|---|---|---|---|---|
| Month | Jan | Feb | Mar | Apr | May | Jun | Jul | Aug | Sep | Oct | Nov | Dec | Year |
| Record high °C (°F) | 20.0 (68.0) |
22.0 (71.6) |
28.0 (82.4) |
30.4 (86.7) |
35.2 (95.4) |
38.6 (101.5) |
43.8 (110.8) |
40.4 (104.7) |
38.0 (100.4) |
33.8 (92.8) |
28.4 (83.1) |
22.2 (72.0) |
43.8 (110.8) |
| Mean daily maximum °C (°F) | 6.1 (43.0) |
7.3 (45.1) |
12.2 (54.0) |
17.9 (64.2) |
24.8 (76.6) |
30.3 (86.5) |
32.4 (90.3) |
31.1 (88.0) |
25.9 (78.6) |
20.5 (68.9) |
13.5 (56.3) |
8.1 (46.6) |
21.2 (70.2) |
| Daily mean °C (°F) | 1.7 (35.1) |
3.7 (38.7) |
8.5 (47.3) |
14.7 (58.5) |
19.6 (67.3) |
24.4 (75.9) |
26.6 (79.9) |
24.8 (76.6) |
20.3 (68.5) |
14.5 (58.1) |
8.7 (47.7) |
4.0 (39.2) |
14.3 (57.7) |
| Mean daily minimum °C (°F) | −5.8 (21.6) |
−4.3 (24.3) |
2.9 (37.2) |
6.4 (43.5) |
10.4 (50.7) |
14.4 (57.9) |
16.7 (62.1) |
14.5 (58.1) |
9.7 (49.5) |
4.4 (39.9) |
−1.9 (28.6) |
−3.7 (25.3) |
7.3 (45.1) |
| Record low °C (°F) | −27.0 (−16.6) |
−32.0 (−25.6) |
−13.0 (8.6) |
−7.0 (19.4) |
−1.0 (30.2) |
4.0 (39.2) |
10.0 (50.0) |
5.0 (41.0) |
−1.0 (30.2) |
−8.0 (17.6) |
−16.0 (3.2) |
−25.0 (−13.0) |
−32.0 (−25.6) |
| Average precipitation mm (inches) | 32.6 (1.28) |
34.5 (1.36) |
55.5 (2.19) |
45.4 (1.79) |
27.2 (1.07) |
4.0 (0.16) |
1.1 (0.04) |
0.7 (0.03) |
2.1 (0.08) |
8.0 (0.31) |
16.1 (0.63) |
24.3 (0.96) |
251.5 (9.90) |
| Average precipitation days (≥ 1.0 mm) | 5.6 | 5.8 | 8.2 | 6.8 | 4.5 | 1.1 | 0.3 | 0.2 | 0.5 | 1.5 | 2.9 | 4.2 | 41.6 |
| Average snowy days | 5.6 | 5.8 | 4.0 | 0.4 | 0.0 | 0.0 | 0.0 | 0.0 | 0.0 | 0.1 | 1.2 | 3.8 | 20.9 |
| Average relative humidity (%)
|
75 | 73 | 69 | 62 | 50 | 37 | 34 | 33 | 37 | 49 | 63 | 73 | 54 |
| Mean monthly sunshine hours | 148.3 | 147.5 | 163.3 | 200.4 | 280.4 | 343.2 | 366.9 | 359.7 | 305.2 | 249.5 | 188.3 | 151.6 | 2,904.3 |
| Source: Iran Meteorological Organization (records),[16] (temperatures),[17] (precipitation),[18] (humidity),[19] (days with precipitation),[20] | |||||||||||||
| Climate data for Isfahan (1961–1990, extremes 1951–2010) | |||||||||||||
|---|---|---|---|---|---|---|---|---|---|---|---|---|---|
| Month | Jan | Feb | Mar | Apr | May | Jun | Jul | Aug | Sep | Oct | Nov | Dec | Year |
| Record high °C (°F) | 20.4 (68.7) |
23.4 (74.1) |
29.0 (84.2) |
32.0 (89.6) |
37.6 (99.7) |
41.0 (105.8) |
43.0 (109.4) |
42.0 (107.6) |
39.0 (102.2) |
33.2 (91.8) |
26.8 (80.2) |
21.2 (70.2) |
43.0 (109.4) |
| Mean daily maximum °C (°F) | 8.8 (47.8) |
11.9 (53.4) |
16.8 (62.2) |
22.0 (71.6) |
28.0 (82.4) |
34.1 (93.4) |
36.4 (97.5) |
35.1 (95.2) |
31.2 (88.2) |
24.4 (75.9) |
16.9 (62.4) |
10.8 (51.4) |
23.0 (73.4) |
| Daily mean °C (°F) | 2.7 (36.9) |
5.5 (41.9) |
10.4 (50.7) |
15.7 (60.3) |
21.3 (70.3) |
27.1 (80.8) |
29.4 (84.9) |
27.9 (82.2) |
23.5 (74.3) |
16.9 (62.4) |
9.9 (49.8) |
4.4 (39.9) |
16.2 (61.2) |
| Mean daily minimum °C (°F) | −2.4 (27.7) |
−0.2 (31.6) |
4.5 (40.1) |
9.4 (48.9) |
14.2 (57.6) |
19.1 (66.4) |
21.5 (70.7) |
19.8 (67.6) |
15.1 (59.2) |
9.3 (48.7) |
3.6 (38.5) |
−0.9 (30.4) |
9.4 (48.9) |
| Record low °C (°F) | −19.4 (−2.9) |
−12.2 (10.0) |
−8.0 (17.6) |
−4.0 (24.8) |
4.5 (40.1) |
10.0 (50.0) |
13.0 (55.4) |
11.0 (51.8) |
5.0 (41.0) |
0.0 (32.0) |
−8.0 (17.6) |
−13.0 (8.6) |
−19.4 (−2.9) |
| Average precipitation mm (inches) | 17.1 (0.67) |
14.1 (0.56) |
18.2 (0.72) |
19.2 (0.76) |
8.8 (0.35) |
0.6 (0.02) |
0.7 (0.03) |
0.2 (0.01) |
0.0 (0.0) |
4.1 (0.16) |
9.9 (0.39) |
19.6 (0.77) |
112.5 (4.43) |
| Average precipitation days (≥ 1.0 mm) | 4.0 | 2.9 | 3.8 | 3.5 | 2.0 | 0.2 | 0.3 | 0.1 | 0.0 | 0.8 | 2.2 | 3.7 | 23.5 |
| Average snowy days | 3.2 | 1.7 | 0.7 | 0.1 | 0.0 | 0.0 | 0.0 | 0.0 | 0.0 | 0.0 | 0.2 | 1.9 | 7.8 |
| Average relative humidity (%)
|
60 | 51 | 43 | 39 | 33 | 23 | 23 | 24 | 26 | 36 | 48 | 57 | 39 |
| Mean monthly sunshine hours | 205.3 | 213.3 | 242.1 | 244.5 | 301.3 | 345.4 | 347.6 | 331.2 | 311.6 | 276.5 | 226.1 | 207.6 | 3,252.5 |
| Source 1: NOAA[23] | |||||||||||||
| Source 2: Iran Meteorological Organization (records)[24][25] | |||||||||||||
| Climate data for Karaj (1985–2010) | |||||||||||||
|---|---|---|---|---|---|---|---|---|---|---|---|---|---|
| Month | Jan | Feb | Mar | Apr | May | Jun | Jul | Aug | Sep | Oct | Nov | Dec | Year |
| Record high °C (°F) | 18.2 (64.8) |
19.8 (67.6) |
27.4 (81.3) |
33.0 (91.4) |
34.6 (94.3) |
39.2 (102.6) |
42.0 (107.6) |
40.2 (104.4) |
37.2 (99.0) |
31.8 (89.2) |
25.0 (77.0) |
20.0 (68.0) |
42.0 (107.6) |
| Mean daily maximum °C (°F) | 6.1 (43.0) |
9.0 (48.2) |
14.2 (57.6) |
20.7 (69.3) |
26.2 (79.2) |
32.6 (90.7) |
35.2 (95.4) |
34.5 (94.1) |
30.4 (86.7) |
23.5 (74.3) |
15.1 (59.2) |
8.9 (48.0) |
21.4 (70.5) |
| Daily mean °C (°F) | 1.8 (35.2) |
4.1 (39.4) |
8.7 (47.7) |
14.5 (58.1) |
19.2 (66.6) |
24.6 (76.3) |
27.1 (80.8) |
26.8 (80.2) |
22.9 (73.2) |
17.1 (62.8) |
9.9 (49.8) |
4.6 (40.3) |
15.1 (59.2) |
| Mean daily minimum °C (°F) | −2.5 (27.5) |
−0.7 (30.7) |
3.2 (37.8) |
8.4 (47.1) |
12.2 (54.0) |
16.5 (61.7) |
19.0 (66.2) |
19.1 (66.4) |
15.3 (59.5) |
10.8 (51.4) |
4.8 (40.6) |
0.3 (32.5) |
8.9 (48.0) |
| Record low °C (°F) | −19.0 (−2.2) |
−15.6 (3.9) |
−10.5 (13.1) |
−3.5 (25.7) |
−0.4 (31.3) |
7.2 (45.0) |
10.6 (51.1) |
12.0 (53.6) |
7.0 (44.6) |
−0.5 (31.1) |
−6.0 (21.2) |
−14.6 (5.7) |
−19.0 (−2.2) |
| Average precipitation mm (inches) | 30.8 (1.21) |
32.1 (1.26) |
45.4 (1.79) |
39.1 (1.54) |
19.5 (0.77) |
2.7 (0.11) |
3.0 (0.12) |
1.2 (0.05) |
1.6 (0.06) |
15.1 (0.59) |
27.7 (1.09) |
33.5 (1.32) |
251.7 (9.91) |
| Average precipitation days (≥ 1.0 mm) | 6.3 | 5.7 | 6.7 | 5.8 | 3.7 | 1.0 | 0.7 | 0.3 | 0.3 | 3.2 | 4.8 | 5.8 | 44.3 |
| Average snowy days | 5.4 | 3.7 | 1.9 | 0.1 | 0.0 | 0.0 | 0.0 | 0.0 | 0.0 | 0.0 | 0.5 | 2.7 | 14.3 |
| Average relative humidity (%)
|
67 | 60 | 53 | 48 | 43 | 34 | 35 | 34 | 36 | 44 | 56 | 66 | 48 |
| Mean monthly sunshine hours | 166.3 | 169.7 | 197.4 | 218.1 | 280.7 | 335.2 | 341.5 | 340.1 | 304.2 | 250.1 | 187.2 | 156.8 | 2,947.3 |
| Source: Iran Meteorological Organization (records),[26] (temperatures),[27] (precipitation),[28] (humidity),[29] (days with precipitation and snow),[30] (sunshine)[31] | |||||||||||||
| Climate data for Shiraz (1961–1990, extremes 1951–2010) | |||||||||||||
|---|---|---|---|---|---|---|---|---|---|---|---|---|---|
| Month | Jan | Feb | Mar | Apr | May | Jun | Jul | Aug | Sep | Oct | Nov | Dec | Year |
| Record high °C (°F) | 22.4 (72.3) |
24.0 (75.2) |
30.6 (87.1) |
34.0 (93.2) |
38.6 (101.5) |
42.0 (107.6) |
43.2 (109.8) |
42.0 (107.6) |
39.0 (102.2) |
34.4 (93.9) |
28.4 (83.1) |
23.2 (73.8) |
43.2 (109.8) |
| Mean daily maximum °C (°F) | 12.1 (53.8) |
14.7 (58.5) |
18.9 (66.0) |
23.8 (74.8) |
30.6 (87.1) |
36.1 (97.0) |
37.8 (100.0) |
37.0 (98.6) |
33.7 (92.7) |
27.8 (82.0) |
20.5 (68.9) |
14.4 (57.9) |
25.6 (78.1) |
| Daily mean °C (°F) | 5.3 (41.5) |
7.7 (45.9) |
11.8 (53.2) |
16.2 (61.2) |
22.5 (72.5) |
27.7 (81.9) |
29.8 (85.6) |
28.7 (83.7) |
24.5 (76.1) |
18.4 (65.1) |
11.7 (53.1) |
6.8 (44.2) |
17.6 (63.7) |
| Mean daily minimum °C (°F) | −0.4 (31.3) |
1.2 (34.2) |
4.8 (40.6) |
8.5 (47.3) |
13.2 (55.8) |
17.1 (62.8) |
19.9 (67.8) |
18.8 (65.8) |
14.1 (57.4) |
8.8 (47.8) |
3.8 (38.8) |
0.5 (32.9) |
9.2 (48.6) |
| Record low °C (°F) | −14.0 (6.8) |
−8.0 (17.6) |
−4.0 (24.8) |
−2.0 (28.4) |
3.0 (37.4) |
9.0 (48.2) |
14.0 (57.2) |
12.0 (53.6) |
1.0 (33.8) |
1.6 (34.9) |
−8.0 (17.6) |
−11.0 (12.2) |
−14.0 (6.8) |
| Average precipitation mm (inches) | 79.8 (3.14) |
49.8 (1.96) |
48.4 (1.91) |
30.6 (1.20) |
6.6 (0.26) |
0.2 (0.01) |
1.0 (0.04) |
0.1 (0.00) |
0.0 (0.0) |
5.2 (0.20) |
20.7 (0.81) |
63.2 (2.49) |
305.6 (12.03) |
| Average rainy days | 8.7 | 7.9 | 7.9 | 6.4 | 2.1 | 0.2 | 0.8 | 0.4 | 0.1 | 1.2 | 3.7 | 7.2 | 46.6 |
| Average snowy days | 1.5 | 0.6 | 0.0 | 0.0 | 0.0 | 0.0 | 0.0 | 0.0 | 0.0 | 0.0 | 0.0 | 0.6 | 2.7 |
| Average relative humidity (%)
|
65 | 58 | 51 | 46 | 32 | 22 | 24 | 24 | 26 | 34 | 48 | 61 | 41 |
| Mean monthly sunshine hours | 217.0 | 218.5 | 236.2 | 247.7 | 324.1 | 357.8 | 344.6 | 329.7 | 318.0 | 297.7 | 238.3 | 216.2 | 3,345.8 |
| Source 1: NOAA[32] | |||||||||||||
| Source 2: Iran Meteorological Organization (records)[33][34] | |||||||||||||
| Climate data for Tabriz (1951–2010, extremes 1951–2010) | |||||||||||||
|---|---|---|---|---|---|---|---|---|---|---|---|---|---|
| Month | Jan | Feb | Mar | Apr | May | Jun | Jul | Aug | Sep | Oct | Nov | Dec | Year |
| Record high °C (°F) | 16.0 (60.8) |
19.0 (66.2) |
25.6 (78.1) |
31.2 (88.2) |
33.8 (92.8) |
39.0 (102.2) |
42.0 (107.6) |
41.0 (105.8) |
38.0 (100.4) |
30.6 (87.1) |
23.4 (74.1) |
21.8 (71.2) |
42.0 (107.6) |
| Mean daily maximum °C (°F) | 2.3 (36.1) |
4.9 (40.8) |
10.6 (51.1) |
17.0 (62.6) |
22.8 (73.0) |
28.8 (83.8) |
32.8 (91.0) |
32.7 (90.9) |
28.3 (82.9) |
20.7 (69.3) |
12.0 (53.6) |
5.2 (41.4) |
18.2 (64.8) |
| Daily mean °C (°F) | −1.7 (28.9) |
0.5 (32.9) |
5.6 (42.1) |
11.5 (52.7) |
16.7 (62.1) |
22.1 (71.8) |
26.0 (78.8) |
25.9 (78.6) |
21.4 (70.5) |
14.5 (58.1) |
7.1 (44.8) |
1.2 (34.2) |
12.6 (54.7) |
| Mean daily minimum °C (°F) | −5.7 (21.7) |
−3.9 (25.0) |
0.6 (33.1) |
6.0 (42.8) |
10.7 (51.3) |
15.4 (59.7) |
19.3 (66.7) |
19.1 (66.4) |
14.5 (58.1) |
8.4 (47.1) |
2.1 (35.8) |
−2.9 (26.8) |
7.0 (44.6) |
| Record low °C (°F) | −30.0 (−22.0) |
−25.0 (−13.0) |
−20.0 (−4.0) |
−15.0 (5.0) |
0.6 (33.1) |
4.0 (39.2) |
7.0 (44.6) |
10.0 (50.0) |
4.0 (39.2) |
−4.0 (24.8) |
−17.0 (1.4) |
−23.5 (−10.3) |
−30.0 (−22.0) |
| Average precipitation mm (inches) | 24.0 (0.94) |
28.2 (1.11) |
45.0 (1.77) |
56.6 (2.23) |
43.1 (1.70) |
19.4 (0.76) |
5.6 (0.22) |
3.3 (0.13) |
10.9 (0.43) |
24.5 (0.96) |
30.1 (1.19) |
24.1 (0.95) |
318.8 (12.55) |
| Average rainy days | 6.9 | 7.3 | 10.7 | 14.8 | 9.3 | 3.2 | 1.2 | 0.6 | 1.9 | 4.9 | 5.5 | 6.3 | 72.6 |
| Average snowy days | 11.3 | 9.9 | 5.9 | 1.0 | 0.0 | 0.0 | 0.0 | 0.0 | 0.0 | 0.2 | 1.8 | 8.2 | 38.4 |
| Average relative humidity (%)
|
72 | 69 | 61 | 56 | 50 | 40 | 36 | 36 | 39 | 51 | 65 | 71 | 53 |
| Mean monthly sunshine hours | 125.9 | 146.3 | 179.7 | 200.8 | 268.7 | 334.3 | 352.5 | 337.7 | 301.4 | 231.6 | 180.3 | 136.8 | 2,796 |
| Source: Iran Meteorological Organization (records),[35] (temperatures),[36] (precipitation),[37] (humidity),[38] (days with precipitation),[39][40]
(sunshine)[41] | |||||||||||||
| Climate data for Qom (1986–2010) | |||||||||||||
|---|---|---|---|---|---|---|---|---|---|---|---|---|---|
| Month | Jan | Feb | Mar | Apr | May | Jun | Jul | Aug | Sep | Oct | Nov | Dec | Year |
| Record high °C (°F) | 23.4 (74.1) |
26.5 (79.7) |
35.5 (95.9) |
36.5 (97.7) |
41.5 (106.7) |
44.2 (111.6) |
47.0 (116.6) |
45.5 (113.9) |
41.6 (106.9) |
36.6 (97.9) |
28.6 (83.5) |
22.5 (72.5) |
47.0 (116.6) |
| Mean daily maximum °C (°F) | 10.2 (50.4) |
13.6 (56.5) |
19.1 (66.4) |
26.0 (78.8) |
31.8 (89.2) |
37.9 (100.2) |
40.3 (104.5) |
39.4 (102.9) |
34.9 (94.8) |
27.7 (81.9) |
18.9 (66.0) |
12.2 (54.0) |
26.0 (78.8) |
| Daily mean °C (°F) | 4.2 (39.6) |
7.1 (44.8) |
12.0 (53.6) |
18.3 (64.9) |
23.6 (74.5) |
29.1 (84.4) |
31.8 (89.2) |
30.3 (86.5) |
25.2 (77.4) |
19.0 (66.2) |
11.5 (52.7) |
6.1 (43.0) |
18.2 (64.8) |
| Mean daily minimum °C (°F) | −1.9 (28.6) |
0.6 (33.1) |
5.0 (41.0) |
10.5 (50.9) |
15.4 (59.7) |
20.2 (68.4) |
23.4 (74.1) |
21.2 (70.2) |
15.6 (60.1) |
10.3 (50.5) |
4.1 (39.4) |
−0.1 (31.8) |
10.4 (50.7) |
| Record low °C (°F) | −23 (−9) |
−11.2 (11.8) |
−11 (12) |
0.4 (32.7) |
5.4 (41.7) |
8.0 (46.4) |
15.0 (59.0) |
13.5 (56.3) |
6.5 (43.7) |
0.6 (33.1) |
−7 (19) |
−10.5 (13.1) |
−23 (−9) |
| Average precipitation mm (inches) | 25.4 (1.00) |
20.5 (0.81) |
27.7 (1.09) |
20.2 (0.80) |
10.4 (0.41) |
2.3 (0.09) |
0.7 (0.03) |
0.3 (0.01) |
0.8 (0.03) |
6.2 (0.24) |
14.3 (0.56) |
19.4 (0.76) |
148.2 (5.83) |
| Average precipitation days (≥ 1.0 mm) | 4.4 | 4.1 | 4.2 | 3.9 | 2.0 | 0.4 | 0.2 | 0.1 | 0.3 | 1.8 | 2.6 | 3.2 | 27.2 |
| Average snowy days | 3.1 | 1.4 | 0.3 | 0.0 | 0.0 | 0.0 | 0.0 | 0.0 | 0.0 | 0.0 | 0.1 | 0.9 | 5.8 |
| Average relative humidity (%)
|
66 | 58 | 48 | 42 | 33 | 24 | 23 | 24 | 26 | 38 | 52 | 66 | 41 |
| Mean monthly sunshine hours | 185.0 | 194.0 | 221.5 | 233.3 | 296.6 | 351.5 | 354.5 | 347.3 | 309.9 | 263.4 | 204.9 | 172.7 | 3,134.6 |
| Source: Iran Meteorological Organization (records),[42] (temperatures),[43] (precipitation),[44] (humidity),[45] (days with precipitation and snow),[46] (sunshine)[47] | |||||||||||||
| Climate data for Ahvaz (1951–2010) | |||||||||||||
|---|---|---|---|---|---|---|---|---|---|---|---|---|---|
| Month | Jan | Feb | Mar | Apr | May | Jun | Jul | Aug | Sep | Oct | Nov | Dec | Year |
| Record high °C (°F) | 28.0 (82.4) |
31.5 (88.7) |
37.6 (99.7) |
43.0 (109.4) |
48.6 (119.5) |
51.0 (123.8) |
54.0 (129.2) |
51.6 (124.9) |
48.4 (119.1) |
45.0 (113.0) |
36.0 (96.8) |
29.0 (84.2) |
54.0 (129.2) |
| Mean daily maximum °C (°F) | 17.5 (63.5) |
20.5 (68.9) |
25.5 (77.9) |
32.2 (90.0) |
39.3 (102.7) |
44.6 (112.3) |
46.3 (115.3) |
45.9 (114.6) |
42.5 (108.5) |
36.0 (96.8) |
26.5 (79.7) |
19.4 (66.9) |
33.0 (91.4) |
| Daily mean °C (°F) | 12.3 (54.1) |
14.7 (58.5) |
19.0 (66.2) |
24.9 (76.8) |
31.1 (88.0) |
35.2 (95.4) |
37.3 (99.1) |
36.7 (98.1) |
33.0 (91.4) |
27.3 (81.1) |
19.8 (67.6) |
14.0 (57.2) |
25.4 (77.7) |
| Mean daily minimum °C (°F) | 7.2 (45.0) |
8.8 (47.8) |
12.5 (54.5) |
17.6 (63.7) |
23.0 (73.4) |
25.9 (78.6) |
28.2 (82.8) |
27.4 (81.3) |
23.4 (74.1) |
18.8 (65.8) |
13.0 (55.4) |
8.6 (47.5) |
17.9 (64.2) |
| Record low °C (°F) | −7.0 (19.4) |
−5.0 (23.0) |
−1.0 (30.2) |
6.0 (42.8) |
13.0 (55.4) |
15.0 (59.0) |
19.0 (66.2) |
18.0 (64.4) |
13.0 (55.4) |
8.0 (46.4) |
0.0 (32.0) |
−1.0 (30.2) |
−7.0 (19.4) |
| Average precipitation mm (inches) | 48.2 (1.90) |
26.9 (1.06) |
26.4 (1.04) |
16.1 (0.63) |
4.4 (0.17) |
0.4 (0.02) |
0.1 (0.00) |
0.0 (0.0) |
0.2 (0.01) |
6.4 (0.25) |
31.4 (1.24) |
48.7 (1.92) |
209.2 (8.24) |
| Average precipitation days (≥ 1.0 mm) | 4.9 | 3.6 | 3.6 | 2.8 | 0.8 | 0.1 | 0.0 | 0.0 | 0.0 | 1.0 | 2.9 | 4.5 | 24.2 |
| Average relative humidity (%)
|
71 | 61 | 51 | 41 | 28 | 22 | 24 | 28 | 29 | 38 | 53 | 69 | 43 |
| Mean monthly sunshine hours | 174.7 | 193.2 | 214.1 | 233.8 | 284.4 | 326.2 | 336.1 | 331.2 | 301.8 | 263.5 | 209.5 | 176.4 | 3,044.9 |
Source: Iran Meteorological Organization (records),[48] (temperatures),[49]
| |||||||||||||
| Climate data for Kermanshah, Iran (1961–1990, extremes 1951–2010) | |||||||||||||
|---|---|---|---|---|---|---|---|---|---|---|---|---|---|
| Month | Jan | Feb | Mar | Apr | May | Jun | Jul | Aug | Sep | Oct | Nov | Dec | Year |
| Record high °C (°F) | 20.2 (68.4) |
21.8 (71.2) |
28.4 (83.1) |
33.7 (92.7) |
38.5 (101.3) |
43.0 (109.4) |
44.1 (111.4) |
44.0 (111.2) |
40.4 (104.7) |
34.4 (93.9) |
28.4 (83.1) |
25.4 (77.7) |
44.1 (111.4) |
| Mean daily maximum °C (°F) | 6.5 (43.7) |
8.9 (48.0) |
14.3 (57.7) |
19.7 (67.5) |
25.8 (78.4) |
33.3 (91.9) |
37.8 (100.0) |
37.0 (98.6) |
32.5 (90.5) |
25.0 (77.0) |
16.7 (62.1) |
9.7 (49.5) |
22.3 (72.1) |
| Daily mean °C (°F) | 0.6 (33.1) |
2.5 (36.5) |
7.7 (45.9) |
12.7 (54.9) |
17.6 (63.7) |
23.6 (74.5) |
28.2 (82.8) |
27.2 (81.0) |
22.4 (72.3) |
16.0 (60.8) |
8.9 (48.0) |
3.5 (38.3) |
14.2 (57.6) |
| Mean daily minimum °C (°F) | −4.3 (24.3) |
−3.0 (26.6) |
1.2 (34.2) |
5.1 (41.2) |
8.2 (46.8) |
11.4 (52.5) |
16.1 (61.0) |
15.4 (59.7) |
10.6 (51.1) |
6.4 (43.5) |
1.8 (35.2) |
−1.7 (28.9) |
5.6 (42.1) |
| Record low °C (°F) | −24 (−11) |
−27.0 (−16.6) |
−11.3 (11.7) |
−6.1 (21.0) |
−1.0 (30.2) |
2.0 (35.6) |
8.0 (46.4) |
8.0 (46.4) |
1.2 (34.2) |
−3.5 (25.7) |
−17.0 (1.4) |
−17 (1) |
−27.0 (−16.6) |
| Average precipitation mm (inches) | 67.1 (2.64) |
62.9 (2.48) |
88.9 (3.50) |
69.9 (2.75) |
33.7 (1.33) |
0.5 (0.02) |
0.3 (0.01) |
0.3 (0.01) |
1.3 (0.05) |
29.2 (1.15) |
54.3 (2.14) |
70.3 (2.77) |
478.7 (18.85) |
| Average rainy days | 11.4 | 10.7 | 12.6 | 11.0 | 7.6 | 0.5 | 0.2 | 0.4 | 0.5 | 4.9 | 7.9 | 9.6 | 77.3 |
| Average snowy days | 5.9 | 4.7 | 1.9 | 0.2 | 0.0 | 0.0 | 0.0 | 0.0 | 0.0 | 0.0 | 0.3 | 3.1 | 16.1 |
| Average relative humidity (%)
|
75 | 71 | 62 | 57 | 49 | 28 | 23 | 23 | 25 | 40 | 59 | 71 | 49 |
| Mean monthly sunshine hours | 134.8 | 150.1 | 180.7 | 204.6 | 268.0 | 348.3 | 349.1 | 336.7 | 304.6 | 242.8 | 187.6 | 147.9 | 2,855.2 |
| Source 1: NOAA [54] | |||||||||||||
| Source 2: Iran Meteorological Organization (records)[55][56] | |||||||||||||
| Climate data for Rasht | |||||||||||||
|---|---|---|---|---|---|---|---|---|---|---|---|---|---|
| Month | Jan | Feb | Mar | Apr | May | Jun | Jul | Aug | Sep | Oct | Nov | Dec | Year |
| Record high °C (°F) | 30 (86) |
31 (88) |
38.0 (100.4) |
37 (99) |
37.6 (99.7) |
37 (99) |
37 (99) |
37.2 (99.0) |
40 (104) |
37.4 (99.3) |
36 (97) |
32 (90) |
40 (104) |
| Mean daily maximum °C (°F) | 11.0 (51.8) |
11.2 (52.2) |
13.5 (56.3) |
19.0 (66.2) |
24.0 (75.2) |
28.1 (82.6) |
30.3 (86.5) |
30.2 (86.4) |
26.7 (80.1) |
22.1 (71.8) |
17.5 (63.5) |
13.5 (56.3) |
20.6 (69.1) |
| Daily mean °C (°F) | 6.7 (44.1) |
7.0 (44.6) |
9.4 (48.9) |
14.3 (57.7) |
19.2 (66.6) |
23.2 (73.8) |
25.3 (77.5) |
25.3 (77.5) |
22.2 (72.0) |
17.7 (63.9) |
12.9 (55.2) |
8.9 (48.0) |
16.0 (60.8) |
| Mean daily minimum °C (°F) | 2.4 (36.3) |
2.7 (36.9) |
5.3 (41.5) |
9.6 (49.3) |
14.4 (57.9) |
18.2 (64.8) |
20.4 (68.7) |
20.3 (68.5) |
17.6 (63.7) |
13.3 (55.9) |
8.3 (46.9) |
4.4 (39.9) |
11.4 (52.5) |
| Record low °C (°F) | −19 (−2) |
−18 (0) |
−6.4 (20.5) |
−2 (28) |
3.6 (38.5) |
5 (41) |
11 (52) |
9 (48) |
7 (45) |
1 (34) |
−4 (25) |
−10 (14) |
−19 (−2) |
| Average precipitation mm (inches) | 132.4 (5.21) |
116.0 (4.57) |
112.5 (4.43) |
64.8 (2.55) |
51.5 (2.03) |
43.0 (1.69) |
42.3 (1.67) |
68.4 (2.69) |
152.5 (6.00) |
211.5 (8.33) |
186.8 (7.35) |
155.8 (6.13) |
1,337.5 (52.65) |
| Average precipitation days | 13.4 | 12.9 | 15.4 | 12.3 | 10.9 | 7.3 | 6.3 | 8.6 | 12.0 | 13.8 | 12.8 | 13.0 | 138.7 |
| Average snowy days | 2.5 | 2.8 | 1.3 | 0.1 | 0.0 | 0.0 | 0.0 | 0.0 | 0.0 | 0.0 | 0.1 | 0.9 | 7.7 |
| Average relative humidity (%)
|
84 | 85 | 84 | 80 | 78 | 74 | 74 | 77 | 82 | 86 | 85 | 85 | 81 |
| Mean monthly sunshine hours | 91.7 | 86.7 | 91.2 | 122.0 | 174.0 | 213.2 | 222.1 | 187.7 | 140.2 | 118.3 | 100.2 | 89.6 | 1,636.9 |
| Source 1: World Climate[57] | |||||||||||||
| Source 2: Shahrekord Meteorology Database[58] | |||||||||||||
| Climate data for Saqqez, Iran | |||||||||||||
|---|---|---|---|---|---|---|---|---|---|---|---|---|---|
| Month | Jan | Feb | Mar | Apr | May | Jun | Jul | Aug | Sep | Oct | Nov | Dec | Year |
| Record high °C (°F) | 18.2 (64.8) |
20 (68) |
24 (75) |
29 (84) |
34.4 (93.9) |
39 (102) |
43 (109) |
42 (108) |
39 (102) |
32 (90) |
26 (79) |
22.2 (72.0) |
43 (109) |
| Mean daily maximum °C (°F) | 2.4 (36.3) |
4.7 (40.5) |
11.0 (51.8) |
17.3 (63.1) |
23.1 (73.6) |
29.8 (85.6) |
34.3 (93.7) |
34.2 (93.6) |
29.8 (85.6) |
22.2 (72.0) |
13.4 (56.1) |
6.1 (43.0) |
19.03 (66.25) |
| Mean daily minimum °C (°F) | −8.1 (17.4) |
−6.7 (19.9) |
−1.2 (29.8) |
3.6 (38.5) |
6.6 (43.9) |
9.5 (49.1) |
14.0 (57.2) |
13.4 (56.1) |
8.3 (46.9) |
4.4 (39.9) |
−0.3 (31.5) |
−4.6 (23.7) |
3.24 (37.83) |
| Record low °C (°F) | −32 (−26) |
−36 (−33) |
−27.6 (−17.7) |
−9 (16) |
−5 (23) |
−0.6 (30.9) |
3.8 (38.8) |
4.8 (40.6) |
−0.4 (31.3) |
−7 (19) |
−24 (−11) |
−32 (−26) |
−36 (−33) |
| Average precipitation mm (inches) | 66.6 (2.62) |
58.7 (2.31) |
79.5 (3.13) |
83.6 (3.29) |
52.0 (2.05) |
5.8 (0.23) |
2.9 (0.11) |
2.5 (0.10) |
1.4 (0.06) |
27.8 (1.09) |
56.9 (2.24) |
61.7 (2.43) |
499.4 (19.66) |
| Average precipitation days (≥ 1.0 mm) | 8.5 | 8.3 | 10.0 | 9.8 | 7.0 | 1.2 | 0.7 | 0.6 | 0.5 | 4.3 | 6.2 | 8.1 | 65.2 |
| Average relative humidity (%)
|
73 | 70 | 64 | 58 | 52 | 40 | 35 | 33 | 33 | 47 | 63 | 71 | 53 |
| Mean monthly sunshine hours | 121.5 | 142.2 | 177.4 | 213.1 | 287.1 | 345.1 | 357.4 | 344.3 | 311.1 | 254.3 | 174.1 | 123.4 | 2,851 |
| Source: Synoptic Stations Statistics | |||||||||||||
| Climate data for Hamedan
| |||||||||||||
|---|---|---|---|---|---|---|---|---|---|---|---|---|---|
| Month | Jan | Feb | Mar | Apr | May | Jun | Jul | Aug | Sep | Oct | Nov | Dec | Year |
| Record high °C (°F) | 17.0 (62.6) |
19.0 (66.2) |
25.0 (77.0) |
28.0 (82.4) |
33.0 (91.4) |
39.0 (102.2) |
40.6 (105.1) |
39.4 (102.9) |
36.4 (97.5) |
30.0 (86.0) |
23.0 (73.4) |
18.8 (65.8) |
40.6 (105.1) |
| Mean daily maximum °C (°F) | 2.0 (35.6) |
4.3 (39.7) |
11.5 (52.7) |
18.1 (64.6) |
23.9 (75.0) |
30.9 (87.6) |
34.9 (94.8) |
34.2 (93.6) |
29.8 (85.6) |
21.9 (71.4) |
13.7 (56.7) |
5.9 (42.6) |
19.3 (66.7) |
| Daily mean °C (°F) | −4.6 (23.7) |
−2.2 (28.0) |
4.5 (40.1) |
10.4 (50.7) |
15.5 (59.9) |
21.3 (70.3) |
25.3 (77.5) |
24.3 (75.7) |
19.0 (66.2) |
12.1 (53.8) |
5.3 (41.5) |
−0.9 (30.4) |
10.8 (51.5) |
| Mean daily minimum °C (°F) | −10.5 (13.1) |
−8.2 (17.2) |
−2.1 (28.2) |
2.7 (36.9) |
6.4 (43.5) |
9.8 (49.6) |
13.9 (57.0) |
12.8 (55.0) |
7.0 (44.6) |
2.5 (36.5) |
−2.1 (28.2) |
−6.6 (20.1) |
2.1 (35.8) |
| Record low °C (°F) | −34 (−29) |
−33.0 (−27.4) |
−21 (−6) |
−12.0 (10.4) |
−3.0 (26.6) |
2.0 (35.6) |
7.0 (44.6) |
4.0 (39.2) |
−4.0 (24.8) |
−7.0 (19.4) |
−14.5 (5.9) |
−29 (−20) |
−34 (−29) |
| Average precipitation mm (inches) | 46.3 (1.82) |
43.6 (1.72) |
49.4 (1.94) |
49.8 (1.96) |
37.8 (1.49) |
3.7 (0.15) |
2.0 (0.08) |
1.8 (0.07) |
0.8 (0.03) |
20.7 (0.81) |
26.9 (1.06) |
40.9 (1.61) |
323.7 (12.74) |
| Average rainy days | 11.6 | 11.1 | 12.4 | 12.1 | 9.5 | 2.0 | 1.3 | 1.6 | 1.0 | 5.6 | 6.8 | 10.1 | 85.1 |
| Average snowy days | 8.8 | 8.2 | 4.2 | 0.6 | 0 | 0 | 0 | 0 | 0 | 0.2 | 0.9 | 6.9 | 29.8 |
| Average relative humidity (%)
|
76 | 73 | 64 | 56 | 50 | 36 | 31 | 31 | 34 | 48 | 61 | 73 | 53 |
| Mean monthly sunshine hours | 131.8 | 137.1 | 174.5 | 199.6 | 258.5 | 341.8 | 342.7 | 322.2 | 295.6 | 234.3 | 183.1 | 135.3 | 2,756.5 |
| Source: NOAA (1961-1990)[59] | |||||||||||||
| Climate data for Yazd (1951-2010, records and temperature normals 1951-2020) | |||||||||||||
|---|---|---|---|---|---|---|---|---|---|---|---|---|---|
| Month | Jan | Feb | Mar | Apr | May | Jun | Jul | Aug | Sep | Oct | Nov | Dec | Year |
| Record high °C (°F) | 27.0 (80.6) |
29.4 (84.9) |
35.2 (95.4) |
38.0 (100.4) |
41.0 (105.8) |
44.1 (111.4) |
45.6 (114.1) |
45.6 (114.1) |
42.0 (107.6) |
36.4 (97.5) |
30.8 (87.4) |
28.5 (83.3) |
45.6 (114.1) |
| Mean daily maximum °C (°F) | 12.7 (54.9) |
16.0 (60.8) |
21.0 (69.8) |
26.9 (80.4) |
32.5 (90.5) |
38.1 (100.6) |
39.6 (103.3) |
38.0 (100.4) |
34.5 (94.1) |
27.8 (82.0) |
19.9 (67.8) |
14.5 (58.1) |
26.8 (80.2) |
| Daily mean °C (°F) | 6.4 (43.5) |
9.3 (48.7) |
14.2 (57.6) |
19.9 (67.8) |
25.3 (77.5) |
30.5 (86.9) |
32.3 (90.1) |
30.2 (86.4) |
26.3 (79.3) |
19.9 (67.8) |
12.7 (54.9) |
7.8 (46.0) |
19.6 (67.2) |
| Mean daily minimum °C (°F) | -0 (32) |
2.6 (36.7) |
7.4 (45.3) |
12.9 (55.2) |
18.0 (64.4) |
22.8 (73.0) |
24.9 (76.8) |
22.3 (72.1) |
18.1 (64.6) |
12.0 (53.6) |
5.5 (41.9) |
1.1 (34.0) |
12.3 (54.1) |
| Record low °C (°F) | −14 (7) |
−10.1 (13.8) |
−7 (19) |
0.0 (32.0) |
2.0 (35.6) |
11.0 (51.8) |
16.0 (60.8) |
12.0 (53.6) |
2.0 (35.6) |
−3 (27) |
−10 (14) |
−16 (3) |
−16 (3) |
| Average precipitation mm (inches) | 12.2 (0.48) |
7.6 (0.30) |
12.5 (0.49) |
7.3 (0.29) |
3.6 (0.14) |
0.3 (0.01) |
0.2 (0.01) |
0.1 (0.00) |
0.1 (0.00) |
1.2 (0.05) |
4.1 (0.16) |
10.0 (0.39) |
59.2 (2.32) |
| Average precipitation days | 4.8 | 3.5 | 4.8 | 4.3 | 2.2 | 0.3 | 0.2 | 0.1 | 0.1 | 0.8 | 2.2 | 3.7 | 27 |
| Average snowy days | 2.1 | 0.8 | 0.2 | 0.0 | 0.0 | 0.0 | 0.0 | 0.0 | 0.0 | 0.0 | 0.1 | 0.8 | 4 |
| Average relative humidity (%)
|
54 | 44 | 37 | 32 | 25 | 18 | 17 | 17 | 19 | 27 | 38 | 50 | 32 |
| Mean monthly sunshine hours | 194.1 | 210.3 | 225.4 | 246.2 | 302.7 | 343.1 | 347.2 | 346.1 | 316.4 | 286.9 | 226.2 | 200.3 | 3,244.9 |
| Source 1: [1] | |||||||||||||
| Source 2: IRIMO (extremes, sun, humidity, 1952–2010)[60] | |||||||||||||
| Climate data for Ardabil | |||||||||||||
|---|---|---|---|---|---|---|---|---|---|---|---|---|---|
| Month | Jan | Feb | Mar | Apr | May | Jun | Jul | Aug | Sep | Oct | Nov | Dec | Year |
| Record high °C (°F) | 18.2 (64.8) |
20.0 (68.0) |
27.2 (81.0) |
32.0 (89.6) |
33.0 (91.4) |
37.5 (99.5) |
38.0 (100.4) |
39.8 (103.6) |
37.4 (99.3) |
30.8 (87.4) |
25.0 (77.0) |
21.2 (70.2) |
39.8 (103.6) |
| Mean daily maximum °C (°F) | 3.0 (37.4) |
4.5 (40.1) |
9.3 (48.7) |
16.7 (62.1) |
19.7 (67.5) |
23.2 (73.8) |
25.0 (77.0) |
24.7 (76.5) |
22.6 (72.7) |
17.5 (63.5) |
11.4 (52.5) |
5.7 (42.3) |
15.3 (59.5) |
| Mean daily minimum °C (°F) | −7.9 (17.8) |
−6.3 (20.7) |
−2.4 (27.7) |
2.8 (37.0) |
6.0 (42.8) |
9.0 (48.2) |
11.6 (52.9) |
11.6 (52.9) |
8.7 (47.7) |
4.8 (40.6) |
0.3 (32.5) |
−4.6 (23.7) |
2.8 (37.0) |
| Record low °C (°F) | −31.4 (−24.5) |
−33.8 (−28.8) |
−28.8 (−19.8) |
−13.0 (8.6) |
−8.5 (16.7) |
−0.2 (31.6) |
3.0 (37.4) |
2.2 (36.0) |
−4.4 (24.1) |
−21.0 (−5.8) |
−24.2 (−11.6) |
−27.0 (−16.6) |
−33.8 (−28.8) |
| Average precipitation mm (inches) | 25.3 (1.00) |
24.1 (0.95) |
40.1 (1.58) |
47.0 (1.85) |
42.6 (1.68) |
18.9 (0.74) |
5.9 (0.23) |
5.5 (0.22) |
10.4 (0.41) |
31.8 (1.25) |
34.5 (1.36) |
29.4 (1.16) |
315.5 (12.43) |
| Average rainy days | 8.2 | 8.9 | 11.3 | 14.2 | 15.7 | 7.2 | 3.9 | 4.1 | 6.4 | 9.2 | 7.7 | 7.9 | 104.7 |
| Average snowy days | 7.6 | 7.7 | 7.1 | 2.1 | 0.3 | 0.0 | 0.0 | 0.0 | 0.0 | 0.9 | 3.5 | 6.3 | 35.5 |
| Average relative humidity (%)
|
75 | 74 | 73 | 68 | 71 | 71 | 69 | 70 | 74 | 75 | 74 | 74 | 72 |
| Mean monthly sunshine hours | 146.2 | 153.7 | 170.4 | 184.9 | 245.4 | 293.6 | 302.8 | 274.3 | 227.1 | 185.6 | 153.4 | 141.0 | 2,478.4 |
| Source: [61] | |||||||||||||
| Climate data for Bandar Abbas (1961-1990) | |||||||||||||
|---|---|---|---|---|---|---|---|---|---|---|---|---|---|
| Month | Jan | Feb | Mar | Apr | May | Jun | Jul | Aug | Sep | Oct | Nov | Dec | Year |
| Record high °C (°F) | 32.0 (89.6) |
33.0 (91.4) |
39.0 (102.2) |
42.0 (107.6) |
47.0 (116.6) |
51.0 (123.8) |
48.0 (118.4) |
46.0 (114.8) |
45.0 (113.0) |
42.0 (107.6) |
38.0 (100.4) |
32.0 (89.6) |
51.0 (123.8) |
| Mean daily maximum °C (°F) | 23.5 (74.3) |
24.4 (75.9) |
27.7 (81.9) |
31.6 (88.9) |
36.3 (97.3) |
38.4 (101.1) |
38.2 (100.8) |
37.7 (99.9) |
36.8 (98.2) |
35.0 (95.0) |
30.4 (86.7) |
25.5 (77.9) |
32.13 (89.83) |
| Daily mean °C (°F) | 18.1 (64.6) |
19.4 (66.9) |
23.1 (73.6) |
26.8 (80.2) |
31.2 (88.2) |
33.7 (92.7) |
34.4 (93.9) |
34.0 (93.2) |
32.5 (90.5) |
29.6 (85.3) |
24.3 (75.7) |
19.7 (67.5) |
27.2 (81.0) |
| Mean daily minimum °C (°F) | 12.1 (53.8) |
14.0 (57.2) |
17.5 (63.5) |
20.9 (69.6) |
24.7 (76.5) |
28.0 (82.4) |
30.3 (86.5) |
30.1 (86.2) |
27.7 (81.9) |
23.5 (74.3) |
18.0 (64.4) |
13.5 (56.3) |
21.69 (71.04) |
| Record low °C (°F) | 2.3 (36.1) |
5.4 (41.7) |
7.6 (45.7) |
11.5 (52.7) |
17.0 (62.6) |
20.0 (68.0) |
25.2 (77.4) |
25.0 (77.0) |
21.0 (69.8) |
12.0 (53.6) |
6.0 (42.8) |
2.0 (35.6) |
2.0 (35.6) |
| Average precipitation mm (inches) | 39.7 (1.56) |
47.5 (1.87) |
34.8 (1.37) |
10.7 (0.42) |
4.8 (0.19) |
0.0 (0.0) |
0.6 (0.02) |
2.2 (0.09) |
0.8 (0.03) |
1.3 (0.05) |
5.0 (0.20) |
24.0 (0.94) |
171.4 (6.74) |
| Average precipitation days (≥ 1.0 mm) | 3.3 | 3.1 | 2.6 | 1.3 | 0.2 | 0.0 | 0.1 | 0.2 | 0.1 | 0.1 | 0.4 | 2.3 | 13.7 |
| Average relative humidity (%)
|
64 | 68 | 67 | 64 | 61 | 64 | 68 | 69 | 67 | 64 | 61 | 63 | 65 |
| Mean monthly sunshine hours | 220.1 | 211.9 | 232.5 | 242.4 | 312.7 | 302.2 | 264.6 | 270.1 | 270.1 | 283.4 | 251.2 | 228.8 | 3,090 |
| Source: NOAA (1961–1990)[62][63] | |||||||||||||
| Climate data for Arak | |||||||||||||
|---|---|---|---|---|---|---|---|---|---|---|---|---|---|
| Month | Jan | Feb | Mar | Apr | May | Jun | Jul | Aug | Sep | Oct | Nov | Dec | Year |
| Record high °C (°F) | 17.0 (62.6) |
21.0 (69.8) |
25.2 (77.4) |
29.0 (84.2) |
35.0 (95.0) |
41.0 (105.8) |
44.0 (111.2) |
41.0 (105.8) |
38.0 (100.4) |
31.0 (87.8) |
24.0 (75.2) |
20.0 (68.0) |
44.0 (111.2) |
| Mean daily maximum °C (°F) | 4.2 (39.6) |
7.3 (45.1) |
13.7 (56.7) |
19.7 (67.5) |
25.6 (78.1) |
32.5 (90.5) |
35.7 (96.3) |
34.9 (94.8) |
30.7 (87.3) |
23.2 (73.8) |
14.5 (58.1) |
7.7 (45.9) |
20.8 (69.5) |
| Daily mean °C (°F) | −0.8 (30.6) |
1.9 (35.4) |
7.8 (46.0) |
13.4 (56.1) |
18.2 (64.8) |
24.0 (75.2) |
27.3 (81.1) |
26.4 (79.5) |
21.9 (71.4) |
15.6 (60.1) |
8.4 (47.1) |
2.8 (37.0) |
13.9 (57.0) |
| Mean daily minimum °C (°F) | −5.7 (21.7) |
−3.4 (25.9) |
2.0 (35.6) |
7.0 (44.6) |
10.9 (51.6) |
15.5 (59.9) |
19.0 (66.2) |
17.9 (64.2) |
13.1 (55.6) |
7.9 (46.2) |
2.4 (36.3) |
−2.1 (28.2) |
7.0 (44.7) |
| Record low °C (°F) | −29.6 (−21.3) |
−30.5 (−22.9) |
−22 (−8) |
−7.0 (19.4) |
0.0 (32.0) |
4.0 (39.2) |
12.0 (53.6) |
10.0 (50.0) |
2.0 (35.6) |
−4.0 (24.8) |
−17 (1) |
−23 (−9) |
−30.5 (−22.9) |
| Average precipitation mm (inches) | 51.6 (2.03) |
43.3 (1.70) |
57.1 (2.25) |
53.6 (2.11) |
30.0 (1.18) |
2.8 (0.11) |
1.2 (0.05) |
1.6 (0.06) |
0.9 (0.04) |
16.9 (0.67) |
33.7 (1.33) |
44.4 (1.75) |
337.1 (13.28) |
| Average rainy days | 10.8 | 9.8 | 11.4 | 9.4 | 7.1 | 1.1 | 0.9 | 0.6 | 0.6 | 4.3 | 6.1 | 8.9 | 71 |
| Average snowy days | 7.6 | 6.4 | 3.2 | 0.5 | 0 | 0 | 0 | 0 | 0 | 0.1 | 0.7 | 4.6 | 23.1 |
| Average relative humidity (%)
|
72 | 66 | 54 | 48 | 41 | 29 | 28 | 27 | 28 | 41 | 57 | 68 | 47 |
| Mean monthly sunshine hours | 152.0 | 170.9 | 206.2 | 225.7 | 288.3 | 345.0 | 334.8 | 330.9 | 305.1 | 259.3 | 185.9 | 154.3 | 2,958.4 |
| Source: NOAA (1961-1990) [64] | |||||||||||||
Flora and fauna

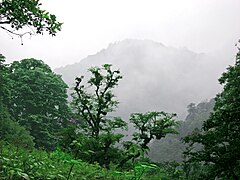
7% of the country is forested. The most extensive growths are found on the mountain slopes rising from the Caspian Sea, with stands of
- forests of the northern districts– 19,000 km2 (7,300 sq mi)
- Juniperusforests) – 13,000 km2 (5,000 sq mi)
- Pistachio forests in the eastern, southern and southeastern districts – 26,000 km2 (10,000 sq mi)
- Oak forests in the central and western districts – 35,000 km2 (14,000 sq mi)
- Shrubs of the Kavir (desert) districts in the central and northeastern part of the country – 10,000 km2 (3,900 sq mi)
- Hara forests– 5,000 km2 (1,900 sq mi)
Wildlife of Iran is diverse and composed of several animal species including bears, gazelles, wild pigs, wolves, jackals, panthers, Eurasian lynx, and foxes. Domestic animals include, sheep, goats, cattle, horses, water buffalo, donkeys, and camels. The pheasant, partridge, stork, eagles and falcon are also native to Iran.
As of 2001, 20 of Iran's
Iran lost all its
are native to Iran.The Persian leopard is said to be the largest of all the subspecies of leopards in the world. The main range of this species in Iran closely overlaps with that of
Ecosystem and biosphere
Iran's
| Ramsar sites (23/06/75) | Area (km2) |
|---|---|
Gilan Province |
150 |
Fars Province |
22 |
East Azerbaijan Province |
1.2 |
West Azerbaijan Province |
12 |
Fars Province |
40 |
Mazandaran Province |
1000 |
Environmental concerns
Natural hazards: periodic droughts, floods; dust storms, sandstorms; earthquakes along western border and in the northeast
Environment – current issues: air pollution, especially in urban areas, from vehicle emissions, refinery operations, and industrial effluents;
Resources and land use

Natural resources:
petroleum, natural gas, coal, chromium, copper, iron ore, lead, manganese, zinc, sulfur
arable land:
10.87%
permanent crops:
1.19%
other:
87.93% (2012 est.)
Irrigated land: 87,000 km2 (34,000 sq mi) (2009)
Total renewable water resources: 137 km3 (2011)
Freshwater withdrawal (domestic/industrial/agricultural):
total: 93.3 km3/yr (7%/1%/92%)
per capita: 1,306 m3/yr (2004)
Area and boundaries

- Area
-
- total: 1,648,195 km2 (636,372 sq mi)[73]
- country rank in the world: 17th
- land: 1,531,595 km2 (591,352 sq mi)
- water: 116,600 km2 (45,000 sq mi)
- total: 1,648,195 km2 (636,372 sq mi)[73]
- Area — comparative
-
- Australia comparative: slightly smaller than Queensland
- Canada comparative: slightly larger than Quebec
- United States comparative: slightly larger than Alaska
- EU comparative: slightly more than three times the size of Metropolitan France
- Land boundaries
-
- total:
- 5,894 kilometres (3,662 mi)
- border countries: Afghanistan 921 kilometres (572 mi), Armenia 44 kilometres (27 mi), Azerbaijan-proper 432 kilometres (268 mi), Azerbaijan-Nakhchivan exclave 179 kilometres (111 mi), Iraq 1,599 kilometres (994 mi), Pakistan 909 kilometres (565 mi), Turkey 534 kilometres (332 mi), Turkmenistan 1,148 kilometres (713 mi).
- total:
- Maritime boundaries
-
- , Oman
- Coastline
-
- 2,815 kilometres (1,749 mi)
- note: Iran also borders the Caspian Sea, for 740 kilometres (460 mi)
- 2,815 kilometres (1,749 mi)
- Maritime claims
-
- territorial sea: 12 nmi (22.2 km; 13.8 mi)
- contiguous zone: 24 nmi (44.4 km; 27.6 mi)
- exclusive economic zone: 168,718 km2 (65,142 sq mi) with bilateral agreements, or median lines in the Persian Gulf
- continental shelf: natural prolongation
- Elevation extremes
-
- lowest point: Caspian Sea −28 metres (−92 ft)
- highest point: Mount Damavand 5,610 metres (18,410 ft)
International territorial disputes
Iran is currently engaged in international territorial disputes with several neighbouring countries.
The country protests Afghanistan's limiting flow of dammed tributaries to the Helmand River in periods of drought. The lack of a maritime boundary in the Persian Gulf with Iraq also prompts jurisdictional disputes beyond the mouth of the Arvand Rud. Iran and the United Arab Emirates have a territorial dispute over the Greater and Lesser Tunbs and Abu Musa islands, which are administered by Iran. Iran currently insists on dividing the Caspian Sea resources equally among the five littoral states, after the Russian-backed former soviet breakaway republics refused to respect the 50-50 agreements between Iran and the Soviet Union (despite their international obligation). Russia, Azerbaijan, Kazakhstan and Turkmenistan continue to claim territorial waters thus regarding the Caspian Sea as open international body of water, dismissing its geographically lake nature.[74]
- Photo gallery
-
 Southern Alborz range near Firouzkuh
 -
 Maranjab dunes, Kavir desert, Kashan
 -
 Aerial view ofMazandaran
 -
 Mazandaran
 -
 Gilan
Gilan -
 Khajoo Bridge over it in Isfahan
 -
 Zagros Mountains in Ilam province
 -
 Sunset in Ab-Pakhsh (Bushehr province)


_4.jpg)


See also
- Armenian Highlands
- Caspian Hyrcanian mixed forests
- Caspian Sea
- Elburz Range forest steppe
- International rankings of Iran
- List of castles in Iran
- List of caves in Iran
- List of earthquakes in Iran
- List of Iranian four-thousanders
- Provinces of Iran
- Ramsar, Mazandaran: Highest natural radioactivity in the world
- Strait of Hormuz
Notes
- ^ Including the de facto independent, but unrecognized Republic of Artsakh.
References
- ^ "Iran Country Profile". BBC News. Archived from the original on 25 November 2014. Retrieved 26 November 2014.
- ^ ""CESWW" – Definition of Central Eurasia". Cesww.fas.harvard.edu. Archived from the original on 5 August 2010. Retrieved 26 November 2014.
- ^ "Iran Guide". National Geographic. 14 June 2013. Archived from the original on 12 December 2009. Retrieved 26 November 2014.
- ^ "Armenian Highland". Archived from the original on 3 May 2015. Retrieved 28 February 2015.
- ^ "Glaciers of Iran – in pictures". The Guardian. 16 December 2014.
- S2CID 56481043.
- ^ *"Highest record temperature in Tehran by Month 1951–2010". Iran Meteorological Organization. Retrieved 11 March 2018.[permanent dead link]
- "Lowest record temperature in Tehran by Month 1951–2010". Iran Meteorological Organization. Archived from the original on 5 February 2020. Retrieved 5 February 2020.
- ^ *"Average Maximum temperature in Tehran by Month 1951–2010". Iran Meteorological Organization. Retrieved 6 September 2014.[permanent dead link]
- "Average Mean Daily temperature in Tehran by Month 1951–2010". Iran Meteorological Organization. Archived from the original on 5 February 2020. Retrieved 5 February 2020.
- "Average Minimum temperature in Tehran by Month 1951–2010". Iran Meteorological Organization. Retrieved 20 March 2016.[permanent dead link]
- ^ "Monthly Total Precipitation in Tehran by Month 1951–2010". Iran Meteorological Organization. Archived from the original on 11 August 2020. Retrieved 22 October 2022.
- ^ "Average relative humidity in Tehran by Month 1951–2010". Iran Meteorological Organization.[permanent dead link]
- ^ "No. Of days with precipitation in Tehran by Month 1951–2010". Iran Meteorological Organization.[permanent dead link]
- ^ "No. Of days with snow in Tehran by Month 1951–2010". Iran Meteorological Organization.[permanent dead link]
- ^ "Monthly total sunshine hours in Tehran by Month 1951–2010". Iran Meteorological Organization.[permanent dead link]
- ^ "Tehran, Iran - Detailed climate information and monthly weather forecast".
- ^ I.R. OF IRAN SHAHREKORD METEOROLOGICAL ORGANIZATION (IN PERSIAN) Archived 2017-08-29 at the Wayback Machine. 1988–2010
- ^ *"Highest record temperature in Mashhad by Month 1951–2010". Iran Meteorological Organization. Archived from the original on 4 February 2019. Retrieved 8 April 2015.
- "Lowest record temperature in Mashhad by Month 1951–2010". Iran Meteorological Organization. Archived from the original on 4 February 2019. Retrieved 8 April 2015.
- ^ *"Average Maximum temperature in Mashhad by Month 1951–2010". Iran Meteorological Organization. Archived from the original on 8 March 2016. Retrieved 8 April 2015.
- "Average Mean Daily temperature in Mashhad by Month 1951–2010". Iran Meteorological Organization. Archived from the original on 18 October 2018. Retrieved 8 April 2015.
- "Average Minimum temperature in Mashhad by Month 1951–2010". Iran Meteorological Organization. Archived from the original on 8 March 2016. Retrieved 8 April 2015.
- ^ "Monthly Total Precipitation in Mashhad by Month 1951–2010". Iran Meteorological Organization. Archived from the original on 15 September 2018. Retrieved 8 April 2015.
- ^ "Average relative humidity in Mashhad by Month 1951–2010". Iran Meteorological Organization. Archived from the original on 8 March 2016. Retrieved 8 April 2015.
- ^ "No. Of days with precipitation equal to or greater than 1 mm in Mashhad by Month 1951–2010". Iran Meteorological Organization. Archived from the original on 8 March 2016. Retrieved 8 April 2015.
- ^ "No. Of days with snow in Mashhad by Month 1951–2010". Iran Meteorological Organization. Archived from the original on 8 March 2016. Retrieved 8 April 2015.
- ^ "Monthly total sunshine hours in Mashhad by Month 1951–2010". Iran Meteorological Organization. Archived from the original on 8 March 2016. Retrieved 8 April 2015.
- ^ "Esfahan Climate Normals 1961-1990". National Oceanic and Atmospheric Administration. Retrieved 8 April 2015.[dead link]
- ^ "Highest record temperature in Esfahan by Month 1951–2010". Iran Meteorological Organization. Archived from the original on 25 October 2016. Retrieved 8 April 2015.
- ^ "Lowest record temperature in Esfahan by Month 1951–2010". Iran Meteorological Organization. Archived from the original on 4 March 2016. Retrieved 8 April 2015.
- ^
- "Highest record temperature in Karaj by Month 1985–2010". Iran Meteorological Organization. Archived from the original on April 14, 2015. Retrieved April 7, 2015.
- "Lowest record temperature in Karaj by Month 1985–2010". Iran Meteorological Organization. Archived from the original on April 14, 2015. Retrieved April 7, 2015.
- ^
- "Average Maximum temperature in Karaj by Month 1985–2010". Iran Meteorological Organization. Archived from the original on April 14, 2015. Retrieved April 7, 2015.
- "Average Mean Daily temperature in Karaj by Month 1985–2010". Iran Meteorological Organization. Archived from the original on April 14, 2015. Retrieved April 7, 2015.
- "Average Minimum temperature in Karaj by Month 1985–2010". Iran Meteorological Organization. Archived from the original on April 14, 2015. Retrieved April 7, 2015.
- ^
- "Monthly Total Precipitation in Karaj by Month 1985–2010". Iran Meteorological Organization. Archived from the original on March 30, 2015. Retrieved April 7, 2015.
- ^
- "Average relative humidity in Karaj by Month 1985–2010". Iran Meteorological Organization. Archived from the original on April 14, 2015. Retrieved April 7, 2015.
- ^
- "No. Of days with precipitation equal to or greater than 1 mm in Karaj by Month 1985–2010". Iran Meteorological Organization. Archived from the original on April 14, 2015. Retrieved April 7, 2015.
- "No. of days with snow or sleet in Karaj by Month 1985–2010". Iran Meteorological Organization. Archived from the original on April 14, 2015. Retrieved April 7, 2015.
- ^
- "Monthly total sunshine hours in Karaj by Month 1985–2010". Iran Meteorological Organization. Archived from the original on April 14, 2015. Retrieved April 7, 2015.
- ^ "Shiraz Climate Normals 1961-1990". National Oceanic and Atmospheric Administration. Retrieved 7 April 2015.
- ^ "Highest record temperature in Shiraz by Month 1951–2010". Iran Meteorological Organization. Archived from the original on 14 April 2015. Retrieved 7 April 2015.
- ^ "Lowest record temperature in Shiraz by Month 1951–2010". Iran Meteorological Organization. Archived from the original on 14 April 2015. Retrieved 7 April 2015.
- ^ *"Highest record temperature in Tabriz by Month 1951–2010". Iran Meteorological Organization. Archived from the original on 28 February 2018. Retrieved 8 April 2015.
- "Lowest record temperature in Tabriz by Month 1951–2010". Iran Meteorological Organization. Archived from the original on 18 October 2018. Retrieved 8 April 2015.
- ^ *"Average Maximum temperature in Tabriz by Month 1951–2010". Iran Meteorological Organization. Archived from the original on 7 March 2016. Retrieved 8 April 2015.
- "Average Mean Daily temperature in Tabriz by Month 1951–2010". Iran Meteorological Organization. Archived from the original on 5 February 2020. Retrieved 8 April 2015.
- "Average Minimum temperature in Tabriz by Month 1951–2010". Iran Meteorological Organization. Archived from the original on 8 March 2016. Retrieved 8 April 2015.
- ^ "Monthly Total Precipitation in Tabriz by Month 1951–2010". Iran Meteorological Organization. Archived from the original on 11 September 2019. Retrieved 8 April 2015.
- ^ "Average relative humidity in Tabriz by Month 1951–2010". Iran Meteorological Organization. Archived from the original on 7 March 2016. Retrieved 8 April 2015.
- ^ "No. Of days with precipitation equal to or greater than 1 mm in Tabriz by Month 1951–2010". Iran Meteorological Organization. Archived from the original on 8 March 2016. Retrieved 8 April 2015.
- ^ "No. Of days with snow in Tabriz by Month 1951–2010". Iran Meteorological Organization. Archived from the original on 7 March 2016. Retrieved 8 April 2015.
- ^ "Monthly total sunshine hours in Tabriz by Month 1951–2010". Iran Meteorological Organization. Archived from the original on 8 March 2016. Retrieved 8 April 2015.
- ^
- "Highest record temperature in Ghom by Month 1986–2010". Iran Meteorological Organization. Retrieved 8 April 2015.
- "Lowest record temperature in Ghom by Month 1986–2010". Iran Meteorological Organization. Retrieved 8 April 2015.
- ^ *"Average Maximum temperature in Ghom by Month 1986–2010". Iran Meteorological Organization. Archived from the original on 6 September 2014. Retrieved 8 April 2015.
- "Average Mean Daily temperature in Ghom by Month 1986–2010". Iran Meteorological Organization. Retrieved 8 April 2015.
- "Average Minimum temperature in Ghom by Month 1986–2010". Iran Meteorological Organization. Archived from the original on 6 September 2014. Retrieved 8 April 2015.
- ^ "Monthly Total Precipitation in Ghom by Month 1986–2010". Iran Meteorological Organization. Retrieved 8 April 2015.
- ^ "Average relative humidity in Ghom by Month 1986–2010". Iran Meteorological Organization. Archived from the original on 16 September 2014. Retrieved 8 April 2015.
- ^ *"No. of days with precipitation equal to or greater than 1 mm in Ghom by Month 1986–2010". Iran Meteorological Organization. Archived from the original on 22 August 2014. Retrieved 8 April 2015.
- "No. of days with snow or sleet in Ghom by Month 1986–2010". Iran Meteorological Organization. Archived from the original on 26 August 2014. Retrieved 8 April 2015.
- ^ "Monthly total sunshine hours in Ghom by Month 1986–2010". Iran Meteorological Organization. Archived from the original on 6 September 2014. Retrieved 8 April 2015.
- ^ *"Highest record temperature in Ahwaz by Month 1951–2010". Iran Meteorological Organization. Archived from the original on 18 April 2015. Retrieved 8 April 2015.
- "Lowest record temperature in Ahwaz by Month 1951–2010". Iran Meteorological Organization. Archived from the original on 17 April 2015. Retrieved 8 April 2015.
- ^ *"Average Maximum temperature in Ahwaz by Month 1951–2010". Iran Meteorological Organization. Archived from the original on 26 May 2016. Retrieved 8 April 2015.
{{cite web}}: CS1 maint: bot: original URL status unknown (link)- "Average Mean Daily temperature in Ahwaz by Month 1951–2010". Iran Meteorological Organization. Archived from the original on 17 April 2015. Retrieved 8 April 2015.
- "Average Minimum temperature in Ahwaz by Month 1951–2010". Iran Meteorological Organization. Archived from the original on 30 May 2016. Retrieved 8 April 2015.
{{cite web}}: CS1 maint: bot: original URL status unknown (link)
- ^ "Monthly Total Precipitation in Ahwaz by Month 1951–2010". Iran Meteorological Organization. Archived from the original on 9 January 2015. Retrieved 8 April 2015.
- ^
"Average relative humidity in Ahwaz by Month 1951–2010". Iran Meteorological Organization. Archived from the original on 26 May 2016. Retrieved 8 April 2015.
{{cite web}}: CS1 maint: bot: original URL status unknown (link) - ^
"No. Of days with precipitation equal to or greater than 1 mm in Ahwaz by Month 1951–2010". Iran Meteorological Organization. Archived from the original on 4 March 2016. Retrieved 8 April 2015.
{{cite web}}: CS1 maint: bot: original URL status unknown (link) - ^
"Monthly total sunshine hours in Ahwaz by Month 1951–2010". Iran Meteorological Organization. Archived from the original on 5 March 2016. Retrieved 8 April 2015.
{{cite web}}: CS1 maint: bot: original URL status unknown (link) - ^ "Kermanshah Climate Normals 1961-1990". National Oceanic and Atmospheric Administration. Retrieved 8 April 2015.
- ^ "Highest record temperature in Kermanshah by Month 1951–2010". Iran Meteorological Organization. Archived from the original on 5 October 2018. Retrieved 8 April 2015.
- ^ "Lowest record temperature in Kermanshah by Month 1951–2010". Iran Meteorological Organization. Archived from the original on 21 November 2018. Retrieved 8 April 2015.
- ^ Rasht, Iran: Climate, Global Warming, and Daylight Charts and Data Archived 9 March 2014 at the Wayback Machine. Retrieved on: June 16, 2013.
- ^ Climatological Norms of Iran synoptic stations Archived 18 May 2013 at the Wayback Machine. Retrieved on: September 12, 2011.
- ^ "Hamedan Nozheh Climate Normals 1961-1990". National Oceanic and Atmospheric Administration. Retrieved 28 December 2012.
- ^ "Yazd Climate Normals 1961–1990". National Oceanic and Atmospheric Administration. Retrieved 29 December 2012.
- ^ "آمار 166 ايستگاه سينوپتيك كشور تا پایان سال 2010 میلادی + 37 ایستگاه تا پایان سال 2005". Archived from the original on 17 February 2016. Retrieved 13 February 2016.
- ^ "Bandar Abbas 1961–1990". National Oceanic and Atmospheric Administration. Retrieved 29 December 2012.
- ^ "40875: Bandarabbass (Iran)". ogimet.com. OGIMET. 11 January 2021. Retrieved 11 January 2021.
- ^ "Arak Climate Normals 1961-1990". National Oceanic and Atmospheric Administration. Retrieved 28 December 2012.
- ^ "Unasylva – Vol. 8, No. 2 – The work of FAO". www.fao.org. Archived from the original on 9 September 2007.
- ^ 74 Iranian wildlife species red-listed by Environment Department Archived 20 May 2015 at the Wayback Machine. (28 February 2014) Radio Zamaneh via Payvand Iran News. Retrieved 4 April 2014
- ^ "Ramsar Information Sheet: Anzali Wetlands Complex" Archived 27 March 2009 at the Wayback Machine, accessed 28 November 2008
- ^ a b "Ramsar Information Sheet: Lake Lake Parishan and Dashte-Arjan" Archived 27 March 2009 at the Wayback Machine, accessed 1 December 2008
- ^ "Ramsar Information Sheet: Lake Gori" Archived 27 March 2009 at the Wayback Machine, accessed 1 December 2008
- ^ "Ramsar Information Sheet: Lake Kobi" Archived 27 March 2009 at the Wayback Machine, accessed 1 December 2008
- ^ "Ramsar Information Sheet: Miankaleh Peninsula, Gorgan Bay and Lapoo-Zaghmarz Ab-bandans" Archived 27 March 2009 at the Wayback Machine, accessed 28 November 2008
- ^ CSIS: The US, Israel, the Arab States and a Nuclear Iran Archived 6 August 2010 at the Wayback Machine. Retrieved 27 January 2010.
- ^ "Land area (sq. km) – Data". data.worldbank.org. Archived from the original on 29 October 2013.
- ^ CIA – The World Factbook – Iran
 This article incorporates text from this source, which is in the public domain. Iran: A Country Study. Federal Research Division.
- This article incorporates public domain material from The World Factbook. CIA.
External links
- Geography of Persia, Encyclopædia Iranica:
- Iran in Maps – BBC (population, land, infrastructure)
- Iran Geography
- Flora of Iran by Pr Ahmad GHAHREMAN Archived 3 December 2019 at the Wayback Machine
- Persia (Iran), Afghanistan and Baluchistan is a map from 1897