Great Compression
The Great Compression refers to the period of substantial

According to economists
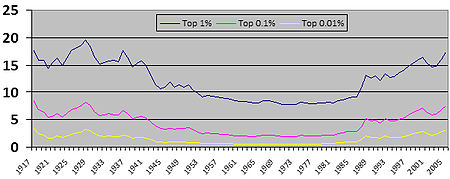
Economist Paul Krugman gives credit for the compression not only to progressive income taxation but to other New Deal and World War II policies of President Franklin D. Roosevelt. From about 1937 to 1947 highly progressive taxation, the strengthening of unions of the New Deal, and the wage and price controls of the National War Labor Board during World War II, raised the income of the poor and working class and lowered that of top earners. Krugman argues these explanations are more convincing than the conventional Kuznets curve cycle of inequality driven by market forces because a natural change would have been gradual and not sudden as the compression was.[6]
Explanations for the length of the compression have been attributed to the lack of immigrant labor in the US during that time (immigrants often not being able to vote and so support their political interests) and the strength of unions, exemplified by Reuther's Treaty of Detroit—a landmark 1949 business-labor bargain struck between the United Auto Workers union and General Motors. Under that agreement, UAW members were guaranteed wages that rose with productivity, as well as health and retirement benefits. In return GM had relatively few strikes, slowdowns, etc. Unions helped limit increases in executive pay. Further, members of Congress in both political parties significantly overlapped in their voting records and relatively more politicians advocated centrist positions with a general acceptance of New Deal policies.[7]
The end of income compression has been credited to "impersonal forces", such as technological change and globalization, but also to political and policy changes that affected institutions (e.g., unions) and norms (e.g., acceptable executive pay). Krugman argues that the rise of "movement conservatism"—a "highly cohesive set of interlocking institutions that brought Ronald Reagan and Newt Gingrich to power"—beginning in the late 1970s and early 1980s brought lower taxes on the rich and significant holes in the social safety net. The relative power of unions declined significantly along with union membership, and executive pay rose considerably relative to average worker pay.[8] The reversal of the great compression has been called "the Great Divergence" by Krugman and is the title of a Slate article and book by Timothy Noah.[9] Krugman also notes that era before the Great Divergence was one not only of relative equality but of economic growth far surpassing the "Great Divergence".[10]
See also
- Income inequality in the United States
- Economic history of the United States
- Great Divergence (inequality)
References
- ^ The Great Divergence. By Timothy Noah| slate.com
- ^ The Great Compression: The Wage Structure in the United States at Mid-century, Goldin & Margo, Quarterly Journal of Economics. Volume (Year): 107 (1992) Issue (Month): 1 (February). pp. 1–34
- ^ Saez, E. & Piketty, T. (2003). Income inequality in the United States: 1913–1998. Quarterly Journal of Economics, 118(1), 1–39.
- ^ "Saez, E. (October, 2007). Table A1: Top fractiles income shares (excluding capital gains) in the U.S., 1913–2005". Retrieved 2008-01-17.
- ^ Piketty and Saez. The evolution of top incomes: An international comparison.
- ^ Krugman, Paul, The Conscience of a Liberal, pp. 7–8, 47–52
- ^ Paul Krugman, The Conscience of a Liberal, pp. 134, 138
- ^ introducing this blog (see graph), Paul Krugman
- ^ The Great Divergence By Timothy Noah
- ^
- 2.7%/average annual growth of real income of typical family for the postwar boom, from 1947 to 1973; compared to
- 0.7%/annual income growth for the modern era of reasonable growth with rising inequality, from 1980 until the present. (The era of stagflation from 1973-1980 had no growth). Paul Krugman, The Conscience of a Liberal, pp. 54–55)
Further reading
- political power; spending on politics soared." (p. 22.) "[N]o democracy can function well if people are unwilling to lose power – if a generation of leaders... becomes so entrenched that it ages into gerontocracy; if one of two major parties denies the arithmetic of elections; if a cohort of the ruling class loses status that it once enjoyed and sets out to salvage it." (p. 23.)
