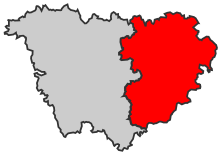
Haute-Loire's 1st constituency
| 1st constituency of Constituency of the National Assembly of France | |
|---|---|
 Constituency in Department | |
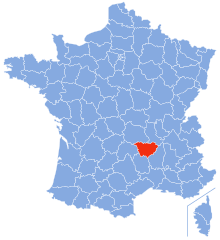
 Location of Haute-Loire in France | |
| Deputy | |
| Department | Haute-Loire |
The 1st constituency of Haute-Loire is a French legislative
constituency in Haute-Loire
.
Historic representation
| Election | Member | Party | Notes | |
|---|---|---|---|---|
| 1988 | Jacques Barrot | UDF | ||
| 1993 | ||||
| 1995 | Serge Monnier | |||
| 1997 | Jacques Barrot | |||
| 2002 | UMP | |||
| 2004 | Laurent Wauquiez | |||
| 2007 | ||||
| 2007 | Jean-Pierre Marcon | Substitute for Laurent Wauquiez , replaced him when Wauquiez
was appointed Government spokesperson
| ||
| 2012 | Laurent Wauquiez | |||
| 2017 | Isabelle Valentin | LR | ||
| 2022 | ||||
Election results
2022
| Party | Candidate | Votes | % | ±% | |||
|---|---|---|---|---|---|---|---|
| LR (UDC) | Isabelle Valentin | 23,714 | 45.26 | +4.37 | |||
NUPÉS )
|
Celline Gacon | 9,933 | 18.96 | +4.63 | |||
Ensemble )
|
Cécile Gallien | 7,459 | 14.24 | -16.83 | |||
| RN | Suzanne Fourets | 7,458 | 14.23 | +4.82 | |||
| REC | Emmanuelle Poumeau De Lafforest | 1,368 | 2.61 | N/A | |||
ECO
|
Dominique Samard | 1,283 | 2.45 | N/A | |||
| Others | N/A | 1,380 | - | - | |||
| Turnout | 52,395 | 52.45 | -2.52 | ||||
| 2nd round result | |||||||
| LR (UDC) | Isabelle Valentin | 32,478 | 70.22 | +11.50 | |||
NUPÉS )
|
Celline Gacon | 13,773 | 29.78 | N/A | |||
| Turnout | 46,251 | 47.99 | -2.77 | ||||
| LR hold | |||||||
2017
| Candidate | Label | First round | Second round | |||
|---|---|---|---|---|---|---|
| Votes | % | Votes | % | |||
| Isabelle Valentin | LR | 21,615 | 40.89 | 26,705 | 58.72 | |
| Cécile Gallien | REM
|
16,423 | 31.07 | 18,772 | 41.28 | |
| Fabien Albertini | FN
|
4,974 | 9.41 | |||
| Martine Dejean | FI | 4,721 | 8.93 | |||
| Fabrice Farison | PS | 1,453 | 2.75 | |||
| Anne Badian-Lhermet | ECO
|
1,402 | 2.65 | |||
| Yves Prat | DVG | 940 | 1.78 | |||
| Philippe Cochet | ECO
|
471 | 0.89 | |||
| Gabriel Cardaire | DLF | 421 | 0.80 | |||
| Pierre Michallet | EXG
|
259 | 0.49 | |||
| Michaël Masclet | DIV
|
178 | 0.34 | |||
| Hélène Denis | DIV
|
0 | 0.00 | |||
| Votes | 52,857 | 100.00 | 45,477 | 100.00 | ||
| Valid votes | 52,857 | 98.33 | 45,477 | 93.46 | ||
| Blank votes | 620 | 1.15 | 2,217 | 4.56 | ||
| Null votes | 275 | 0.51 | 963 | 1.98 | ||
| Turnout | 53,752 | 54.97 | 48,657 | 49.76 | ||
| Abstentions | 44,035 | 45.03 | 49,133 | 50.24 | ||
| Registered voters | 97,787 | 97,790 | ||||
| Source: Ministry of the Interior | ||||||
2012
| Candidate | Party | First round | Second round | ||||||||
|---|---|---|---|---|---|---|---|---|---|---|---|
| Votes | % | Votes | % | ||||||||
| Laurent Wauquiez | UMP | 30,916 | 49.74% | 36,651 | 63.95% | ||||||
| Guy Vocanson | PS | 14,569 | 23.44% | 20,662 | 36.05% | ||||||
| Pierre Cheynet | FN
|
7,257 | 11.68% | ||||||||
| Gustave Alirol | 3,895 | 6.27% | |||||||||
| Yves Prat | FG | 2,943 | 4.73% | ||||||||
| Anne-Audrey Perrin-Patural | MoDem | 542 | 0.87% | ||||||||
| Edouard Ducray | PP
|
380 | 0.61% | ||||||||
| Lucien Seytre | LT | 336 | 0.54% | ||||||||
| Max Chambon | POI | 297 | 0.48% | ||||||||
| Philippe Roche | SE
|
280 | 0.45% | ||||||||
| Christophe Mezzasoma | AEI | 274 | 0.44% | ||||||||
| Philippe Cochet | MEI | 262 | 0.42% | ||||||||
| Claudette Balleydier | LO
|
205 | 0.33% | ||||||||
| Valid votes | 62,156 | 98.62% | 57,313 | 97.32% | |||||||
| Spoilt and null votes | 871 | 1.38% | 1,579 | 2.68% | |||||||
| Votes cast / turnout | 63,027 | 65.79% | 58,892 | 61.48% | |||||||
| Abstentions | 32,776 | 34.21% | 36,905 | 38.52% | |||||||
| Registered voters | 95,803 | 100.00% | 95,797 | 100.00% | |||||||
References
- ^ "Résultats des élections législatives 2012". Ministry of the Interior. Retrieved 28 April 2017.
