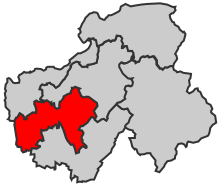
Haute-Savoie's 1st constituency
| 1st constituency of Constituency of the National Assembly of France | |
|---|---|
 Constituency in Department | |
 Haute-Savoie in France | |
| Deputy | |
| Department | Haute-Savoie |
The 1st constituency of Haute-Savoie is a French legislative
constituency
in Haute-Savoie.
Historic representation
| Election | Member | Party | |
|---|---|---|---|
| 1958 | Charles Bosson | MRP | |
| 1962 | CD | ||
| 1967 | |||
| 1968 | Jean Brocard | RI | |
| 1973 | |||
| 1978 | UDF | ||
| 1981 | |||
| 1986 | Proportional representation | ||
| 1988 | Jean Brocard | UDF | |
| 1993 | Bernard Accoyer | RPR | |
| 1997 | |||
| 2002 | UMP | ||
| 2007 | |||
| 2012 | |||
| 2017 | Véronique Riotton | LREM
| |
| 2022 | RE | ||
Election results
2022
| Party | Candidate | Votes | % | ±% | |||
|---|---|---|---|---|---|---|---|
Ensemble )
|
Véronique Riotton | 19,000 | 36.35 | -12.61 | |||
NUPÉS )
|
Anne-Valérie Duval | 12,464 | 23.85 | +11.98 | |||
| RN | Didier Jouffrey | 8,472 | 16.21 | +5.98 | |||
| LR (UDC) | Aurélia Patty Gomila | 6,830 | 13.07 | -5.77 | |||
| REC | Guillaume Jambard | 2,341 | 4.48 | N/A | |||
| Others | N/A | 3,161 | - | - | |||
| Turnout | 52,268 | 48.83 | -0.31 | ||||
| 2nd round result | |||||||
Ensemble )
|
Véronique Riotton | 29,312 | 62.65 | -1.67 | |||
NUPÉS )
|
Anne-Valérie Duval | 17,477 | 37.35 | N/A | |||
| Turnout | 29,312 | 46.35 | +7.37 | ||||
LREM hold
| |||||||
2017
| Party | Candidate | Votes | % | ±% | |||
|---|---|---|---|---|---|---|---|
LREM
|
Véronique Riotton | 23,631 | 47.96 | ||||
| LR | Annabel Andre-Laurent | 9,285 | 18.84 | ||||
FN
|
Brigitte Thiery-Audubert | 5,072 | 10.29 | ||||
| LFI | Julian Auge | 3,199 | 6.49 | ||||
EELV
|
Jean-Jacques Bouchet | 1,414 | 2.87 | ||||
| PS | Christophe Poncet | 1,235 | 2.51 | ||||
| Others | N/A | 5,434 | |||||
| Turnout | 49,271 | 49.14 | |||||
| 2nd round result | |||||||
LREM
|
Véronique Riotton | 25,174 | 64.32 | ||||
| LR | Annabel Andre-Laurent | 13,962 | 35.68 | ||||
| Turnout | 39,136 | 38.98 | |||||
LREM gain from LR
| |||||||
2012
| Candidate | Party | First round | Second round | ||||||||
|---|---|---|---|---|---|---|---|---|---|---|---|
| Votes | % | Votes | % | ||||||||
| Bernard Accoyer | UMP | 23,511 | 43.45% | 27,473 | 56.06% | ||||||
| Christian Jeantet | PS | 16,936 | 31.30% | 21,535 | 43.94% | ||||||
| André Adobati | FN
|
6,799 | 12.56% | ||||||||
| Claude Comet | EELV
|
2,763 | 5.11% | ||||||||
| Eliane Chazal Vindret | FG | 1,709 | 3.16% | ||||||||
| Raphaël Gallet | DLR
|
783 | 1.45% | ||||||||
| Stéphane Gogibus | LT | 541 | 1.00% | ||||||||
| Sylvain Socquet-Juglard | AEI | 348 | 0.64% | ||||||||
| Hamdy Boussouiba | MEI | 320 | 0.59% | ||||||||
| Bethsabée Lunel | NPA | 222 | 0.41% | ||||||||
| Jean-Paul Macé | LO
|
179 | 0.33% | ||||||||
| Valid votes | 54,111 | 98.79% | 49,008 | 97.30% | |||||||
| Spoilt and null votes | 660 | 1.21% | 1,358 | 2.70% | |||||||
| Votes cast / turnout | 54,771 | 58.79% | 50,366 | 54.02% | |||||||
| Abstentions | 38,393 | 41.21% | 42,877 | 45.98% | |||||||
| Registered voters | 93,164 | 100.00% | 93,243 | 100.00% | |||||||
References
- ^ "Résultats des élections législatives 2012". Ministry of the Interior. Retrieved 26 April 2017.
