
History of California (1900–present)
| History of California |
|---|
 |
| Periods |
| Topics |
| Cities |
| Regions |
| Bibliographies |
|
|
After 1900, California continued to grow rapidly and soon became an agricultural and industrial power. The economy was widely based on specialty agriculture, oil, tourism, shipping, film, and after 1940 advanced technology such as aerospace and electronics industries – along with a significant military presence. The films and stars of Hollywood helped make the state the "center" of worldwide attention. California became an American cultural phenomenon; the idea of the "California Dream" as a portion of the larger American Dream of finding a better life drew 35 million new residents from the start to the end of the 20th century (1900–2010).[1] Silicon Valley became the world's center for computer innovation.
California demographics
This article needs additional citations for verification. (April 2024) |
| Census | Pop. | Note | %± |
|---|---|---|---|
| 1840 | 8,000 | — | |
| 1850 | 120,000 | 1,400.0% | |
| 1860 | 379,994 | 216.7% | |
| 1870 | 560,247 | 47.4% | |
| 1880 | 864,694 | 54.3% | |
| 1890 | 1,213,398 | 40.3% | |
| 1900 | 1,485,053 | 22.4% | |
| 1910 | 2,377,549 | 60.1% | |
| 1920 | 3,426,861 | 44.1% | |
| 1930 | 5,677,251 | 65.7% | |
| 1940 | 6,907,387 | 21.7% | |
| 1950 | 10,586,223 | 53.3% | |
| 1960 | 15,717,204 | 48.5% | |
| 1970 | 19,953,134 | 27.0% | |
| 1980 | 23,667,902 | 18.6% | |
| 1990 | 29,760,021 | 25.7% | |
| 2000 | 33,871,648 | 13.8% | |
| 2010 | 37,253,956 | 10.0% | |
| 2020 | 39,538,223 | 6.1% | |
| Sources: 1850–2020 U.S. Census[2] * The 1850 statistics are corrected for lost census data in San Francisco, Santa Clara and Contra Costa Counties. California Indians were not counted before the 1870 census. | |||
California is now the most populous state in the United States. If it were an independent country, California would rank 34th in population in the world. California has had waves of immigration and emigration over the years. The first big wave was the
There were fewer than 10,000 females in a total California population (not including Native Americans who were not counted) of about 120,000 residents in 1850. About 3.0% of the gold rush Argonauts before 1850 were female or about 3,500 female Gold Rushers, compared to about 115,000 male California Gold Rushers. Massive immigration from mostly other states continued throughout the nineteenth century.[3][4] California did not reach a "normal" male to female ratio of about one to one until the 1950 census. California for over a century was short on females.
The 1900 census showed emigrations down to "only" a 20% growth rate. The early 1900s showed a massive population increase of over 60% between 1900 and 1910. The population more than doubled again in the next 20 years by 1930. Foreign immigration largely ceased during the Great Depression, as immigration to the United States was held to a low of 23,068 per year by 1933, and many foreign workers were deported. There were not enough jobs to go around. After World War II and the Great Depression, there was a rapidly increasing buildup of United States workers in California as wartime industries boomed. Most of these workers were from other states as they settled in California and increased the California population to 10,586,223 by 1950. Immigration to the United States only started to increase significantly in 1946, when immigration to all of the United States was back up to 108,721 per year[3] The continuing prosperity and emigration from other states and immigration from other countries in the 1950s and 1970s almost doubled the California population again to 19,953,134 by 1970. The 1970–2010 population growth has still been substantial but has slowed to "only" about a 15% growth rate per decade. By 2010 the California population growth rate slowed slightly to 10%.
California earthquakes


The 1906 San Francisco earthquake struck the city (then the largest in California) and nearby communities at 5:12 a.m. on Wednesday, April 18, 1906.[5] Devastating fires broke out in the city that lasted for several days, destroying about 28,000 buildings. As a result of the quake and fires, over 3,000 people died[6] and over 80% of San Francisco was destroyed. The death toll from the earthquake and resulting fire is the greatest loss of life from a natural disaster in California's history.
The most widely accepted estimate for the magnitude of the earthquake is a
The San Francisco 1906 earthquake was caused by a rupture on the San Andreas Fault, a continental transform fault that forms part of the tectonic boundary between the Pacific Plate and the North American Plate. The fault is characterized by mainly lateral motion where the western (Pacific) plate moves northward relative to the eastern (North American) plate. The 1906 rupture propagated both northward and southward from its epicenter for a total of about 300 miles (480 km).[10] The San Andreas Fault runs the length of California from the Salton Sea in the south to Cape Mendocino to the north, a distance of about 810 miles (1,300 km). The earthquake ruptured the northern third of the fault for a distance of about 300 miles (480 km). The maximum observed surface displacement was about 20 feet (6.1 m); however, geodetic measurements show displacements of up to 28 feet (8.5 m) in some places.[11] The most recent analysis by the United States Geological Survey (USGS) shows that the most likely epicenter of the 1906 earthquake was very near Mussel Rock on the coast of Daly City, an adjacent suburb just south of San Francisco.[12]
A strong
| Significant California earthquakes | ||
|---|---|---|
| Earthquake | Magnitude | Fatalities |
| 1906 San Francisco | 7.8 | 3,000+1 |
| 1925 Santa Barbara | 6.3–6.8 | 13 |
| 1933 Long Beach | 6.4 | 115 |
| 1952 Kern County | 7.3 | 12 |
| 1971 San Fernando | 6.6 | 65 |
| 1989 Loma Prieta | 6.9 | 63 |
| 1994 Northridge | 6.7 | 60 |
| Notes: 1. The 1906 San Francisco earthquake caused so much damage that the authorities "lied" about the number of casualties. Subsequent research has shown that about 3,450 were "known" to have died. Some more were shot for looting.[citation needed] | ||
Due to a widespread practice by
California oil industry
California pioneers after 1848 discovered an increasing number of
Oil became a major California industry in the 20th century with the discovery of new fields around Los Angeles and the San Joaquin Valley, and the dramatic explosion in demand for gasoline to fuel the rapidly growing number of automobiles and trucks now being produced. Most of the oil production in California began in the late 19th century.[17] At the turn of the century, oil production in California continued to rise at a booming rate. In 1900, the state of California produced 4 million barrels.[17] In 1903, California became the leading oil-producing state in the US, and traded the number one position back and forth with Oklahoma through 1930.[18] Production at the various oil fields increased to about 34 million barrels per year by 1904. By 1910 production had reached 78 million barrels. California drilling operations and oil production are concentrated primarily in Kern County, the San Joaquin Valley, and the Los Angeles Basin.
As of 2012, California was the nation's third most prolific oil-producing state, behind only
There is also some offshore oil and gas production in California, but there is now a moratorium on new offshore oil and gas leasing and drilling in California waters and a deferral of leasing in federal waters. These restrictions were imposed after a series of accidents in the 1969 Santa Barbara oil spill released oil into the Pacific Ocean.[20]
.jpg)
In 1920, oil production in California had expanded to 77 million barrels.[17] Between 1920 and 1930, new oil fields across southern California were being discovered with regularity, including Huntington Beach in 1920, Long Beach and Santa Fe Springs in 1921, and Dominguez in 1923.[17] Southern California had become the hotbed for oil production in the United States.
However, the development of increased oil production in California had consequences. The additional California oil fields, along with booming oil supplies in Texas and Oklahoma, put downward pressure on the price. In the 1930s the
After a century, the San Joaquin Valley remains a major producer. The Kern County part of the valley in 2008 had over 42,000 producing oil wells that provided about 68% of the oil produced in California, 10% of the entire United States production, and close to 1% of the total world oil production. Add to that another producing 2,000 wells in Fresno County. If the valley were a state in its own right, it would rank behind Texas, Alaska, and Louisiana as the fourth largest oil producer state in the country.
| California oil production in 2005[21] | |
|---|---|
| State | Barrels/day |
| Louisiana | 1,463,000 |
| Texas | 1,331000 |
| Alaska | 894,000 |
| California San Joaquin Valley |
515,000 |
| Oklahoma | 177,000 |
| New Mexico | 171,000 |
The San Joaquin Valley is also home to 21 giant oil fields that have produced over 100 million barrels of oil each, with four "super giants" that have produced over 1 billion barrels of oil. Among these "super giants" are
For a chronology of the state's oil industry see California oil and gas industry#Chronology of the California oil industry.
Natural gas
In 2020 the state was the 14th largest producer of natural gas in the United States, with a total annual production of over 170 billion cu feet of gas.[22] In 2014 natural gas was the second most widely used energy source in California. About 45% was burned in gas-fired plants for electricity generation; the proportion increases as coal-burning plants are phased out and nearly all new plants are powered by natural gas. One of the main advantages of natural gas is that it only produces about 55% as much CO2 as coal for the same amount of electricity produced. About 9% of the natural gas was used in facilitating the extraction of more oil and gas. Another 21% was used for residential space and water heating, cooking, clothes drying, etc.; 9% was used for commercial building and water heating, and 15% was used in industrial use.[23] California imports about 85% of its natural gas, using six large gas pipelines from Texas, New Mexico and Canada.
California businessmen
In 1911 a new
Although the businessmen were influential in obtaining the passage of bills they wanted, no group of businessmen dominated the California legislature or the railroad commission after 1910. Legislation proposed by some businessmen was opposed by other business interests.
In the 1920s, most progressives came to view the business culture of the day not as a repudiation of progressive goals but as the fulfillment of it. The most important progressive victories of 1921 were the passage of administrative reorganization laws, the King Bill, increasing corporate taxes, and a progressive budget. In 1927–31, governor
California women
California women had the right to own property in their own name since the first
Progressive Era
California played a major role in the Progressive Movement. It was the only state where the Progressives took control of the Republican Party.
Lincoln–Roosevelt League
California was a leader in the
By 1916 the Progressives were supporting
Political progressivism varied across the state. Los Angeles (population 102,000 in 1900) focused on the dangers posed by the Southern Pacific Railroad, the liquor trade, and labor unions; San Francisco (population 342,000 in 1900) was confronted with a corrupt union-backed political "machine" that was finally overthrown following the earthquake of 1906. Smaller cities like
World War I
California played a major role in terms of agriculture, industry, finance and propaganda during World War I.[31] Its industrialized agriculture exported food to the Allies, 1914–1917, and expanded again when America entered the war in 1917. After the war ended, it shipped large quantities of food to central Europe as part of national relief efforts. Hollywood was thoroughly engaged, with feature films and training films.[32] Attractive climate conditions led to the addition of numerous Army and Navy training camps and airfields. Construction of transports and warships boosted the economy of the Bay area.
Organized labor
Organized labor was centered in San Francisco for much of the state's early history. By the opening decades of the twentieth century, labor efforts had expanded to Los Angeles, Long Beach and the Central Valley. In 1901, the San Francisco-based City Front Federation was reputed to be the strongest trade federation in the country. It grew out of intense organizational drives in every trade during the boom around the start of the 20th century.
Employers also organized during the building trades strike of 1900 and the (San Francisco) City Front Federation strike of 1901, which led to the founding of the Building Trades Council. The open shop question was at stake. Out of the City Front strike came the Union Labor Party, because workers were angry at the mayor for using the police to protect strikebreakers. Eugene Schmitz was elected mayor in 1902 on the party's ticket, making San Francisco the only town in the United States, for a time, to be run by labor. A combination of corruption and unscrupulous reformers culminated in graft prosecutions in 1907.
In 1910, Los Angeles was still an open shop, and employers in the north threatened for a new push to open San Francisco shops. Responding, labor sent delegations south in June 1910. National organizers were sent in during a lockout of 1,200 idled metal-trades workers. Then occurred an incident that would set back Los Angeles organizing for years: on October 10, 1910, a bomb exploded at the Los Angeles Times newspaper plant that killed 21 workers.
In 1912, the San Diego Common Council passed an ordinance to restrict free speech and public demonstrations over a diverse neighborhood where the local labor groups met. This columnated into the San Diego free speech fight, where police confrontations led to mass arrests, police brutality, and the lynching of dozens of people by patriotic vigilantes in reeducation camps that were overlooked by law enforcement.
In the decade following, the rapid growth of the
The IWW was also involved in the 1923 seamen's strike at San Pedro, where Upton Sinclair was arrested for reciting the Declaration of Independence. The man who became the most prominent Wobbly of all, Thomas Mooney, soon became a cause-celebre of labor and the most important political prisoner in America.
Labor in the 1920s
The Preparedness Day Bombing killed ten people and hurt labor for decades. During the 1920s, the open shop efforts succeeded through a coordinated strategy called the "American Plan". In one case, the Industrial Association of San Francisco raised over a million dollars to break the building trades strikes in 1921 that led to the collapse of the building trades unions. This employers association cut wages twice in one year, and the Metal Trades Council was defeated, losing an agreement that had been in effect since 1907. The Seamen's Union also suffered defeat in 1921.
Labor in the 1930s
Labor unions

Unions grew rapidly after 1935 with political and legal support from the national
On "Bloody Thursday", July 5, 1934, San Francisco was swept by bloody rioting. Striking maritime workers, pitting themselves against police, took control of much of the waterfront and warehouse areas of the city. Two workers were killed and hundreds were clubbed and gassed. The West Coast Waterfront Strike lasted 83 days, with longshoremen returning to work on July 31. Arbitration was agreed to, and it resulted in a victory for the strikers and the unionization of all West Coast ports in the United States.[33]
San Francisco in the late 1930s had 120,000 union members. Longshoremen wore union buttons on their white union-made caps,
Farm labor

Farm labor remained unorganized, the work brutal and underpaid. In the 1930s, 200,000 farm laborers traveled the state in tune with the seasons.[citation needed] Unions were accused of an "inland march" against landowners' rights when they took up the early effort to organize farm labor. A number of valley towns endorsed anti-picketing ordinances to thwart organizing.
In the 1933–1934 period, a wave of agricultural strikes flooded the Central Valley, including the
A 1938 ballot proposition against picketing, "Proposition #1", considered
By the advent of World War II, California had an old-age assistance law,
Okies
"
Radical politics
In the
Water projects


The only way California can support its extensive population and agriculture is to store water in numerous reservoirs and use pipes, tunnels, pumps and canals to distribute it where it is needed when it is needed. Beginning before 1900, California has built extensive water projects costing many billions of dollars to store and move water where it is needed. California water comes primarily from snowfall in the
Los Angeles Aqueduct
The Los Angeles Aqueduct runs from the Owens Valley, through the Mojave Desert and its Antelope Valley, to dry Los Angeles far to the south. The aqueduct project began in 1905 when the people of Los Angeles approved a US$1.5 million bond for the "purchase of lands and water and the inauguration of work on the aqueduct".[41][42]
On June 12, 1907, a second bond was passed with a budget of US$24.5 million to fund the project.[41][43] Construction began in 1908 and finished in 1913 while employing 5,000 workers during that period.[44][45][46][47]
The Los Angeles aqueduct as originally constructed consisted of six storage reservoirs and 215 miles (346 km) of conduit. Beginning 3.5 miles (5.6 km) north of Black Rock Springs, the aqueduct diverts the Owens River into an unlined canal to begin its 233-mile (375 km) journey south to the Lower San Fernando Reservoir.[48] This reservoir was later renamed the Lower Van Norman Reservoir. Creeks flowing from the eastern Sierra are diverted into the aqueduct.
The original project consisted of 24 miles (39 km) of open unlined canal, 37 miles (60 km) of lined open canal, 97 miles (156 km) of covered concrete conduit, 43 miles (69 km) of concrete tunnels, and 12.05 miles (19.39 km) of steel siphons. To build it required 120 miles (190 km) of railroad track, two hydroelectric plants, three cement plants, 170 miles (270 km) of power lines, 240 miles (390 km) of telephone line, and 500 miles (800 km) of roads.[49] It was later expanded with the construction of the Mono Extension and the Second Los Angeles Aqueduct.[50]
The Los Angeles Aqueduct uses gravity alone to move water and to generate electricity, so it is cost-efficient to operate.[51] Finished in 1911, the Los Angeles Aqueduct was the brain-child of the self-taught engineer William Mulholland and is still in use today.
Hetch Hetchy
Hetch Hetchy is a valley that lies in the northwestern part of Yosemite National Park and is drained by the Tuolumne River. Starting in about 1901, San Francisco started looking for a new supply of municipal water. Following the disastrous 1906 San Francisco earthquake and fire, this search intensified, and they finally chose the Tuolumne River as the "best" available water resource. The City and County of San Francisco bought most of the water rights to the Tuolumne River watershed in 1910. The Hetch Hetchy project centered on damming the main Tuolumne River as it meandered through Hetch Hetchy's wide glacial-cut valley. The river, with its source in a perpetual glacier on 13,000-foot (4,000 m) Mount Lyell, drains 650 square miles (1,700 km2) of watershed of the rugged granite mountains sloping west from the Sierra Nevada crest. The Hetch Hetchy water system's goal was providing up to 400,000,000 US gallons (1.5×10⁹ L) of water per day to San Francisco and the growing Bay Region and tap the hydroelectric power that would be generated by a dam and power stations. After a vigorous debate, the United States Congress passed the Raker Act in 1913 which authorized the building of dam(s), hydroelectricity plant and municipal water supply system inside part of Yosemite National Park. The act was signed by President Woodrow Wilson in February 1916.
A key element of the plan was a new dam and reservoir in the Hetch Hetchy Valley, but access to the area was poor, so a railroad was planned to help build the dam. The steep terrain dictated a 4-degree roadbed, roughly twice as steep as a "regular" railroad. The steep grades dictated geared-down locomotives. The first 9 miles (14 km) of the
The vast Hetch Hetchy Project undertaking created the 360,000 acre-feet (440,000,000 m3)
In 1923, the O'Shaughnessy Dam was completed to its initial height on the Tuolumne River, creating the Hetch Hetchy Reservoir. The dam was raised 65.5 feet (20.0 m) higher to its present 430 feet (130 m) height in 1939.[53] The dam and reservoir are the centerpiece of the Hetch Hetchy Project, which in 1934 began to deliver water 167 miles (269 km) west to San Francisco and its client municipalities in the greater San Francisco Bay Area.
Central Valley Project


Shasta Dam was envisioned as early as 1919 because of frequent floods and droughts troubling California's largest agricultural region, the Central Valley. Shasta Dam was first authorized in the 1930s as a state undertaking. However, this coincided with the Great Depression, and building of the dam was transferred to the federal Bureau of Reclamation as a public works project. Construction started in earnest in 1937 under the supervision of Chief Engineer Frank Crowe. During its building, the dam provided thousands of much-needed jobs; it was finished 26 months ahead of schedule in 1945. When completed, the dam was the second-tallest in the United States after Hoover, and was considered one of the greatest engineering feats of all time.
Even before its dedication, Shasta Dam served an important role in World War II, providing electricity to California factories, and it still plays a vital part in the management of state water resources. However, it has brought about major changes to the environment and ecology of the Sacramento River, and met with controversy over its significant destruction of Native American tribal lands. In recent years, there has been debate over whether or not to raise the dam in order to allow for increased water storage and hydropower generation.
Construction on the Mokelumne Aqueduct and Pardee Dam began in 1926, and by 1929 the 345-foot-high (105 m) concrete arch Pardee Dam and the First Mokelumne Aqueduct, consisting of a single pipeline, were completed. The first deliveries to the Bay Area from the 210,000-acre-foot (260,000,000 m3) reservoir were made on June 23, 1929. At the time of completion, Pardee Dam was the tallest in the world (this record was surpassed one year later by Diablo Dam in Washington). In 1949, a second pipeline was built, and in 1963 the third pipeline was constructed, bringing the aqueduct to its present capacity.[58] In 1964, the second major dam and reservoir on the Mokelumne River, the Camanche Dam and 410,000-acre-foot (510,000,000 m3) Camanche Reservoir, were completed below Pardee. The Mokelumne Aqueduct and dam(s), run by the East Bay Municipal Utility District (EBMUD), is the primary water source for 35 communities in Alameda and Contra Costa counties, including Berkeley and Oakland. EBMUD holds water rights to almost all of the 30,000 acres (120 km2) in the Mokelumne River watershed and 25,000 acres (100 km2) in other watersheds. EBMUD also has an American River water right that could be sent to the Mokelumne Aqueduct through the Folsom South Canal.

The

The aqueduct begins at the
Water flows through the aqueduct in a series of abrupt rises and gradual falls. The water flows down a long segment, built at a slight grade, and arrives at a pumping station powered by Path 66 or Path 15. The pumping station raises the water, where it again gradually flows downhill to the next station. However, where there are substantial drops, the water's potential energy is recaptured by hydroelectric plants. The initial pumping station fed by the Sacramento River Delta raises the water 240 ft (73 m), while a series of pumps culminating at the Edmonston Pumping Plant raises the water 1,926 ft (587 m) over the Tehachapi Mountains. The Edmonston Pumping station requires so much power that several power lines off Path 15 and Path 26 are needed to ensure proper operation of the pumps.
A typical section has a concrete-lined channel 40 feet (12 m) at the base and an average water depth of about 30 feet (9.1 m). The widest section of the aqueduct is 110 feet (34 m), and the deepest is 32 feet (9.8 m). Channel capacity is 13,100 cubic feet per second (370 m3/s), and the largest pumping plant capacity at Dos Amigos is 15,450 cubic feet per second (437 m3/s).

The
The SWP collects water from rivers in northern California and redistributes it to the water-scarce but populous south through a network of aqueducts, pumping stations and hydroelectric plants. About 70% of the water provided by the project is used for urban areas and industry in southern California and the San Francisco Bay Area, and 30% is used for irrigation in the Central Valley.[62] To reach southern California, the water must be pumped 2,000 feet (610 m) over the Tehachapi Mountains—the highest single water lift in the world.[63] The SWP shares many facilities with the federal Central Valley Project (CVP), which primarily serves agricultural users. Water can be interchanged between SWP and CVP canals as needed to meet peak requirements for project constituents. The SWP provides estimated annual benefits of $400 billion to California's economy.[64]
Since its inception in 1960, the SWP has required the construction of 21 dams and more than 700 miles (1,100 km) of canals, pipelines and tunnels,[65] although these constitute only a fraction of the facilities originally proposed. As a result, the project has only delivered an average of 2.4 million acre-feet (3.0 km3) annually, as compared to total entitlements of 4.23 million acre-feet (5.22 km3). Environmental concerns caused by the dry-season removal of water from the Sacramento–San Joaquin River Delta, a sensitive estuary region, have often led to further reductions in water delivery. Work continues today to expand the SWP's water delivery capacity while finding solutions for the environmental impacts of water diversion.

The Colorado River Aqueduct, or CRA, is a 242-mile (389 km) water conveyance in southern California, operated by the Metropolitan Water District of Southern California (MWD). The aqueduct impounds water from the Colorado River at Lake Havasu on the California–Arizona border. This water is then transferred west by pumping stations, reservoirs, and canals across the Mojave and Colorado deserts to the east side of the Santa Ana Mountains. It is one of the primary sources of drinking water for southern California.
Originally conceived by William Mulholland and designed by Chief Engineer Frank E. Weymouth of the MWD, it was the largest public works project in southern California during the Great Depression. The project employed 30,000 people over an eight-year period and as many as 10,000 at one time.[66]
The system is composed of two reservoirs, five pumping stations, 63 miles (101 km) of canals, 92 miles (148 km) of tunnels, and 84 miles (135 km) of buried conduit and siphons. Average annual throughput is 1,200,000 acre-feet (1.5 km3).[66]


Imperial Dam is a concrete slab and buttress, ogee weir structure across the Colorado River on the California–Arizona border, 18 miles (29 km) northeast of Yuma. Completed in the 1938, the dam retains the waters of the Colorado River in the Imperial Reservoir before desilting and diversion into the All-American Canal, the Gila River, and the Yuma Project aqueduct. Between 1932 and 1940, the Imperial Irrigation District relied on the Inter-California Canal, the Imperial Canal, and the Alamo River.
Imperial Dam was built to replace the Laguna Diversion Dam, built in 1901–1915, which was the first dam and reclamation project on the Colorado River. Imperial Dam was built with three sections; the gates of each section hold back the water to help divert the water towards the desilting plant. Three giant desilting basins and 72 770-foot (230 m) scrapers hold and desilt the water; the removed silt is carried away by six sludge pipes running under the Colorado River that dump the sediment into the California sluiceway, which returns the silt to the Colorado River. The water is now directed back towards one of the three sections which divert the water into one of the three channels. About 90% of the volume of the Colorado River is diverted into the canals at this location. Diversions can top 40,000 cubic feet (1,100 m3) per second—more than 50 times the flow of the Rio Grande.
The Gila River and the Yuma Project aqueduct branch off toward Arizona, while the All-American Canal branches southwards for 37 miles (60 km) before reaching its headworks on the California border and bending west toward the Imperial Valley.

The All-American Canal is an 80-mile-long (130 km) aqueduct in southeastern California. It conveys water from the Colorado River into the Imperial Valley and to nine cities. It is the Imperial Valley's only water source, and replaced the Alamo Canal, which was located mostly in Mexico. The Imperial Dam, about 30 miles (48 km) northeast of Yuma, Arizona, on the Colorado River, diverts water into the All-American Canal, which runs to just west of Calexico, California, before its last branch heads mostly north into the Imperial Valley. Five smaller canals branching off the All-American Canal move water into the Imperial Valley. These canal systems irrigate up to 630,000 acres (250,000 ha) of good cropland and have made possible a greatly increased crop yield in this area, originally one of the driest on earth. It is the largest irrigation canal in the world, carrying a maximum of 26,155 cubic feet per second (740.6 m3/s). Agricultural runoff from the All-American Canal drains into the Salton Sea. The All-American Canal runs parallel to the Mexico–United States border for several miles.
The Sacramento Deep Water Ship Channel (also known as the "Sacramento River Deep Water Ship Channel" or "SRDWSC") is a canal from the Port of Sacramento to the Sacramento River, which flows into San Francisco Bay. It was completed by the United States Army Corps of Engineers in 1963. The channel is about 30 feet (9.1 m) deep, 200 feet (61 m) wide, and 43 miles (69 km) long.
The Port of Sacramento has always been a significant port on the West Coast of the United States since the 1849 California Gold Rush. It was originally served primarily by paddle steamers which carried cargo from San Francisco Bay up the Sacramento River to Sacramento. Today it receives far less traffic than larger ports and handles primarily agricultural products and other bulk goods rather than containers, which now dominate the shipping market.
Other engineering feats were the building of Hoover Dam, which though in Nevada, provides power and water to southern California.
Another project was the draining of Tulare Lake, which during high water was the largest freshwater lake fully inside an American state. This created a large wet area amid the dry San Joaquin Valley, and swamps abounded at its shores. By the 1970s, it was completely drained, but it attempts to resurrect itself during heavy rains.
Water recycling
The recycling of treated municipal wastewater has become a significant part of California's water supply. The different water agencies in California were recycling over 770,000 acre-feet (950,000,000 m3) as of 2009, the date of the last survey. Some of the many uses for recycled water are: golf course irrigation 7%, landscape irrigation 17%, agricultural irrigation 37%, commercial reuse of water 7%, industrial uses 7%, geothermal energy production 1%, seawater intrusion barrier via fresh water injections 7%, groundwater recharge by well injection and flotation ponds 12%, recreational impoundments 4%, and natural wetland systems/restoration 4%.[67] The stated goal is the recycling of 1,600,000 acre-feet (2.0×10⁹ m3) of treated municipal wastewater.
On March 14, 2014, the State Water Board approved $800 million in financial incentives for recycled water projects.[68] These projects typically take years to get approved and built.
The Water Replenishment District of Southern California (WRD), in service since 1959, is one of the more aggressive agencies that use recycled water for their groundwater replenishment and seawater intrusion barriers.[69] To prevent seawater contamination of their groundwater, they have several sets of injection wells that inject clean water between their aquifer and the sea. This creates a local water barrier to seawater intrusion. The other mechanism is to make sure the water level is above sea level.
Well users, including municipal water users, in the WRD area pump about 250,000 acre-feet (310,000,000 m3) of water per year out of their aquifer. This is an "overdraft" of about 150,000 acre-feet (190,000,000 m3) of water over what their underground aquifer can "normally" refill. To replace this "overdraft" of water into the aquifer, they have flotation ponds that catch rain runoff water, and supplement with other water they either buy or recycle, then let the water soak into the ground (spreading water) to help replenish the water in the aquifer(s). In addition they buy Colorado River water that is shipped via the Colorado River Aqueduct, and they accept part of the treated municipal wastewater of the about 4,000,000 people in their district and treat it to additional purity and sanitation levels by using reverse osmosis and advanced filtering. Their largest tertiary water treatment facility is the Leo J. Vander Lans Advanced Water Treatment facility. The water out of this facility is better than the water that comes out of the "average" municipal water treatment facility.[citation needed] To finance their water recycling projects WRD charges $268 per acre-foot of water pumped out, which generates about $65,000,000/year.[70] WRD is now on a project (WIN) to enlarge their water treatment facilities to take larger quantities of treated municipal wastewater and treat enough of it that they will not have to buy Colorado River water. Overall it is estimated that this project provides over 40% of the water used in the southern California district served by the WRD.
Among the many water recycling projects just being completed, the
In the San Diego region, 16 water agencies are planning to use over 32,300 acre-feet (39,800,000 m3) of recycled water per year in order to meet the region's water supply demand. The city of Carlsbad's new recycled water treatment and distribution system will deliver approximately 3,000 acre-feet (3,700,000 m3) per year of recycled water to customers located in that community. In the southern portion of San Diego County, the Otay Water District is constructing a distribution system to deliver an estimated 5,000 acre-feet (6,200,000 m3) per year of recycled water by 2030 purchased from the city of San Diego's South Bay Water Recycling Plant. In southern California, the Elsinore Valley Municipal Water District is using recycled water to help replenish and enhance Lake Elsinore.
The
Desalination projects
On December 24, 2012, the San Diego County Water Authority announced they had sold $734 million worth of tax-free bonds at 4.38% interest to build the Carlsbad Seawater Desalination Project, the largest seawater desalination plant in the Western Hemisphere. The project is located near the Encina Power Station in Carlsbad, and is expected to produce about 56,000 acre-feet (69,000,000 m3) of water per year by 2016 when the project is completed. The plant is expected to use over 17,000 reverse osmosis racks. The project includes $80 million in San Diego Water Authority upgrades to its own facilities. A 10-mile (16 km) pipeline is being built to deliver desalinated water into its Twin Oaks Valley Water Treatment Plant near San Marcos. The developer Poseidon Resources is building the plant and pipeline in a joint venture with contractor Kiewit Shea Desalination. The project will deliver up to 50 million gallons a day of drought-proof, highly reliable water that will become a core, day-to-day resource for the region. It is projected to meet about 7% of San Diego County's demand in 2020. The total cost is projected at $1,849 to $2,257 per acre-foot.[72][73] The additional cost of desalinating seawater will add $5 to $7 per month to ratepayers' bills—about a 10% increase. Poseidon has also proposed the Huntington Beach Desalination Plant.
The 2014 drought has brought reconsideration of the Charles Meyer Desalination Facility that was built for $34 million in the early 1990s in Santa Barbara but was later essentially mothballed when the drought was over. There are early discussions about investing around $20 million more to upgrade and restart the desalination plant. They have permits to make about 3,000 acre-feet (3,700,000 m3) of desalinated water per year, but they will incur additional costs to pump their desalinated water to existing higher elevation reservoirs if they reactivate the plant. The projected costs (2014) were about $3,000 per acre foot.
The small city of Sand City, located on the Monterey Peninsula, struck out on its own in 2007 to develop a small desalination plant. The city partnered with California American Water for the $14 million project, which started producing 300 acre feet of freshwater a year in 2010. The cost and water are shared with other nearby small communities.[74]
California Department of Water Resource data
The web site run by the California Department of Water Resources lists the present reservoir storage levels for each of California's major reservoirs.[75] Individual reservoir capacities and percent of full are given for the major reservoirs. As of April 3, 2014, they had 12,682,744 acre-feet (1.5643934×10¹⁰ m3) of water stored, or about 65% of the 19,490,257 acre-feet (2.4040878×10¹⁰ m3) of water they usually would have at that time of year.
California's highway system
Movies, radio and TV
The first decades of the twentieth century saw the rise of the
The movies made California even better known, attracting hundreds of thousands of migrants, especially from the
By the 1930s, Hollywood had extended its reach into radio, and by 1950 southern California had also become a major center of television production, hosting studios for major networks such as NBC and CBS.
California aerospace and shipping
California aerospace history
In 1883–1886,
After Wilbur and Orville Wright demonstrated the feasibility of controlled manned flight, Glenn Curtiss entered the field, focusing on aircraft manufacturing and pilot training. Part of this training was done in California.

The Los Angeles International Air Meet (January 10 to January 20, 1910) was among the earliest air shows in the world and the first major air show in the United States.[77] It was held in Los Angeles County at Dominguez Field in present-day Compton.[17] Spectator turnout numbered approximately 254,000 over 11 days of ticket sales.[78] The Los Angeles Times called it "one of the greatest public events in the history of the West."[79]
On November 29, 1910,
On January 18, 1911, at 11:01 a.m.,
The Caltech
During JPL's Army years, the laboratory developed two deployed weapon systems, the
In 1954, JPL teamed up with Wernher von Braun's rocketeers at the Army Ballistic Missile Agency's Redstone Arsenal in Huntsville, Alabama, to propose orbiting a satellite during the International Geophysical Year. The team lost that proposal to Project Vanguard, and instead embarked on a classified project to demonstrate ablative re-entry technology using a Jupiter-C rocket. They carried out three successful sub-orbital flights in 1956 and 1957. Using a spare Jupiter-C, the two organizations then launched America's first satellite, Explorer 1, on February 1, 1958.[82][83]

JPL was transferred to
In 1940, 65% of aircraft manufacturers were located along or near the East or West Coasts of the United States. California alone had 44 percent of all aircraft manufacturing. In 1944, 12 states shared 85 percent of airframe floor space, and California's percentage had dropped to 24%. Engine and propeller manufacturing had also decentralized. Most wartime expansion took place inland due to concerns over possible coastal attacks. After the war, massive layoffs occurred as wartime orders were cancelled.[89]
Major manufacturers of aircraft in California were/are
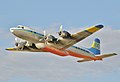
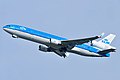
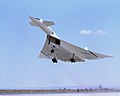
Notable California aircraft
Gallery of aircraft and spacecraft built and developed (wholly or in part) in California. Many more could be included.
-
 Montgomery'sThe Santa Clara glider 1905
 -
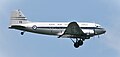 Douglas DC-3 1936
 -

-

-

-
-
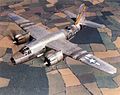 Martin B-26 Marauder 1940
 -

-

-
-

-
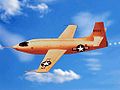 Bell X-1 1946
 -

-
 Douglas DC-4 1947
 -
 Douglas DC-6 1947
 -
 Douglas DC-7 1953
 -
 Douglas DC-8 1958
 -
 Syncom communications satellite 1963
 -
 Nimbus program weather satellite 1964
 -
 Intelsat I 1965
 -

-
-

-

-
 Lockheed U-2 1957
 -
 North American X-15 1959
 -

-

-
-

-
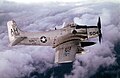
 Douglas A-4 Skyhawk 1966
 -
 Surveyor 1 1966
 -
 Apollo 9 1969
 -
 Apollo 10 1969
 -
 Apollo 11 1969
 -
 Apollo 15 1970
 -
 Rockwell B-1 Lancer 1974
 -

-
 Space Shuttle 1981
 -
 Lockheed F-117 Nighthawk stealth bomber 1985
 -

-


,_circa_in_1943.jpg)


.jpg)


.jpg)


_in_flight_with_full_bomb_load_060901-F-1234S-013.jpg)


.jpg)


During World War II, California's mild climate became a major resource for the war effort. Numerous air-training bases were established in southern California, where most aircraft manufacturers, including
California shipping
Kaiser–Permanente California shipyards

The four Richmond Shipyards, located in the city of Richmond, California, were run by Permanente Metals and Kaiser Shipyards. The Richmond yards were responsible for constructing more Liberty ships during World War II (747) than any other shipyard in the United States. Liberty ships were chosen for mass production because their somewhat obsolete design was relatively simple and their triple expansion piston steam engine components were simple enough that they could be made by several companies that were not highly needed to manufacture other parts. Ship building was given a high priority for steel and other needed components, as the German U-boats until 1944 sunk more ships than could be built by all the shipyards in the United States. The United States shipyards built about 5,926 ships in World War II[92] plus over 100,000 more smallcraft made for the U.S. Army naval components.
747 EC2-S-C1 Liberty ship cargo transports were built. The following references list individual ships built:
- Kaiser Permanente Yard #1; Oceans, Libertys, Victorys; built in Richmond.[93]
- Kaiser Permanente Yard #2; Libertys, Victorys built in Richmond.[94]
- Kaiser Permanente Yard #3; Libertys, Victorys; built in Richmond.[95]
- Kaiser Permanente Yard #4; Landing Ship, Tanks (LST)s, Tugs; built in Richmond.[96]
- Kaiser, California Shipbuilding; Libertys, Victorys; built in Los Angeles[97]
These Liberty ships were completed in two-thirds the amount of time and at a quarter of the cost of the average of all other shipyards. The Liberty ship SS Robert E. Peary was assembled in less than five days as a part of a special competition among shipyards; but by 1944 it was only taking the astonishingly brief time of a little over two weeks to assemble a Liberty ship by standard methods. They pre-assembled major parts of the ship including the hull sections at various locations in the shipyard and then, when needed, moved them with heavy lift cranes to the shipyard launching site, where they welded the pre-built sections together. After the ships were launched they were finished to their final configuration while afloat, and the launchway was available to start building another ship.
In 1945, the shipyards were shut down as quickly as they had started up four years earlier. Much of the shoreline previously occupied by the shipyards is now owned by the city of Richmond and has been cleaned up and redeveloped under federally assisted "
- Richmond Shipyards Images[98][99]
- Map of Kaiser-Permanente Yard #1, #2, #3 and #4[100]
- Kaiser Shipyards[99]
California Shipbuilding Corporation

California Shipbuilding Corporation (often called Calship) built 467 Liberty and Victory ships during World War II, including Haskell-class attack transports. The Calship shipyard was created at Terminal Island in Los Angeles as part of the World War II shipbuilding effort. It was initially eight ways, then increased to 14. After the war, it was liquidated. The ships they built were:
- 306 EC2-S-C1 Liberty ship cargo transports
- 30 Z-ET1-S-C3 Liberty ship tankers
- 32 VC2-S-AP3 Victory ship cargo transports, 8,500 hp
- 30 VC2-S-AP5 Haskell class USN attack transports
- 69 VC2-S-AP2 Victory ship cargo transports, 6,000 hp

On November 6, 1850, two months after California was admitted to statehood, President
Before World War II, Mare Island had been in a continual state of upbuilding. By 1941, new projects included improvements to the central power plant, a new pattern storage building, a large
In 1969, the Navy transferred its (Vietnam War) Brown Water Navy Riverine Training Forces from Coronado, California, to Mare Island. Swift Boats (Patrol Craft Fast-PCF), and PBRs (Patrol Boat River), among other types of riverine craft, conducted boat operations throughout the currently named Napa-Sonoma Marshes State Wildlife Area, which are located on the north and west portions of Mare Island. Mare Island Naval Base was deactivated during the 1995 cycle of US base closures, but the US Navy Reserves still have access to the water portions of the State Wildlife Area for any riverine warfare training being conducted from their new base in Sacramento.
In 1996 Mare Island Naval Shipyard was closed.

Growth after World War II
After the war, hundreds of land developers bought land cheap, subdivided it, built on it, and made substantial profits from selling the land. Real estate development replaced oil and agriculture as southern California's principal industry. In 1955, Disneyland opened in Anaheim. In 1958, Major League Baseball's Dodgers and Giants left New York City and came to Los Angeles and San Francisco, respectively. The population of California expanded dramatically, to nearly 20 million by 1970. In response to population growth, and Cold War concerns, California established the 1960 Master Plan for Higher Education.
In the late 1960s the
California still was a land of free spirits, open hearts, and easy-going living. Popular music of the period bore titles such as "
The most famous hippie hangout was the Haight-Ashbury district of San Francisco. The state's cities, especially San Francisco, became famous for their gentility and tolerance. A distinctive and idyllic Californian culture emerged for a time. The peak of this culture, in 1967, was known as the Summer of Love. California became known elsewhere in the United States often derogatorily, as the "land of fruits and nuts".[citation needed]
California's growth after World War II was fueled in part by an arms race with the Soviets and the growing defense industry. In 1962, about 40 percent of the nation's 6-billion dollar military research contracts went into California for testing technology such as planes and bombs. Chuck Yeager was the first pilot to break the sound barrier at Edwards Air Force base. This launched the nation into the jet age and boosted confidence in new technology.[101]
California as an economic powerhouse
Conversely, during the same period, the Golden State also attracted commercial and industrial expansion at astronomical rates. The adoption of a Master Plan for Higher Education in 1960 allowed the development of a highly efficient system of public higher education in the community colleges and the University of California and California State University systems; by creating an educated workforce, it attracted investment, particularly in areas related to high technology. By 1980, California became recognized as the world's eighth-largest economy. Millions of workers were needed to fuel the expansion. The high population of the time caused tremendous problems with urban sprawl, traffic, pollution, and, to a lesser extent, crime.
The immense problem with
Traffic and transportation remain a problem in urban areas. Solutions are implemented, but inevitably the implementation expense and the time required to plan, approve, and build infrastructure can't keep pace with the population growth. There have been some improvements.
During the 1960s, under the aegis of Chief Justice Roger J. Traynor, the California Supreme Court became more liberal and progressive. Traynor's term as Chief Justice (from 1964 to 1970) was marked by a number of firsts: California was the first state to create true strict liability in product liability cases, the first to allow the action of negligent infliction of emotional distress (NIED) even in the absence of physical injury to the plaintiff, and the first to allow bystanders to sue for NIED where the only physical injury was to a relative.
Starting in the 1960s, California became a leader in family law. California was the first state to allow true no-fault divorce, with the passage of the Family Law Act of 1969. In 1994, the Legislature took family law out of the Civil Code and created a new Family Code. In 2002, the Legislature granted registered domestic partners the same rights under state law as married spouses. In 2008 California became the second state to legalize same-sex marriage when the California Supreme Court ruled the ban unconstitutional.
Since the mid-1980s, the California Supreme Court has become more conservative, particularly with regard to the rights of criminal defendants. This is commonly seen as a reaction against the strict anti-
High-tech expansion
Starting in the 1950s, high technology companies in northern California began a spectacular growth that continued through the end of the 20th century. The major products included personal computers, video games, and networking systems. The majority of these companies settled along a highway stretching from Palo Alto to San Jose, notably including Santa Clara and Sunnyvale, all in the Santa Clara Valley, the so-called "Silicon Valley", named after the material used to produce the integrated circuits of the era.
This era peaked in 2000, by which time demand for skilled technical professionals had become so high that the high-tech industry had trouble filling all of its positions and therefore pushed for increased visa quotas so that they could recruit from overseas. When the "
2000–present
Although air pollution problems have been reduced, health problems associated with pollution have continued. The brown haze that is known as "smog" has been substantially abated thanks to federal and state restrictions on automobile exhaust.[102][103] Wildfires have also been a major environmental concern, with the smoke resulting from these fires causing severe health problems, as well as severe climatological events such as Orange Skies Day.[104] Since 2000, the area that burned annually has ranged between 90,000 acres, or 0.09%, and 1,590,000 acres, or 1.59% of the total land of California.[105]
An
Housing bubble bursts
The ongoing demand for well-educated workers continued. Housing prices in urban areas continued to increase so that a modest home that in the 1960s cost $25,000, cost half a million dollars or more in urban areas by 2005. More people commuted longer hours to afford a home in more rural areas while earning larger salaries in the urban areas. Speculators bought houses they never intended to live in, expecting to make a huge profit in a matter of months, then rolling it over by buying more properties. Mortgage companies were compliant, as everyone assumed the prices would keep rising. The bubble burst in 2007-8 as housing prices began to crash and the boom years ended. Hundreds of billions in property values vanished and foreclosures soared as many financial institutions and investors were badly hurt.[107][108]
In the
Schwarzenegger began his shortened term with a soaring approval rating and soon after began implementing a conservative agenda. This initially resulted in sparring with the heavily Democratic Assembly and Senate over the state budget, battles which provided his infamous "girly men" comment but also began taking their toll on his approval rating. Schwarzenegger then embarked on a campaign to enact several ballot propositions in a 2005 special election touted as reforming California's budget system, redistricting powers, and union political fundraising. The union-led campaign spearheaded by the
Since this conspicuous failure, Schwarzenegger made a turn back to the left, criticizing the Bush Administration at many junctures, reviving his environmental agenda, and compromising with the legislature on the traditionally Democratic issue of education spending. His approval rating also revived, and he was re-elected in 2006. However, continued paralysis in state government and the inability of the legislature and governor to work out the fundamental funding questions resulted in voter disapproval of both the legislators and the governor, whose approval rating was among the lowest ever recorded pending the election of Jerry Brown in November 2010.[citation needed]
2011–2017 California drought

The
By February 2017, the state's drought percentage returned to lower levels seen before the start of the drought.[114] This change was due to an exceedingly wet pattern caused by atmospheric river-enhanced Pacific storms, which caused severe flooding.
In mid-March 2019, California was declared drought-free except for a small pocket of abnormally dry conditions in Southern California. This declaration followed a series of powerful Pacific storms during the first few months of the year, which coincided with the U.S. experiencing drought conditions in the fewest parts of the country since 2000.[115]
COVID-19 pandemic impact

One of the first confirmed COVID-19 cases in the United States that occurred in California was first of which was confirmed on January 26, 2020.
The COVID-19 pandemic in the United States has accelerated the continuing exodus of business from the entire downtown core of San Francisco.[124][125][126] Significantly high levels of crime, open-air drug use, homelessness, and closed storefronts have become more prominent features of Union Square.[127][further explanation needed]
SoFi Stadium
SoFi Stadium (/ˈsoʊfaɪ/ SOH-fy)[128] is a 70,240-seat sports and entertainment indoor-outdoor stadium in the Los Angeles suburb of Inglewood, California, United States. SoFi occupies the former site of the Hollywood Park Racetrack, 0.15 miles (0.24 km) southeast of Kia Forum and 0.2 miles (0.32 km) northwest of Intuit Dome, and 3 miles (4.8 km) from Los Angeles International Airport.
The stadium complex is a component of Hollywood Park, a master planned neighborhood in development on the site of the former racetrack. Hollywood Park Casino re-opened in a new building on the property in October 2016, becoming the development's first establishment to open.[129]
Opened in September 2020, the fixed-roof stadium is home to the National Football League (NFL)'s Los Angeles Rams and Los Angeles Chargers, as well as the annual LA Bowl in college football. SoFi Stadium is one of two stadiums currently shared by a pair of NFL teams, the other being MetLife Stadium in East Rutherford, New Jersey, shared by the New York Giants and New York Jets. It is the first stadium complex outside of the New York metropolitan area to host two NFL teams concurrently; the other three since the 1970 AFL–NFL merger have been Shea Stadium, Giants Stadium and MetLife Stadium.
In North American professional sports, it is the fourth stadium complex in Greater Los Angeles shared by more than one team from the same league. The other venues have been Crypto.com Arena, which has hosted both of the city's National Basketball Association (NBA) teams, the Los Angeles Lakers and Los Angeles Clippers, since 1999 (although this arrangement will end by 2024); Dignity Health Sports Park, which is home to Major League Soccer (MLS)'s LA Galaxy and the now-defunct Chivas USA from 2005 to 2014; and Dodger Stadium, which was shared by Major League Baseball (MLB)'s Los Angeles Dodgers and Los Angeles Angels from 1962 to 1965.
The stadium hosted Super Bowl LVI on February 13, 2022, the College Football Playoff National Championship on January 9, 2023, WrestleMania 39 on April 1–2, 2023, and the 2023 CONCACAF Gold Cup final on July 16, 2023. It is scheduled to host multiple matches of the 2026 FIFA World Cup,[130] Super Bowl LXI in 2027, and the opening and closing ceremonies (as well as soccer and archery events) of the 2028 Summer Olympics.
The NFL approved the Inglewood proposal and the Rams' relocation back to Los Angeles, 30–2, on January 12, 2016, over the rival proposal.
See also
- Bibliography of California history
- History of California before 1900
- History of California
- History of Los Angeles
- History of San Diego
- History of San Francisco
- History of the west coast of North America
References
- ISBN 978-0-30742-642-0.
- ^ "Resident Population Data". U.S. Census Bureau. 2010. Archived from the original on January 1, 2011.
- ^ a b 2011 Yearbook of Immigration Statistics (PDF). United States Department of Homeland Security. p. 5. Archived from the original (PDF) on October 18, 2014. Retrieved January 11, 2014.
- ^ "Historical Statistics of the United States, 1789–1945". U.S. Census Bureau. Archived from the original on December 29, 2004. Retrieved April 14, 2011.
- ^ "The Great 1906 San Francisco Earthquake". United States Geological Survey Earthquake Hazards Program. Archived from the original on January 2, 2016.
- ^ "Timeline of the San Francisco Earthquake April 18 – 23, 1906". The Virtual Museum of the City of San Francisco. Archived from the original on March 3, 2016.
- ^ "Where can I learn more about the 1906 Earthquake?". Berkeley Seismological Laboratory. Archived from the original on January 12, 2012.
- ^ "1906 Earthquake: What was the magnitude?". USGS Earthquake Hazards Program – Northern California. Archived from the original on September 26, 2006. Retrieved September 19, 2006.
- ^ Gibson, Christine (August 2006). "Our 10 Greatest Natural Disasters". American Heritage. Vol. 57, no. 4. Archived from the original on December 5, 2010.
- ^ "1906 Earthquake: How long was the 1906 Crack?". USGS Earthquake Hazards Program – Northern California. Archived from the original on February 9, 2006. Retrieved September 3, 2006.
- ^ "1906 San Francisco Quake: How large was the offset?". USGS Earthquake Hazards Program — Northern California. Archived from the original on April 8, 2006. Retrieved September 3, 2006.
- ^ Kim, Ryan (April 11, 2004). "Daly City / Officials unmoved by quake notoriety / Plan to note change of 1906 epicenter lacking support". San Francisco Chronicle.
- ISSN 0033-4553.
- ^ "Signal Corps and Communication". Presidio of San Francisco. Archived from the original on February 8, 2007.
- ^ Wildman, Capt. Leonard D. "Memorandum to the Military Secretary, dated April 27, 1906". Museum of the City of San Francisco.
- ^ a b "San Francisco Earthquake". Mega Disasters. Season 1. Episode 13. August 15, 2006. History Channel.
- ^ a b c d e f "Oil and Gas Production: History In California" (PDF). State of California. Archived from the original (PDF) on January 30, 2012. Retrieved January 11, 2014.
- ^ Hopkins, G. R. & Coons, A. B. (1934). "Crude petroleum and petroleum products". Statistical Appendix to Minerals Yearbook 1932–33. US Bureau of Mines. pp. 306–307.
- ^ Huguenin, E. (1945). "History of gas conservation in California". Summary of Operations, California Oil Fields. 31 (1). Sacramento: California Division of Oil and Gas.
- ^ "1969 Santa Barbara Oil Spill". University of California Santa Barbara, Department of Geography. Archived from the original on November 7, 2016. Retrieved January 12, 2014.
- ^ "The San Joaquin Valley Oil Industry". San Joaquin Valley Geology. Retrieved January 4, 2014.
- ^ "Rankings: Natural Gas Marketed Production, 2020 (million cu ft)". U.S. Energy Information Administration. Retrieved June 12, 2022.
- ^ "California Uses for Natural Gas" (PDF). The California Energy Almanac. Archived from the original (PDF) on January 13, 2014. Retrieved January 12, 2014.
- ^ S2CID 154947275.
- JSTOR 3636975.
- ISBN 978-0-80323-503-8.
- JSTOR 41169745.
- JSTOR 1899560.
- JSTOR 41171743.
- JSTOR 41170803.
- ^ Wallis, Eileen (June 2019). "Review of North, Diane M. T., California at War: The State and the People during World War I". H-Net Reviews.
- .
- ^ S2CID 144272424.
- ^ Taniguchi, Nancy J. (1995). "California's 'Anti-Okie' Law: An Interpretive Biography" (PDF). Western Legal History: The Journal of the Ninth Judicial Circuit Historical Society. 8 (2): 272–290.
- ^ Norris, Thomas D. (1989). "Southern Baptists and the 'Okie' Migration: A Sectarian Rebirth in California, 1930s–1940s". Locus. 2 (1): 35–47.
- ISBN 978-0-52024-888-5.
- JSTOR 25462394.
- ISBN 978-0-19504-423-2.
- JSTOR 41172008.
- ^ "Installed In-State Electric Generation Capacity by Fuel Type (MW)". The California Energy Almanac. Archived from the original on March 10, 2014. Retrieved March 10, 2014.
- ^ a b Complete Report on the Construction of the Los Angeles Aqueduct. Los Angeles Department of Public Service. 1916. p. 14.
- OL 23386153M.
- OL 23386153M.
- ^ "Construction Begins". Los Angeles Department of Water and Power. Archived from the original on June 16, 2012. Retrieved September 13, 2012.
- ^ "A Hundred or a Thousand Fold More Important". Los Angeles Department of Water and Power. Archived from the original on February 23, 2009. Retrieved February 7, 2009.
- The National Geographic Magazine. XXI (7): 568–596. Retrieved July 10, 2009. Includes construction photos.
- ^ "William Mulholland Biography". Water and Power Associates Inc.
- ^ Complete Report on the Construction of the Los Angeles Aqueduct. Los Angeles Department of Public Service. 1916. pp. 75–76.
- ^ Complete Report on the Construction of the Los Angeles Aqueduct. Los Angeles Department of Public Service. 1916. pp. 271.
- ^ The Second Los Angeles Aqueduct. Department of Water and Power, City of Los Angeles. 1971. p. xvii.
- ^ "The Owens Valley Is the Only Source". Los Angeles Department of Water and Power. Archived from the original on February 23, 2009. Retrieved February 7, 2009.
- ISBN 978-0-87046-093-7.
- ^ "Hetch Hetchy". San Francisco Water Power Sewer. Archived from the original on April 15, 2021. Retrieved May 23, 2013.
- ^ Stene, Eric A. (1996). "Trinity Division: Central Valley Project" (PDF). U.S. Bureau of Reclamation. Archived from the original (PDF) on September 25, 2012. Retrieved February 12, 2012.
- ^ "Shasta/Trinity River Division Project". U.S. Bureau of Reclamation. April 21, 2011. Archived from the original on February 22, 2013. Retrieved February 12, 2012.
- ^ "Dams Owned and Operated by Federal Agencies" (PDF). California Department of Water Resources, Division of Safety of Dams. Archived from the original (PDF) on October 5, 2012. Retrieved January 2, 2013.
- ^ Patricia132 (July 26, 2011). "Photos of Pardee Dam Lake and Spillway". Photoblog.com. Archived from the original on April 7, 2014. Retrieved March 18, 2014.
{{cite web}}: CS1 maint: numeric names: authors list (link) - ^ "History". East Bay Municipal Utility District. Archived from the original on January 1, 2014. Retrieved January 16, 2014.
- ^ DWR Public Affairs Office (2005). "State Water Project Today". Department of Water Resources, State of California. Archived from the original on June 10, 2007. Retrieved March 19, 2009.
- ^ "Edmonston Pumping Plant". Center for Land Use Interpretation. 2009. Archived from the original on July 24, 2008. Retrieved March 19, 2009.
- ^ "California State Water Project Today". California Department of Water Resources. July 18, 2008. Archived from the original on September 1, 2010. Retrieved September 12, 2013.
- ^ Meier, Fred. The California State Water Project (PDF). University of California, Los Angeles. Archived from the original (PDF) on October 17, 2013. Retrieved October 17, 2013.
- ^ Quinton, Amy (October 7, 2013). "California's Water Supply, a 700 Mile Journey". Capital Public Radio. Retrieved October 15, 2013.
- ^ "History of the State Water Project". State Water Contractors. Archived from the original on October 16, 2013. Retrieved October 18, 2013.
- ^ "The Big Water Projects in California". California Water Impact Network. Archived from the original on October 1, 2013. Retrieved October 15, 2013.
- ^ a b Zetland, David (August 5, 2009). "Colorado River Aqueduct" (PDF). kysq.org. Archived from the original (PDF) on July 27, 2011. Retrieved November 20, 2010.
- ^ "California Municipal Wastewater Recycling Survey 2009". California State Water Resources Control Board. Retrieved April 3, 2014.
- ^ "State Water Board Approves $800 Million in Financial Incentives for Recycled Water Projects to Provide Drought Relief". State of California. March 19, 2014. Archived from the original on April 7, 2014. Retrieved April 3, 2014.
- ^ "About WRD: Mission and History". Water Replenishment District. Retrieved April 3, 2014.
- ^ "Engineering Survey & Report" (PDF). Water Replenishment District. March 2014. Archived from the original (PDF) on April 1, 2014. Retrieved April 3, 2014.
- ^ "Historical Information". Orange County Water District. Archived from the original on October 1, 2013. Retrieved April 3, 2014.
- ^ "$734 Million Carlsbad Desalination Project Financing Closes". San Diego County Water Authority. December 24, 2012. Archived from the original on April 7, 2014. Retrieved April 3, 2014.
- ^ San Diego County Water Authority (February 11, 2014). "Desalination Plant Construction Flyover". YouTube. Retrieved April 3, 2014.
- ^ "Parched California Pours Mega-Millions Into Desalination Tech". NBC News. February 17, 2014. Retrieved April 3, 2014.
- ^ "Daily Reservoir Storage Summary". California Department of Water Resources. Archived from the original on April 21, 2014. Retrieved April 3, 2014.
- ISBN 978-0806142647.
- ^ "Men or Money May Soon Fly". Los Angeles Times. November 16, 1909. pp. 11–14.
- ^ Hatfield, David (1976). Dominguez Air Meet, 1910. Inglewood, CA: Northrop University Press.
- ^ Onkst, David H. (c. 2002). "The First U.S. Airshows—the Air Meets of 1910". United States Centennial of Flight Commission. Archived from the original on May 9, 2008. Retrieved April 25, 2008.
- ^ "A Brief History of U.S. Navy Aircraft Carriers, Part I - The Early Years". U.S. Navy. Archived from the original on June 20, 2012. Retrieved February 14, 2014.
- ^ "Early History: Setting Down Stakes". JPL. Archived from the original on May 4, 2017.
- ^ ISBN 978-0-30002-408-1.
- ^ a b Conway, Erik M. (2007). "From Rockets to Spacecraft: Making JPL a Place for Planetary Science" (PDF). Engineering and Science. 30 (4): 2–10. Archived from the original on April 24, 2008.
- ^ ISBN 978-0-8131-2721-7.
- hdl:2014/39699.
- ^ Bello, Francis (1959). "The Early Space Age". Fortune. Archived from the original on November 3, 2013. Retrieved June 5, 2012.
- ^ Whalen, Mark; Murrill, Mary Beth (July 24, 1998). "JPL will establish Near-Earth Object Program Office for NASA". Jet Propulsion Laboratory. NASA. Archived from the original on October 1, 1999. Retrieved February 19, 2013.
- ^ "NASA scrambles for better asteroid detection". France 24. February 18, 2013. Archived from the original on April 10, 2013. Retrieved February 19, 2013.
- ISBN 978-0-9897906-0-4.
- ISBN 978-0-9897906-0-4.
- ^ "The First U.S. Aircraft Manufacturing Companies". Wings Over Kansas. October 1, 2006. Retrieved February 14, 2014.
- ^ Colton, Tim. "Ships built in U.S. in WWII". Shipbuilding History. Archived from the original on November 25, 2013. Retrieved February 12, 2012.
- ^ Colton, Tim. "Kaiser Permanente Yard #1". Shipbuilding History. Retrieved February 8, 2012.
- ^ Colton, Tim. "Kaiser Permanente Yard #2". Shipbuilding History. Retrieved February 8, 2012.
- ^ Colton, Tim. "Kaiser Permanente Yard #3". Shipbuilding History. Retrieved February 8, 2012.
- ^ Colton, Tim. "Kaiser Richmond No. 4". Shipbuilding History. Retrieved February 8, 2012.
- ^ Colton, Tim. "Kaiser, California Shipbuilding Los Angeles". Shipbuilding History. Retrieved February 8, 2012.
- Calisphere. Archived from the originalon January 13, 2014. Retrieved June 13, 2011.
- ^ a b "Permanente Metals Corporation - Kaiser Richmond CA Shipyards". San Pedro, California. Archived from the original on August 29, 2013. Retrieved February 12, 2012.
- ^ "Map of Kaiser-Permanente Yard #1, #2". San Pedro, California. Archived from the original on February 13, 2012. Retrieved February 12, 2012.
- OCLC 879642525.
- ISBN 978-0-82294-254-2.
- ISBN 978-0-52003-204-0.
- ^ "Wildfire Smoke and Health". California Air Resources Board. Retrieved March 24, 2023.
- ^ "California Wildfire Emission Estimates | California Air Resources Board". ww2.arb.ca.gov. Retrieved August 24, 2020.
- JSTOR 2696582.
- ISBN 978-0-31338-228-4.
- ISBN 978-0-87586-738-0.
- ^ Boxall, Bettina (April 7, 2017). "Gov. Brown declares California drought emergency is over". Los Angeles Times
- ^ Ellen Hanak; Jeffrey Mount; Caitrin Chappelle (January 2015). "California's Latest Drought". PPIC.
- ^ "California's Long Drought Has Killed 100 Million Trees". Live Sciences. December 7, 2016.
- ^ "The Extraordinary California Drought of 2013/14: Character, Context, and the Role of Climate Change" (PDF). Archived from the original (PDF) on April 17, 2015. Retrieved May 13, 2019.
- .
- ^ "New report: Drought finally over in nearly every part of California". Mercurynews.com. February 23, 2017. Retrieved December 17, 2017.
- Cable News Network. Retrieved May 6, 2019.
- ^ Wheeler, Ian (February 4, 2020). "Orange County coronavirus patient released, in good condition, health officials say". Orange County Register. Archived from the original on February 5, 2020. Retrieved February 21, 2020.
- ^ "Ninth case of fast-moving coronavirus confirmed in U.S." Reuters. February 2, 2020. Archived from the original on February 3, 2020. Retrieved February 3, 2020.
- ^ a b Beech, Eric; Gorman, Steve (February 6, 2020). "Two more U.S. evacuation planes leave coronavirus epicenter Wuhan". Reuters. Archived from the original on February 16, 2020. Retrieved February 15, 2020.
- ISSN 0190-8286. Retrieved February 25, 2021.
- ^ "Hundreds of Americans Were Evacuated From the Coronavirus Epicenter. Now Comes the Wait". The New York Times. February 5, 2020. Archived from the original on February 6, 2020.
- ^ "California Governor Gavin Newsom terminates state of emergency". Office of the Governor of the State of California. February 28, 2023. Retrieved October 11, 2023.
- ^ "California Governor Gavin Newsom lifts virus stay-at-home orders". CBS News. January 26, 2021. Archived from the original on January 26, 2021. Retrieved February 24, 2021.
- ^ Money, Luke; Luna, Taryn. "California aims to fully reopen its economy June 15". Retrieved April 6, 2021.
- ^ San Francisco Chronicle Editorial Board (August 21, 2022). "Downtown San Francisco is dying. This bill could help save it". San Francisco Chronicle. Retrieved December 17, 2022.
- ^ Roland Li (August 13, 2022). "New York is roaring back from the worst of the pandemic. Why isn't San Francisco?". San Francisco Chronicle. Retrieved February 24, 2023.
- ^ Conor Dougherty; Emma Goldberg (December 17, 2022). "What Comes Next for the Most Empty Downtown in America". The New York Times. Retrieved December 17, 2022.
On any given week in San Francisco, office buildings are at about 40 percent of their prepandemic occupancy.
- ^ Sam Mauhay-Moore (October 21, 2023). "Walgreens in San Francisco's Union Square to close by next month". Hearst Corporation. Retrieved October 22, 2023.
The store's closure follows that of several retail establishments around Union Square, including Express, Anthropologie, Gap and CB2.
- ^ "So-Fie Or So-Fee? Future Home Of The Rams, Chargers Gets A Name". CBS News. September 15, 2019. Retrieved July 31, 2022.
- ^ "Hollywood Park Casino's Grand Opening Oct. 21 - Poker News". CardPlayer.com. Retrieved January 12, 2017.
- ^ "FIFA unveils stellar line-up of FIFA World Cup 2026™ Host Cities". FIFA.
- ^ Logan, Tim; Fenno, Nathan (January 13, 2016). "NFL will return to Los Angeles for 2016 season". Los Angeles Times. Retrieved November 10, 2016.
- ^ Michaud, Stephanie (July 14, 2016). "Two companies selected to oversee $1.9 billion construction of Rams stadium". MyNewsLA. Retrieved November 10, 2016.
- ^ Fenno, Nathan (October 19, 2016). "Excavation for the Rams' stadium could begin in just weeks". Los Angeles Times. Retrieved November 10, 2016.
- ^ Florio, Mike (December 12, 2016). "FAA Declines to Allow Cranes at Inglewood Construction Site". NBC Sports. Retrieved January 12, 2017.
- ^ Bott, Michael (August 26, 2016). "LAX INGL Update". KNTV. San Francisco. Retrieved January 12, 2017.
- ^ Fenno, Nathan; Farmer, Sam (November 10, 2016). "Rams to Break Ground on Inglewood Stadium Next Week, Source Says". Los Angeles Times. Retrieved May 19, 2017.
- ^ Gonzalez, Alden (November 11, 2016). "Rams to Break Ground on $2.6 Billion Inglewood Stadium Thursday". ESPN. Retrieved May 19, 2017.
- ^ Fenno, Nathan (December 23, 2016). "FAA Approves First Cranes for New Rams Stadium". Los Angeles Times. Retrieved January 12, 2017.
Bibliography
Scholarly surveys
- Aron, Stephen. "Convergence, California and the Newest Western History," California History Volume: 86#4 September 2009. pp 4+ historiography.
- Bakken, Gordon Morris. California History: A Topical Approach (2003)
- Cherney, Robert W., Richard Griswold del Castillo, and Gretchen Lemke-Santangelo. Competing Visions: A History of California (2005)
- Deverell, William, and David Igler, eds. A Companion to California History (2008), long essays by scholars; excerpt and text search
- Glass, Fred. From Mission to Microchip: A History of the California Labor Movement (U of California Press, 2016). xviii, 524 pp.
- Hart, James D. A Companion to California (2nd ed. 1987), 591 pp; encyclopedia of state history
- Hayes, Derek. Historical Atlas of California: With Original Maps (2007), 256pp
- North, Diane M.T. California at War: The State and the People during World War I (2018).
- Pitt, Leonard, and Dale Pitt. Los Angeles A to Z: An Encyclopedia of the City and County (2000)
- Rawls, James J. ed. New Directions in California History: A Book of Readings (1988)
- Rawls, James; Bean, Walton (2003). California: An Interpretive History (8th ed.). ISBN 0-07-052411-4.
- Rice, Richard B., William A. Bullough, and Richard J. Orsi. Elusive Eden: A New History of California 3rd ed. (2001)
- Rolle, Andrew F. California: A History 6th ed. (2003)
- Starr, Kevin (Note that there are numerous editions of this monumental state history, with slight title changes)
- Starr, Kevin California: A History (2005), one-volume synthesis
- Americans and the California Dream, 1850–1915 (1973)
- Inventing the Dream: California through the Progressive Era (1986)
- Material Dreams: Southern California through the 1920s (1991)
- Endangered Dreams: The Great Depression in California (1997)
- The Dream Endures: California Enters the 1940s (1997)
- Embattled Dreams: California in War and Peace, 1940–1950 (2003)
- Coast of Dreams: California on the Edge, 1990–2003 (2004)
- Sucheng, Chan, and Spencer C. Olin, eds. Major Problems in California History (1996)
Environment, transportation, agriculture, water
- Blow, Ben (1920). California Highways: A Descriptive Record of Road Development by the State and by Such Counties as Have Paved Highways. San Francisco, CA: H.S. Crocker.
- Carle, David. Introduction to Water in California (2004). 261 pp.
- Deverell, William and Hise, Greg, eds. Land of Sunshine: An Environmental History of Metropolitan Los Angeles. U. of Pittsburgh Press, 2005. 350 pp. excerpt and online search
- Deverell, William. Railroad Crossing: Californians and the Railroad, 1850–1910 (1994). 278 pp.
- Godfrey, Anthony. The Ever-Changing View: A History of the National Forests in California. US Forest Service, 2005. 657 pp.
- Griggs, Gary; Patsch, Kiki; and Savoy, Lauret, eds. Living with the Changing California Coast (2005). 540 pp.
- Howe & Peters (1921). "III. Engineering Report to the California State Automobile Association". The State Highways of California (Report). Los Angeles, CA: Times Mirror Printing & Binding House.
- Hundley Jr., Norris. The Great Thirst: Californians and Water—A History (2nd ed. 2001) excerpt and text search
- Isenberg, Andrew C. Mining California: An Ecological History (2005). 242 pp.
- Jelinek, Lawrence. Harvest Empire: A History of California Agriculture (1982)
- Merchant, Carolyn, ed. Green Versus Gold: Sources in California's Environmental History (1998). Readings in primary and secondary sources; excerpt and text search
- Pincetl, Stephanie S. Transforming California: A Political History of Land Use and Development (2003) excerpt and text search
- Righter, Robert W. The Battle over Hetch Hetchy: America's Most Controversial Dam and the Birth of Modern Environmentalism (2005). 303 pp.
- Sackman, Douglas Cazaux. Orange Empire: California and the Fruits of Eden (2005). 386 pp.
- Street, Richard Steven. Beasts of the Field: A Narrative History of California Farmworkers, 1769–1913 (2004). 904 pp.
- Thompson, Gregory Lee. The Passenger Train in the Motor Age: California's Rail and Bus Industries, 1910–1941 (1993). 247 pp.
- Vogel, David. California Greenin’: How the Golden State Became an Environmental Leader (2018) 280 pp online review
Scholarly specialty studies
- Abelmann, Nancy, and John Lie. Blue Dreams: Korean Americans and the Los Angeles Riots (1995)
- Aron, Stephen. "Convergence, California and the Newest Western History," California History Vol. 86#4, September 2009. pp 4+ historiography.
- Bell, Jonathan. "Social Democracy and the Rise of the Democratic Party in California, 1950–1964." Historical Journal 49.2 (2006): 497–524. online
- Fogelson, Robert M. The Fragmented Metropolis: Los Angeles, 1850–1930 (1993)
- Gavin, Francis J. (April 3, 2023). "How 1970s California created the modern world". Engelsberg Ideas. The Axel and Margaret Ax:son Johnson Foundation for Public Benefit. Retrieved April 6, 2023.
- Higgins, Andrew Stone. Higher Education for All: Racial Inequality, Cold War Liberalism, and the California Master Plan. University of North Carolina Press, 2023.
- Miller, Sally M., and Daniel A. Cornford, eds. American Labor in the Era of World War II (1995). Essays by scholars, mostly on California
- Roger W. Lotchin. Fortress California, 1910–1961 (2002)
- George E. Mowry. The California Progressives (1963)
- Sackman, Douglas Cazaux. Orange Empire: California and the Fruits of Eden. (2005) comprehensive, multidimensional history of citrus industry
- Pincetl, Stephanie S. Transforming California: A Political History of Land Use and Development (2003)
- Sitton, Tom and William F, Deverell, eds. Metropolis in the Making: Los Angeles in the 1920s (2001)
- Swiontek, Danielle Jean. With Ballots and Pocketbooks: Women, Labor, and Reform in Progressive California (2006)
- Westwick, Peter J., ed. Blue Sky Metropolis: The Aerospace Century in Southern California (U of California Press; 2012) 308 pages; essays by scholars
External links
- The California Historical Society
- California Museum
- Computer History Museum
- California Route 66 Museum