
IPCC Third Assessment Report
The IPCC Third Assessment Report (TAR), Climate Change 2001, is an assessment of available scientific and socio-economic information on climate change by the
"Robust findings" of the Synthesis Report include:
- "Observations show Earth's surface is warming. Globally, 1990s very likely warmest decade in instrumental record".[8] Atmospheric concentrations of anthropogenic (i.e., human-emitted) greenhouse gases have increased substantially.[8]
- Since the mid-20th century, most of the observed warming is "likely" (greater than 66% probability, based on expert judgement)[5] due to human activities.[8]
- Projections based on the Special Report on Emissions Scenarios suggest warming over the 21st century at a more rapid rate than that experienced for at least the last 10,000 years.[8]
- "Projected climate change will have beneficial and adverse effects on both environmental and socioeconomic systems, but the larger the changes and the rate of change in climate, the more the adverse effects predominate."[8]
- "Ecosystems and species are vulnerable to climate change and other stresses (as illustrated by observed impacts of recent regional temperature changes) and some will be irreversibly damaged or lost."[8]
- "Greenhouse gas emission reduction (mitigation) actions would lessen the pressures on natural and human systems from climate change."[8]
- "sea level rise.[9]
Working groups
| Intergovernmental Panel on Climate Change |
|---|
The IPCC was established in 1988 by the United Nations Environment Programme (UNEP) and the UN's World Meteorological Organization (WMO) "... to assess scientific, technical and socio-economic information relevant for the understanding of climate change, its potential impacts and options for adaptation and mitigation."[10] The IPCC is organized as three working groups (WG) and a task force [1]:
- WGI: Scientific aspects of climate (see IPCC TAR WG1 2001).
- WGII: Vulnerability, consequences, and options (see IPCC TAR WG2 2001).
- WGIII: Limitation and mitigation options (see IPCC TAR WG3 2001).
- Task Force: National Greenhouse Gas Inventories Programme [2]
WG I covers the same areas as the Second Assessment Report (
Conclusions
Working Group I
The key conclusions of Working Group I[11] were:
- An increasing body of observations gives a collective picture of a warming world and other changes in the climate system (The global average surface temperature has increased over the 20th century by about 0.6 °C; Temperatures have risen during the past four decades in the lowest 8 kilometres of the atmosphere; Snow cover and ice extent have decreased)
- Emissions of greenhouse gases and aerosols due to human activities continue to alter the atmosphere in ways that are expected to affect the climate (Anthropogenic aerosols (i.e., human emitted aerosols) are short-lived and mostly produce negative radiative forcing; Natural factors have made small contributions to radiative forcing over the past century)
- Confidence in the ability of models to project future climate has increased (Complex physically based climate models are required to provide detailed estimates of feedbacks and of regional features. Such models cannot yet simulate all aspects of climate (e.g., they still cannot account fully for the observed trend in the surface-troposphere temperature difference since 1979) and there are particular uncertainties associated with clouds and their interaction with radiation and aerosols. Nevertheless, confidence in the ability of these models to provide useful projections of future climate has improved due to their demonstrated performance on a range of space and time-scales [3] Archived 2007-06-01 at the Wayback Machine.)
- There is new and stronger evidence that most of the warming observed over the last 50 years is attributable to human activities
- Human influences will continue to change atmospheric composition throughout the 21st century
- Global average temperature and sea level are projected to rise under all IPCC SRES scenarios.
The TAR estimate for the climate sensitivity is 1.5 to 4.5 °C; and the average surface temperature is projected to increase by 1.4 to 5.8 Celsius degrees over the period 1990 to 2100, and the sea level is projected to rise by 0.1 to 0.9 metres over the same period. The wide range in projections is based upon several different scenarios that assume different levels of future CO2 emissions (see the section below on Projections in the TAR).
Synthesis Report
The TAR Synthesis Report includes a summary of the TAR's main findings and uncertainties.[12] "Robust findings" of the TAR include:[12]
- Observed warming of the Earth's surface, attribution of observed warming to human activities, sea levels, and increased frequency of heat waves.
- Future warming will have both beneficial and adverse effects, but for higher levels of warming, adverse effects will predominate.
- Developing countries and poor persons are most vulnerable to climate change.
"Key uncertainties" in the TAR include:[12]
- Estimated climate climate feedbacks, which may amplify or reduce the magnitude of future climate change;
- Assigning probabilities to projections of changes in sea level and temperature, as well as uncertainties related to regional projections of climate change.
List of greenhouse gases
The following tables are adapted from Chapter 6 of the Working Group 1 report.[13]
Gases relevant to radiative forcing only
| Gas | Alternate name | Formula | 1998 level | Increase since 1750 | Radiative forcing (Wm−2) | Specific heat at STP
(J kg−1) |
|---|---|---|---|---|---|---|
| Carbon dioxide | Carbon Dioxide | (CO2) | 365 μmol/mol | 87 μmol/mol | 1.46 | 0.819 |
| Methane | Marsh gas | (CH4) | 1,745 nmol/mol | 1,045 nmol/mol | 0.48 | 2.191 |
| Nitrous oxide | Laughing gas | (N2O) | 314 nmol/mol | 44 nmol/mol | 0.15 | 0.88 |
Tetrafluoromethane
|
Carbon tetrafluoride | (CF4) | 80 pmol/mol | 40 pmol/mol | 0.003 | 1.33 |
| Hexafluoroethane | Perfluoroethane | (C2F6) | 3 pmol/mol | 3 pmol/mol | 0.001 | 0.067 |
| Sulfur hexafluoride | Sulfur fluoride | (SF6) | 4.2 pmol/mol | 4.2 pmol/mol | 0.002 | 0.074 |
| HFC-23 | Trifluoromethane | (CHF3) | 14 pmol/mol | 14 pmol/mol | 0.002 | 0.064 |
| HFC-134a | 1,1,1,2-Tetrafluoroethane | C2H2F4 | 7.5 pmol/mol | 7.5 pmol/mol | 0.001 | 0.007 |
HFC-152a
|
1,1-Difluoroethane | (C2H4F2) | 0.5 pmol/mol | 0.5 pmol/mol | 0.000 | 0.04 |
Gases relevant to radiative forcing and ozone depletion
| Gas | Alternate name | Formula | 1998 level | Increase since 1750 | Radiative forcing
(Wm−2) |
|---|---|---|---|---|---|
| CFC-11§ | Trichlorofluoromethane | (CFCl3) | 268 pmol/mol | 268 pmol/mol | 0.07 |
| CFC-12§ | Dichlorodifluoromethane | (CF2Cl2) | 533 pmol/mol | 533 pmol/mol | 0.17 |
| CFC-13§ | Chlorotrifluoromethane | (CClF3) | 4 pmol/mol | 4 pmol/mol | 0.001 |
| CFC-113 | 1,1,1-Trichlorotrifluoroethane | (C2F3Cl3) | 84 pmol/mol | 84 pmol/mol | 0.03 |
| CFC-114 | 1,2-Dichlorotetrafluoroethane | (C2F4Cl2) | 15 pmol/mol | 15 pmol/mol | 0.005 |
CFC-115
|
Chloropentafluoroethane | (C2F5Cl) | 7 pmol/mol | 7 pmol/mol | 0.001 |
| Carbon tetrachloride | Tetrachloromethane | (CCl4) | 102 pmol/mol | 102 pmol/mol | 0.01 |
| 1,1,1-Trichloroethane | Methyl chloroform | (CH3CCl3) | 69 pmol/mol | 69 pmol/mol | 0.004 |
HCFC-141b
|
1,1-Dichloro-1-fluoroethane | (C2H3FCl2) | 10 pmol/mol | 10 pmol/mol | 0.001 |
HCFC-142b
|
1-Chloro-1,1-difluoroethane | (C2H3F2Cl) | 11 pmol/mol | 11 pmol/mol | 0.002 |
| Halon-1211 | Bromochlorodifluoromethane | (CClF2Br) | 3.8 pmol/mol | 3.8 pmol/mol | 0.001 |
| Halon-1301 | Bromotrifluoromethane | (CF3Br) | 2.5 pmol/mol | 2.5 pmol/mol | 0.001 |
Projections
Projections are used in the TAR as a guide to the possible future effects of climate change, e.g., changes in global mean temperature and sea level.[14] In the TAR, the word "projection" is favoured over "prediction".[15] This is because many future changes related to climate are highly uncertain.[16] For example, climate change projections are affected by highly uncertain changes in future GHG emissions.[17]
The TAR projects impacts according to possible future changes in global mean temperature.[18] Other projections are based on scenarios that the IPCC has developed.[14] In 2000,[19] the IPCC published 40 different scenarios[20] (the "SRES" scenarios) which contain estimates of future changes in anthropogenic emissions of greenhouse gases and aerosols. The SRES scenarios project a wide range of possible changes in future social and economic development,[20] and projected climate change impacts vary according to the scenario considered.[21] The IPCC has not assigned probabilities to the 40 SRES scenarios.[21] Some authors[22][23] have argued that some SRES scenarios are more likely to occur than others.
Scientific opinion
The IPCC is backed by the scientific community.[24] For example, a joint statement of support was issued in May 2001 by the science academies of Australia, Belgium, Brazil, Canada, the Caribbean, China, France, Germany, India, Indonesia, Ireland, Italy, Malaysia, New Zealand, Sweden and the UK. It states: "We recognise the IPCC as the world's most reliable source of information on climate change and its causes, and we endorse its method of achieving consensus."[24]
In 2001, the executive branch of the
US NRC (2001)[28] emphasise the need for governments to have a good understanding of uncertainties in climate change science. The example cited by US NRC (2001)[28] is the uncertainty over future changes in GHG emissions, which may be less or more than that projected by the TAR. US NRC (2001)[28] also state:
The most valuable contribution U.S. scientists can make is to continually question basic assumptions and conclusions, promote clear and careful appraisal and presentation of the uncertainties about climate change as well as those areas in which science is leading to robust conclusions, and work toward a significant improvement in the ability to project the future.
Reception
Endorsements
In 2001, 16 national science academies issued a joint statement on climate change.[29] The joint statement was made by the
In 2001, the
IPCC author
IPCC author Kevin Trenberth has also commented on the WGI SPM.[40] Trenberth has stated that during the drafting of the WGI SPM, some government delegations attempted to "blunt, and perhaps obfuscate, the messages in the report".[40] However, Trenberth concludes that the SPM is a "reasonably balanced summary".[40]
US NRC (2001)[41] concluded that the WGI SPM and Technical Summary are "consistent" with the full WGI report. US NRC (2001)[36] stated:
... the full [WGI] report is adequately summarized in the Technical Summary. The full WGI report and its Technical Summary are not specifically directed at policy. The Summary for Policymakers reflects less emphasis on communicating the basis for uncertainty and a stronger emphasis on areas of major concern associated with human-induced climate change. This change in emphasis appears to be the result of a summary process in which scientists work with policy makers on the document. Written responses from U.S. coordinating and lead scientific authors to the committee indicate, however, that (a) no changes were made without the consent of the convening lead authors (this group represents a fraction of the lead and contributing authors) and (b) most changes that did occur lacked significant impact.
IPCC process
There are a small number of climate scientists[42][43] who disagree with aspects of the IPCC's work. Perhaps the best known is Richard Lindzen,[42] professor of meteorology at the Massachusetts Institute of Technology.
A report by the
The
Discussion of the "hockey stick" graph
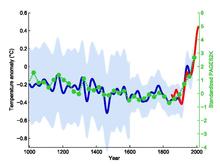


The third assessment report (TAR) prominently featured
These studies were widely presented as demonstrating that the current warming period is exceptional in comparison to temperatures between 1000 and 1900, and the MBH99 based graph featured in publicity. Even at the draft stage, this finding was disputed by contrarians: in May 2000
On 23 June 2005, Rep.
Sea level rise predictions
An example of scientific research which suggests that previous estimates by the IPCC, far from overstating dangers and risks, have actually understated them is a study on projected rises in sea levels. When the researchers' analysis was "applied to the possible scenarios outlined by the Intergovernmental Panel on Climate Change (IPCC), the researchers found that in 2100 sea levels would be 0.5–1.4 m [50–140 cm] above 1990 levels. These values are much greater than the 9–88 cm as projected by the IPCC itself in its Third Assessment Report, published in 2001". This may have been due, in part, to the expanding human understanding of climate.[58][59] Greg Holland from the National Center for Atmospheric Research, who reviewed a multi-meter sea level rise study by Jim Hansen, noted "There is no doubt that the sea level rise, within the IPCC, is a very conservative number, so the truth lies somewhere between IPCC and Jim."[60]
See also
- Attribution of recent climate change
- Avoiding Dangerous Climate Change, an international conference on the topic
- Climate change
- Carbon dioxide equivalent
- Effects of global warming
- Energy conservation
- Energy policy
- Global warming controversy
- Global climate model
- World energy resources and consumption
References
- ^ TAR Working Group 1 Archived 2021-12-28 at the Wayback Machine, IPCC.
- ^ TAR Working Group 2 Archived 2016-05-14 at the Wayback Machine, IPCC.
- ^ TAR Working Group 3 Archived 2017-02-27 at the Wayback Machine, IPCC.
- ^ TAR Synthesis Report Archived 2021-08-14 at the Wayback Machine, IPCC.
- ^ a b "Question 2" (PDF), Box 2-1: Confidence and likelihood statements, archived (PDF) from the original on 28 July 2021, retrieved 12 August 2021, in IPCC TAR SYR 2001 Q2 p 44
- ^ Ahmad, Q.K.; et al., "Ch 2: Methods and Tools" (PDF), Sec. 2.6.2. "Objective" and "Subjective" Probabilities are not Always Explicitly Distinguished, archived (PDF) from the original on 8 August 2021, retrieved 12 August 2021, in IPCC TAR WG2 2001 Ch 2 p 129
- ^ Granger Morgan, M.; et al. (2009), Synthesis and Assessment Product 5.2: Best practice approaches for characterizing, communicating, and incorporating scientific uncertainty in decisionmaking. A Report by the U.S. Climate Change Science Program (CCSP) and the Subcommittee on Global Change Research (PDF), Washington D.C.: National Oceanic and Atmospheric Administration, archived from the original (PDF) on 16 June 2013, pp. 19–20, 27–28. Report website. Archived 11 December 2009 at the Wayback Machine
- ^ ISBN 0-521-80770-0. Archivedfrom the original on 2021-08-14. Retrieved 2021-08-12.
- ^ Nicholls, R.J.; et al., "Ch 6: Coastal Systems and Low-Lying Areas" (PDF), Table 6.11, archived (PDF) from the original on 2021-08-08, retrieved 2021-08-12, in IPCC AR4 WG2 2007 Ch 6-1 p 343}}
- ^ IPCC website Archived 2017-09-15 at the Wayback Machine&
- ^ The Scientific Basis, Summary for Policymakers Archived 2016-03-07 at the Wayback Machine, in IPCC TAR WG1 2001
- ^ a b c "Summary for Policymakers", Climate Change 2001: Synthesis Report, Question 9, in IPCC TAR SYR 2001
- ^ "Chapter 6". TAR Climate Change 2001: The Scientific Basis. p. 358.
- ^ a b Summary for Policymakers, Question 3, in IPCC TAR SYR 2001
- ^ Ahmad, Q.K.; et al., 2. Methods and Tools, 2.6.1. Treatments of Uncertainties in Previous IPCC Assessments, in IPCC TAR WG2 2001
- ^ Annex B. Glossary of Terms, Definitions of "climate projection" and "projection", in IPCC TAR SYR 2001
- ^ Question 3, Box 3-1, in IPCC TAR SYR 2001
- ^ 19. Vulnerability to Climate Change and Reasons for Concern: A Synthesis, 19.8.2. What does Each Reason for Concern Indicate?, in IPCC TAR WG2 2001
- ^ Morita, T.; et al., 2. Greenhouse Gas Emission Mitigation Scenarios and Implications, 2.5.1.1 IPCC Emissions Scenarios and the SRES Process, p.143 in IPCC TAR WG3 2001
- ^ a b Morita, T.; et al., 2. Greenhouse Gas Emission Mitigation Scenarios and Implications, 2.5.1.2 SRES Approach to Scenario Development, pp.143-144 in IPCC TAR WG3 2001
- ^ a b Summary for Policymakers - Figure SPM-3, in IPCC TAR SYR 2001
- (PDF) from the original on 2013-06-01. Retrieved 2012-02-14.
- ^ Tol, R.S.J. (15 January 2005), Economic Affairs - Minutes of Evidence (Tuesday 1 February 2005), Memorandum by Professor Richard S J Tol, Hamburg, Vrije and Carnegie Mellon Universities, archived from the original on 29 October 2016, retrieved 31 August 2017, in Economic Affairs Committee 2005
- ^ a b Royal Society (13 April 2005), Economic Affairs – Written Evidence, Letter from The Royal Society: A GUIDE TO FACTS AND FICTIONS ABOUT CLIMATE CHANGE: Misleading arguments: The IPCC has become too politicised and does not accurately reflect the wide range of views within the scientific community. The IPCC summary for policy-makers does not adequately represent the scientific uncertainty., in Economic Affairs Committee 2005. This document is also available in PDF format Archived 2010-02-10 at the Wayback Machine
- ^ Foreword, p.VII, in US NRC 2001
- ^ a b Summary, p.1, in US NRC 2001
- ^ Summary, p.3, in US NRC 2001
- ^ a b c 7 Assessing Progress in Climate Science, pp.22-23, in US NRC 2001
- ^ ISBN 978-0854035588, archived from the original(PDF) on 19 April 2015
- S2CID 129309907
- ^ "CFCAS Letter to PM, November 25, 2005" (PDF). Archived from the original (PDF) on 21 August 2010. Retrieved 9 August 2019.
- ^ Bob Jones. "CMOS Position Statement on Global Warming". Cmos.ca. Archived from the original on 9 May 2012. Retrieved 25 June 2012.
- ^ European Geosciences Union Divisions of Atmospheric and Climate Sciences (7 July 2005). "Position Statement on Climate Change and Recent Letters from the Chairman of the U.S. House of Representatives Committee on Energy and Commerce". Archived from the original on 29 June 2017. Retrieved 12 August 2021.
- ^ US NRC 2001
- , p. 1
- ^ , p. 4
- ^ a b c Lindzen, R.S. (1 May 2001), Prepared Statement of Dr. Richard S. Lindzen, Massachusetts Institute of Technology, in: S. Hrg. 107-1027 – Intergovernmental Panel on Climate Change (IPCC) Third Assessment Report. US Senate Committee on Commerce, Science and Transportation, Washington, DC: US Government Printing Office (GPO), archived from the original on 5 October 2018, retrieved 12 August 2021, pp. 29–31. Available in text Archived 2018-10-05 at the Wayback Machine and PDF Archived 2017-07-07 at the Wayback Machine formats. Also available as a PDF Archived 2020-06-02 at the Wayback Machine from Professor Lindzen's website.
- ^ Preface (PDF), archived (PDF) from the original on 29 August 2022, retrieved 12 August 2021, in |IPCC TAR WGI 2001
- ^ a b The Great Global Warming Swindle. Programme directed by Martin Durkin, on Channel 4 on Thursday 8 March 2007. Critique by John Houghton, President, John Ray Initiative (PDF), Cheltenham, Gloucestershire, UK: John Ray Initiative, archived from the original (PDF) on 5 August 2019, retrieved 12 August 2021, p. 4.
- ^ a b c Trenberth K. E. (May 2001), "Stronger Evidence of Human Influence on Climate: The 2001 IPCC Assessment" (PDF), Environment, vol. 43, no. 4, Heldref, archived (PDF) from the original on 2021-06-13, retrieved 2021-08-12, p. 11.
- ISBN 978-0-309-07574-9, archived from the original on 2012-02-25, retrieved 2012-02-14, in US NRC 2001, p. 22
- ^ a b King, D. (24 February 2005), "Economic Affairs - Minutes of Evidence (Tuesday 1 March 2005)", Economic Affairs - Minutes of Evidence, Memorandum by Professor Sir David King, Chief Scientific Adviser to the UK Government: THE CLIMATE CHANGE SCEPTICS, archived from the original on 29 October 2016, retrieved 31 August 2017, in Economic Affairs Committee 2005
- ^ Economic Affairs - Minutes of Evidence, 18 January 2005, Examination of Witnesses: Sir John Houghton's reply to Q45, in Economic Affairs Committee 2005
- ^ a b Economic Affairs Committee 2005
- ^ Ch. 4: Forecasting greenhouse gas emissions and Temperature Change, archived from the original on 2016-10-29, retrieved 2017-08-31, in Economic Affairs Committee 2005
- ^ Ch. 7: the IPCC Process: The policy-makers' summaries, paragraphs 112-114, archived from the original on 2016-10-29, retrieved 2017-08-31, in Economic Affairs Committee 2005
- ^ UK Government 2005
- ^ Appendix: Response to paragraphs 111 and 114 of the Report, archived from the original on 2010-10-15, retrieved 2017-08-31, in UK Government 2005, pp. 19–20
- ^ e.g.: Appendix: Response to paragraph 32 of the Report, archived from the original on 2010-10-15, retrieved 2017-08-31, in UK Government 2005, pp. 8–9
- ^ S2CID 129606908. Archived from the original(PDF) on 2015-10-14. Retrieved 2021-08-12. p. 36
- ^ "Climate Change 2001: The Scientific Basis" (PDF). Archived from the original (PDF) on 2013-01-13. Retrieved 2021-08-12.
- ^ Houghton; Ding; Griggs; Noguer; van der Linden; Dai; Maskell; Johnson (2001). "2.3.2.2 Multi-proxy synthesis of recent temperature change". Climate change 2001: the scientific basis. Archived from the original on 4 June 2011.
- (PDF) from the original on 19 January 2011. Retrieved 31 October 2013.
- ^ Weart 2011, footnote 48,(p. 19, n1 in pdf).
- ^ Jansen & Overpeck 2007: 466
- ^ "Hunting Witches". July 22, 2005. Archived from the original on July 24, 2008. Retrieved August 12, 2021.
- PMID 16900179.
- ^ "Sea level rise 'under-estimated'". BBC News. 14 December 2006. Archived from the original on 12 July 2007. Retrieved 24 July 2007.
- Telegraph.co.uk. Archived from the originalon 17 May 2007. Retrieved 24 July 2007.
- ^ "James Hansen's controversial sea level rise paper has now been published online". Washington Post. 2015. Archived from the original on 2019-11-26. Retrieved 2022-10-27.
Sources
The Third Assessment Report consists of the following reports from each of the three Working Groups, and a Synthesis Report. On-line text and PDFs are available at
- Economic Affairs Committee (2005), The Economics of Climate Change, the Second Report of the 2005–2006 session, produced by the UK Parliament House of Lords Economics Affairs Select Committee, London, UK: The Stationery Office Ltd., by order of the House of Lords
- ISBN 0-521-80767-0, archived from the original on 2019-12-15, retrieved 2019-12-18).
{{citation}}: CS1 maint: numeric names: authors list (link) (pb: 0-521-01495-6 - ISBN 0-521-80768-9, archived from the original on 2016-05-14, retrieved 2019-12-18).
{{citation}}: CS1 maint: numeric names: authors list (link) (pb: 0-521-01500-6 - ISBN 0-521-80769-7, archived from the original on 2017-02-27).
{{citation}}: CS1 maint: numeric names: authors list (link) (pb: 0-521-01502-2 - ISBN 0-521-80770-0, archived from the original on 2018-11-03, retrieved 2011-09-15 (pb: 0-521-01507-3).
- Jansen; Overpeck (2007). "6 Palaeoclimate". Climate Change 2007: The Physical Science Basis. Contribution of Working Group I to the Fourth Assessment Report of the Intergovernmental Panel on Climate Change (PDF). K.R. Briffa, J.-C. Duplessy, F. Joos, V. Masson-Delmotte, D. Olago, B. Otto-Bliesner, W.R. Peltier, S. Rahmstorf, R. Ramesh, D. Raynaud, D. Rind, O. Solomina, R. Villalba and D. Zhang [Solomon, S., D. Qin, M. Manning, Z. Chen, M. Marquis, K.B. Averyt, M. Tignor and H.L. Miller (eds.)]. Cambridge University Press.
- UK Government (28 November 2005), 3rd Report of the 2005–2006 session: Government Response to the Economics of Climate Change (the 2nd Report of the 2005–2006 session, produced by the UK Parliament House of Lords Economics Affairs Select Committee), London, UK: The Stationery Office Ltd. Also available as a high-resolution PDF.
- US NRC (2001), Climate Change Science: An Analysis of Some Key Questions. A report produced by the Committee on the Science of Climate Change, US National Research Council (US NRC), Washington, D.C., USA: National Academy Press, ISBN 978-0-309-07574-9
- Weart, Spencer (December 2011). "International Cooperation: Democracy and Policy Advice (1980s)". The Discovery of Global Warming. American Institute of Physics. Archived from the original on 9 November 2013. Retrieved 9 July 2012.
- Jones, P. D.; Briffa, K. R.; Barnett, T. P.; Tett, S. F. B. (May 1998). "High-resolution palaeoclimatic records for the last millennium: interpretation, integration and comparison with General Circulation Model control-run temperatures". The Holocene. 8 (4): 455–471. S2CID 2227769.
- Crowley, Thomas J.; Lowery, Thomas S. (February 2000), "How Warm Was the Medieval Warm Period?", Ambio: A Journal of the Human Environment, 29 (1): 51–54, S2CID 86527510.
- Mann, Michael E.; Bradley, Raymond S.; Hughes, Malcolm K. (15 March 1999). "Northern hemisphere temperatures during the past millennium: Inferences, uncertainties, and limitations". Geophysical Research Letters. 26 (6): 759–762. .
- PAGES 2k Consortium (21 April 2013), "Continental-scale temperature variability during the past two millennia" (PDF), Nature Geoscience, 6 (5): 339–346, doi:10.1038/ngeo1797) (78 researchers, corresponding author Darrell S. Kaufman).
{{citation}}: CS1 maint: numeric names: authors list (link - Pollack, H. N.; Huang, S.; Shen, P.Y. (9 October 1998), "Climate Change Record in Subsurface Temperatures: A Global Perspective", Science, 282 (5387): 279–281, PMID 9765150
- Briffa, Keith R (2000). "Annual climate variability in the Holocene: interpreting the message of ancient trees". Quaternary Science Reviews. 19 (1–5): 87–105. .
- Wahl, Eugene R.; Ammann, Caspar M. (4 October 2007). "Robustness of the Mann, Bradley, Hughes reconstruction of Northern Hemisphere surface temperatures: Examination of criticisms based on the nature and processing of proxy climate evidence". Climatic Change. 85 (1–2): 33–69. S2CID 18640802.