
Inland Northwest
Inland Northwest | |
|---|---|
.jpg)       Left-right from top: North Idaho | |
| Largest metropolitan areas | |
| Dialect | Pacific Northwest English |

The Inland Northwest, historically and alternatively known as the Inland Empire, is a region of the
As of 2016[update], the
There have been several proposals to politically unite the Inland Northwest. In the mid and late 1860s, there was a proposal centered on Lewiston in northern Idaho for a Columbia Territory to be formed in the region from parts of what is now eastern Washington, northern Idaho and western Montana.[2] In 1901, another proposal was made, this time to combine the Idaho Panhandle with Eastern Washington to create the State of Lincoln. A third proposal was popularized in the late 1920s to consist of eastern Washington, northern Idaho and western Montana to the Continental Divide.
Counties
- Washington
- Adams, Asotin, Benton, Chelan, Columbia, Douglas, Ferry, Franklin, Garfield, Grant, Kittitas, Klickitat, Lincoln, Okanogan, Pend Oreille, Spokane, Stevens, Walla Walla, Whitman, and Yakima
- Idaho
- Benewah, Bonner, Boundary, Clearwater, Idaho, Kootenai, Latah, Lewis, Nez Perce, and Shoshone
Oregon (often included)
Montana (sometimes included; never included as part of the Inland Empire)
Geography
The region is bounded by the
Climate
The
| Climate data for Spokane (Spokane Int'l), 1991–2020 normals,[i] extremes 1881–present[ii] | |||||||||||||
|---|---|---|---|---|---|---|---|---|---|---|---|---|---|
| Month | Jan | Feb | Mar | Apr | May | Jun | Jul | Aug | Sep | Oct | Nov | Dec | Year |
| Record high °F (°C) | 62 (17) |
63 (17) |
74 (23) |
90 (32) |
97 (36) |
109 (43) |
108 (42) |
108 (42) |
98 (37) |
87 (31) |
70 (21) |
60 (16) |
109 (43) |
| Mean maximum °F (°C) | 48.2 (9.0) |
51.1 (10.6) |
63.0 (17.2) |
73.9 (23.3) |
84.0 (28.9) |
90.5 (32.5) |
97.5 (36.4) |
97.0 (36.1) |
89.2 (31.8) |
74.6 (23.7) |
56.4 (13.6) |
48.0 (8.9) |
99.1 (37.3) |
| Mean daily maximum °F (°C) | 34.5 (1.4) |
39.5 (4.2) |
48.6 (9.2) |
56.9 (13.8) |
67.1 (19.5) |
73.7 (23.2) |
84.4 (29.1) |
83.8 (28.8) |
73.6 (23.1) |
57.7 (14.3) |
42.3 (5.7) |
33.8 (1.0) |
58.0 (14.4) |
| Daily mean °F (°C) | 29.6 (−1.3) |
32.9 (0.5) |
40.0 (4.4) |
47.0 (8.3) |
56.0 (13.3) |
62.3 (16.8) |
71.0 (21.7) |
70.3 (21.3) |
61.1 (16.2) |
47.9 (8.8) |
36.3 (2.4) |
29.1 (−1.6) |
48.6 (9.2) |
| Mean daily minimum °F (°C) | 24.7 (−4.1) |
26.3 (−3.2) |
31.5 (−0.3) |
37.0 (2.8) |
44.9 (7.2) |
50.8 (10.4) |
57.6 (14.2) |
56.7 (13.7) |
48.6 (9.2) |
38.0 (3.3) |
30.3 (−0.9) |
24.3 (−4.3) |
39.2 (4.0) |
| Mean minimum °F (°C) | 4.4 (−15.3) |
9.8 (−12.3) |
18.5 (−7.5) |
26.4 (−3.1) |
32.7 (0.4) |
40.2 (4.6) |
45.9 (7.7) |
45.6 (7.6) |
35.4 (1.9) |
23.2 (−4.9) |
14.1 (−9.9) |
7.1 (−13.8) |
−3.0 (−19.4) |
| Record low °F (°C) | −30 (−34) |
−24 (−31) |
−10 (−23) |
14 (−10) |
24 (−4) |
33 (1) |
37 (3) |
35 (2) |
22 (−6) |
7 (−14) |
−21 (−29) |
−25 (−32) |
−30 (−34) |
| Average precipitation inches (mm) | 1.97 (50) |
1.44 (37) |
1.83 (46) |
1.25 (32) |
1.55 (39) |
1.17 (30) |
0.42 (11) |
0.47 (12) |
0.58 (15) |
1.37 (35) |
2.06 (52) |
2.34 (59) |
16.45 (418) |
| Average snowfall inches (cm) | 12.3 (31) |
7.8 (20) |
3.9 (9.9) |
0.7 (1.8) |
0.1 (0.25) |
0.0 (0.0) |
0.0 (0.0) |
0.0 (0.0) |
0.1 (0.25) |
0.5 (1.3) |
6.2 (16) |
13.8 (35) |
45.4 (115) |
| Average precipitation days (≥ 0.01 in) | 14.2 | 10.9 | 11.8 | 10.3 | 9.7 | 7.8 | 4.0 | 3.2 | 4.7 | 8.9 | 13.4 | 13.8 | 112.7 |
| Average snowy days (≥ 0.1 in) | 9.5 | 5.7 | 4.0 | 1.0 | 0.3 | 0.0 | 0.0 | 0.0 | 0.1 | 0.3 | 4.3 | 9.5 | 34.7 |
| Average relative humidity (%)
|
82.5 | 79.1 | 70.3 | 61.0 | 58.2 | 53.9 | 44.0 | 45.0 | 53.9 | 66.6 | 82.7 | 85.5 | 65.2 |
| Mean monthly sunshine hours | 78.3 | 118.0 | 199.3 | 242.3 | 296.7 | 322.8 | 382.4 | 340.4 | 271.2 | 191.0 | 73.8 | 59.1 | 2,575.3 |
| Percent possible sunshine | 28 | 41 | 54 | 59 | 63 | 68 | 79 | 77 | 72 | 57 | 26 | 22 | 54 |
| Source: NOAA (relative humidity and sun 1961–1990)[5][6][7] | |||||||||||||
| Climate data for Kennewick, Washington, 1991–2020 normals, extremes 1894–present | |||||||||||||
|---|---|---|---|---|---|---|---|---|---|---|---|---|---|
| Month | Jan | Feb | Mar | Apr | May | Jun | Jul | Aug | Sep | Oct | Nov | Dec | Year |
| Record high °F (°C) | 74 (23) |
74 (23) |
87 (31) |
95 (35) |
104 (40) |
114 (46) |
115 (46) |
115 (46) |
100 (38) |
89 (32) |
79 (26) |
72 (22) |
115 (46) |
| Mean maximum °F (°C) | 59.5 (15.3) |
61.8 (16.6) |
70.8 (21.6) |
81.5 (27.5) |
91.4 (33.0) |
97.9 (36.6) |
103.4 (39.7) |
102.1 (38.9) |
92.9 (33.8) |
80.1 (26.7) |
68.1 (20.1) |
59.8 (15.4) |
104.4 (40.2) |
| Mean daily maximum °F (°C) | 41.7 (5.4) |
48.1 (8.9) |
58.1 (14.5) |
66.3 (19.1) |
75.3 (24.1) |
82.0 (27.8) |
91.3 (32.9) |
90.3 (32.4) |
80.5 (26.9) |
65.9 (18.8) |
50.9 (10.5) |
41.5 (5.3) |
66.0 (18.9) |
| Daily mean °F (°C) | 35.5 (1.9) |
39.5 (4.2) |
47.0 (8.3) |
54.3 (12.4) |
62.7 (17.1) |
69.2 (20.7) |
76.8 (24.9) |
75.8 (24.3) |
66.8 (19.3) |
54.5 (12.5) |
42.9 (6.1) |
35.6 (2.0) |
55.1 (12.8) |
| Mean daily minimum °F (°C) | 29.6 (−1.3) |
31.0 (−0.6) |
36.2 (2.3) |
42.5 (5.8) |
50.4 (10.2) |
56.7 (13.7) |
62.7 (17.1) |
61.6 (16.4) |
53.5 (11.9) |
43.4 (6.3) |
35.2 (1.8) |
30.0 (−1.1) |
44.4 (6.9) |
| Mean minimum °F (°C) | 15.3 (−9.3) |
18.8 (−7.3) |
26.1 (−3.3) |
33.5 (0.8) |
40.1 (4.5) |
48.4 (9.1) |
54.5 (12.5) |
53.3 (11.8) |
43.8 (6.6) |
30.7 (−0.7) |
22.5 (−5.3) |
16.8 (−8.4) |
10.0 (−12.2) |
| Record low °F (°C) | −27 (−33) |
−23 (−31) |
8 (−13) |
18 (−8) |
26 (−3) |
35 (2) |
38 (3) |
37 (3) |
21 (−6) |
14 (−10) |
−8 (−22) |
−29 (−34) |
−29 (−34) |
| Average precipitation inches (mm) | 1.13 (29) |
0.79 (20) |
0.66 (17) |
0.61 (15) |
0.81 (21) |
0.59 (15) |
0.20 (5.1) |
0.17 (4.3) |
0.26 (6.6) |
0.66 (17) |
0.86 (22) |
1.13 (29) |
7.87 (201) |
| Average snowfall inches (cm) | 1.3 (3.3) |
0.1 (0.25) |
0.0 (0.0) |
0.0 (0.0) |
0.0 (0.0) |
0.0 (0.0) |
0.0 (0.0) |
0.0 (0.0) |
0.0 (0.0) |
0.0 (0.0) |
0.4 (1.0) |
0.4 (1.0) |
2.2 (5.55) |
| Average precipitation days (≥ 0.01 in) | 11.1 | 8.1 | 7.8 | 6.9 | 6.3 | 4.7 | 2.1 | 1.9 | 2.6 | 6.3 | 8.9 | 10.5 | 77.2 |
| Average snowy days (≥ 0.1 in) | 0.8 | 0.1 | 0.0 | 0.0 | 0.0 | 0.0 | 0.0 | 0.0 | 0.0 | 0.0 | 0.3 | 0.6 | 1.8 |
| Source 1: NOAA[8] | |||||||||||||
| Source 2: National Weather Service[9] | |||||||||||||
| Climate data for Yakima Airport, Washington (1991–2020 normals,[a] extremes 1946–present)
| |||||||||||||
|---|---|---|---|---|---|---|---|---|---|---|---|---|---|
| Month | Jan | Feb | Mar | Apr | May | Jun | Jul | Aug | Sep | Oct | Nov | Dec | Year |
| Record high °F (°C) | 68 (20) |
69 (21) |
80 (27) |
92 (33) |
102 (39) |
115 (46) |
109 (43) |
110 (43) |
100 (38) |
91 (33) |
73 (23) |
72 (22) |
115 (46) |
| Mean maximum °F (°C) | 54.6 (12.6) |
59.2 (15.1) |
68.9 (20.5) |
79.6 (26.4) |
89.9 (32.2) |
95.0 (35.0) |
100.2 (37.9) |
99.1 (37.3) |
91.2 (32.9) |
78.0 (25.6) |
64.0 (17.8) |
52.3 (11.3) |
101.8 (38.8) |
| Mean daily maximum °F (°C) | 39.5 (4.2) |
47.2 (8.4) |
56.6 (13.7) |
64.7 (18.2) |
74.1 (23.4) |
80.7 (27.1) |
89.9 (32.2) |
88.5 (31.4) |
79.4 (26.3) |
64.4 (18.0) |
48.9 (9.4) |
38.2 (3.4) |
64.3 (17.9) |
| Mean daily minimum °F (°C) | 24.0 (−4.4) |
26.1 (−3.3) |
30.2 (−1.0) |
35.2 (1.8) |
43.5 (6.4) |
49.5 (9.7) |
55.0 (12.8) |
53.3 (11.8) |
44.9 (7.2) |
35.3 (1.8) |
27.2 (−2.7) |
23.1 (−4.9) |
37.3 (2.9) |
| Mean minimum °F (°C) | 7.5 (−13.6) |
11.0 (−11.7) |
20.2 (−6.6) |
23.5 (−4.7) |
29.3 (−1.5) |
36.3 (2.4) |
41.9 (5.5) |
41.3 (5.2) |
32.5 (0.3) |
20.9 (−6.2) |
12.9 (−10.6) |
5.1 (−14.9) |
−1.6 (−18.7) |
| Record low °F (°C) | −21 (−29) |
−25 (−32) |
−1 (−18) |
18 (−8) |
25 (−4) |
30 (−1) |
34 (1) |
35 (2) |
24 (−4) |
4 (−16) |
−13 (−25) |
−17 (−27) |
−25 (−32) |
| Average precipitation inches (mm) | 1.19 (30) |
0.81 (21) |
0.64 (16) |
0.55 (14) |
0.74 (19) |
0.50 (13) |
0.20 (5.1) |
0.21 (5.3) |
0.23 (5.8) |
0.64 (16) |
0.86 (22) |
1.44 (37) |
8.01 (203) |
| Average snowfall inches (cm) | 6.2 (16) |
2.7 (6.9) |
0.6 (1.5) |
0 (0) |
0 (0) |
0 (0) |
0 (0) |
0 (0) |
0 (0) |
0.1 (0.25) |
3.0 (7.6) |
7.7 (20) |
20.3 (52) |
| Average precipitation days | 9.4 | 7.5 | 6.4 | 5.8 | 6.2 | 5.2 | 2.4 | 2.3 | 3.2 | 4.7 | 8.6 | 10.1 | 71.8 |
| Average snowy days | 4.3 | 2.2 | 0.7 | 0.1 | 0 | 0 | 0 | 0 | 0 | 0.1 | 1.8 | 6.2 | 15.4 |
| Mean monthly sunshine hours | 64 | 113 | 186 | 210 | 279 | 300 | 341 | 310 | 240 | 186 | 60 | 62 | 2,351 |
| Mean daily sunshine hours | 2 | 4 | 6 | 7 | 9 | 10 | 11 | 10 | 8 | 6 | 2 | 2 | 6 |
| Percent possible sunshine | 22 | 38 | 50 | 51 | 60 | 63 | 71 | 71 | 64 | 55 | 21 | 23 | 49 |
| Average ultraviolet index | 1 | 2 | 3 | 5 | 6 | 7 | 8 | 7 | 5 | 3 | 1 | 1 | 4 |
| Source 1: NOAA[10][11] | |||||||||||||
| Source 2: Weather Atlas (sun and uv)[12] | |||||||||||||
| Climate data for Wenatchee, (1971-2000 normals) | |||||||||||||
|---|---|---|---|---|---|---|---|---|---|---|---|---|---|
| Month | Jan | Feb | Mar | Apr | May | Jun | Jul | Aug | Sep | Oct | Nov | Dec | Year |
| Record high °F (°C) | 65 (18) |
66 (19) |
78 (26) |
93 (34) |
104 (40) |
114 (46) |
110 (43) |
106 (41) |
101 (38) |
90 (32) |
76 (24) |
67 (19) |
114 (46) |
| Mean daily maximum °F (°C) | 35.1 (1.7) |
42.8 (6.0) |
54.9 (12.7) |
64.6 (18.1) |
73.1 (22.8) |
80.1 (26.7) |
88.0 (31.1) |
88.0 (31.1) |
77.7 (25.4) |
63.7 (17.6) |
46.0 (7.8) |
35.7 (2.1) |
62.5 (16.9) |
| Daily mean °F (°C) | 29.2 (−1.6) |
35.1 (1.7) |
44.4 (6.9) |
52.7 (11.5) |
60.9 (16.1) |
67.8 (19.9) |
74.4 (23.6) |
73.7 (23.2) |
64.5 (18.1) |
52.3 (11.3) |
39.1 (3.9) |
30.5 (−0.8) |
52.1 (11.2) |
| Mean daily minimum °F (°C) | 23.2 (−4.9) |
27.4 (−2.6) |
33.9 (1.1) |
40.8 (4.9) |
48.6 (9.2) |
55.5 (13.1) |
61.0 (16.1) |
60.2 (15.7) |
51.2 (10.7) |
40.8 (4.9) |
32.2 (0.1) |
25.2 (−3.8) |
41.7 (5.4) |
| Record low °F (°C) | −17 (−27) |
−18 (−28) |
5 (−15) |
20 (−7) |
27 (−3) |
39 (4) |
40 (4) |
41 (5) |
21 (−6) |
19 (−7) |
0 (−18) |
−19 (−28) |
−19 (−28) |
| Average precipitation inches (mm) | 1.35 (34) |
0.94 (24) |
0.64 (16) |
0.51 (13) |
0.51 (13) |
0.69 (18) |
0.30 (7.6) |
0.41 (10) |
0.40 (10) |
0.49 (12) |
1.36 (35) |
1.52 (39) |
9.12 (231.6) |
| Source: NOAA (normals, 1971−2000) [13][14] | |||||||||||||
| Climate data for Missoula, Montana ( Missoula Airport )
| |||||||||||||
|---|---|---|---|---|---|---|---|---|---|---|---|---|---|
| Month | Jan | Feb | Mar | Apr | May | Jun | Jul | Aug | Sep | Oct | Nov | Dec | Year |
| Record high °F (°C) | 60 (16) |
66 (19) |
78 (26) |
90 (32) |
95 (35) |
102 (39) |
107 (42) |
105 (41) |
99 (37) |
85 (29) |
73 (23) |
60 (16) |
107 (42) |
| Mean daily maximum °F (°C) | 33.2 (0.7) |
38.8 (3.8) |
49.8 (9.9) |
58.5 (14.7) |
67.3 (19.6) |
75.2 (24.0) |
85.9 (29.9) |
84.9 (29.4) |
73.1 (22.8) |
57.8 (14.3) |
41.5 (5.3) |
31.0 (−0.6) |
58.2 (14.6) |
| Mean daily minimum °F (°C) | 18.3 (−7.6) |
21.2 (−6.0) |
27.7 (−2.4) |
32.8 (0.4) |
39.8 (4.3) |
46.6 (8.1) |
51.4 (10.8) |
50.1 (10.1) |
41.8 (5.4) |
32.4 (0.2) |
24.9 (−3.9) |
16.7 (−8.5) |
33.7 (0.9) |
| Record low °F (°C) | −33 (−36) |
−28 (−33) |
−13 (−25) |
2 (−17) |
21 (−6) |
26 (−3) |
31 (−1) |
29 (−2) |
15 (−9) |
−4 (−20) |
−23 (−31) |
−30 (−34) |
−33 (−36) |
| Average precipitation inches (mm) | 0.85 (22) |
0.70 (18) |
1.00 (25) |
1.22 (31) |
2.01 (51) |
2.07 (53) |
0.99 (25) |
1.19 (30) |
1.17 (30) |
0.88 (22) |
1.01 (26) |
1.04 (26) |
14.13 (359) |
| Average snowfall inches (cm) | 8.3 (21) |
6.1 (15) |
5.1 (13) |
1.2 (3.0) |
0.2 (0.51) |
— | 0.0 (0.0) |
0.0 (0.0) |
— | 0.6 (1.5) |
5.4 (14) |
11.0 (28) |
37.9 (96) |
| Average precipitation days (≥ 0.01 in) | 11.8 | 9.4 | 11.4 | 11.1 | 12.3 | 12.1 | 7.1 | 7.5 | 8.2 | 8.4 | 11.1 | 12.3 | 122.7 |
| Average snowy days (≥ 0.1 in) | 9.4 | 6.8 | 5.1 | 1.6 | 0.3 | 0.1 | 0.0 | 0.0 | 0.0 | 0.9 | 5.4 | 9.8 | 39.4 |
| Average relative humidity (%)
|
81.3 | 78.1 | 70.3 | 61.2 | 61.7 | 61.1 | 51.7 | 52.5 | 62.8 | 70.8 | 80.2 | 83.5 | 67.9 |
| Mean monthly sunshine hours | 95.8 | 133.0 | 209.3 | 245.0 | 280.5 | 311.1 | 389.3 | 334.8 | 264.7 | 194.3 | 99.5 | 82.9 | 2,640.2 |
| Percent possible sunshine | 34 | 46 | 57 | 60 | 60 | 66 | 81 | 76 | 70 | 58 | 35 | 31 | 59 |
| Source: NOAA (normals 1981−2010, relative humidity and sun 1961–1990)[15][16][17] | |||||||||||||
Demographics
Population Centers
The Inland Northwest is home to seven Metropolitan Statistical Areas (MSA), eight if Western Montana is included, as defined by the U.S. Census Bureau. The two largest centers of population are formed out of multiple neighboring MSAs that are classified as Combined Statistical Areas.[18] The largest in the region is the conurbation formed by the Spokane and Coeur d'Alene MSAs, the Spokane-Coeur d'Alene combined statistical area, which ranks 70th in the nation. The second largest center is the Kennewick-Richland-Walla Walla combined statistical area, which is made up of the Tri-Cities and Walla Walla and ranks as the 103rd largest in the nation.[19]
Statistical Areas
-
- Spokane-Spokane Valley MSA (pop. 593,466)[20]
- Coeur d'Alene MSA (pop. 179,789)[20]
- Kennewick-Richland-Walla Walla CSA (pop. 370,395)[21]
- Kennewick-Richland MSA (pop. 308,293)[21]
- Walla Walla MSA (pop. 62,682)[21]
- Yakima MSA (pop. 256,035)[18][22]
- * Missoula MSA (pop. 119,533)[18][24]
Largest Cities by Population
- Spokane, Washington (pop. 228,989)[26]
- Spokane Valley, Washington (pop. 102,976)[27]
- Yakima, Washington (pop. 96,968)[28]
- Kennewick, Washington (pop. 83,921)[29]
- Pasco, Washington (pop. 77,108)[30]
- *Missoula, Montana (pop. 73,489)[31]
- Richland, Washington (pop. 60,560)[32]
- Coeur d'Alene, Idaho (pop. 54,628)[33]
- Post Falls, Idaho (pop. 38,485)[34]
- Wenatchee, Washington (pop. 35,508)[35]
- Lewiston, Idaho (pop. 34,203)[36]
- Walla Walla, Washington (pop. 34,060)[37]
- Pullman, Washington (pop. 32,901)[38]
- Moscow, Idaho (pop. 25,435)[39]
- Moses Lake, Washington (pop. 25,146)[40]
- *Kalispell, Montana (pop. 24,558)[41]
- *Hermiston, Oregon (pop. 19,354)[42]
- Ellensburg, Washington (pop. 18,666)[43]
- *Pendleton, Oregon (pop. 17,107)[44]
- Sunnyside, Washington (pop. 16,375)[45]
- West Richland, Washington (pop. 16,295)[46]
- Hayden, Idaho (pop. 15,570)[47]
- East Wenatchee, Washington (pop. 14,158)[48]
- Cheney, Washington (pop. 13,255)[49]
- *La Grande, Oregon (pop. 13,026)[50]
- Liberty Lake, Washington (pop. 12,003)[51]
- Grandview, Washington (pop. 10,907)[52]
- Airway Heights, Washington (pop. 10,757)[53]
*Sometimes considered to be in the region
Economy
Agriculture dominates the economy across large swaths of the region.
Culture
Arts and theater
In Spokane, the Davenport Arts District has the largest concentration of art galleries and is home to many of Spokane's main performing arts venues, including the
In the Tri-Cities, the Richland Players Theater has offered live performances annually for over 70 years.[citation needed] Originally known as The Village Players, the theater group was created in 1944 to bring music, comedy, and cultural opportunities to the local community.[citation needed][64] Today, the theater has more than 7,500 attendees annually attracting audiences from across the region such as Spokane, Yakima, and Walla Walla.[citation needed] The theater also serves the local community by bringing local retirees to shows and accommodating the visually and hearing impaired (with the participation of non-profit United Blind).[65]
Sports
The Inland Northwest is home to the
Media
The Spokane area is served by
The Tri-Cities is served by the
Gallery
-
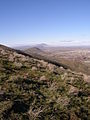 Hills near West Richland, Washington
 -
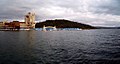 Coeur d'Alene
 -
 Latah Creek, a historical site
 -
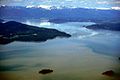 Lake Pend Oreille, 1,150 ft (350 m) deep
 -
 View from north of Lewiston, Idaho and Clarkston, Washington
 -
 Oregon Butte in the Wenaha–Tucannon Wilderness
 -
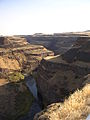 Palouse Canyon
 -

-

-

-
 The Palouse from Steptoe Butte
 -
 Selway–Bitterroot Wilderness, Idaho


See also
- Palouse
- Columbia Plateau (ecoregion)
- Inland Empire Highway
- Silver Valley, Idaho
- Lincoln (proposed Northwestern state)
- Appaloosa
- Okanagan Country
Notes
- ^ Mean monthly maxima and minima (i.e. the expected highest and lowest temperature readings at any point during the year or given month) calculated based on data at said location from 1991 to 2020.
- ^ Mean maxima and minima (i.e., the highest and lowest temperature readings during an entire month or year) calculated based on data at said location from 1991 to 2020.
- ^ Official records for Spokane kept at Spokane Weather Bureau Office from February 1881 to July 1889, and at Spokane International Airport since August 1889.[4]
References
- ISBN 0-87422-277-X
- ^ Merle W. Wells. "Territorial Government in the Inland Empire: The Movement to Create Columbia Territory, 1864-69." The Pacific Northwest Quarterly. Vol. 44, No. 2 (April 1953), pp. 80-87.
- ^ Woodward, Susan L. (2012–2015). "Inland Rainforests of the Northwest". Radford University. Retrieved May 4, 2021.
- ^ "Threaded Station Extremes". ThreadEx. NOAA's National Centers for Environmental Information (NCEI) and the National Weather Service (NWS), the Northeast Regional Climate Center (NRCC). Retrieved October 18, 2021.
- ^ "NowData – NOAA Online Weather Data". National Oceanic and Atmospheric Administration. Retrieved October 18, 2021.
- ^ "Summary of Monthly Normals SPOKANE INTL AP, WA US USW00024157 1991-2020". National Oceanic and Atmospheric Administration. Retrieved October 18, 2021.
- ^ "WMO climate normals for Spokane/INTL, WA 1961–1990". National Oceanic and Atmospheric Administration. Retrieved May 28, 2014.
- ^ "U.S. Climate Normals Quick Access". National Oceanic and Atmospheric Administration. Archived from the original on August 12, 2022. Retrieved August 4, 2022.
- ^ "NOAA Online Weather Data". National Weather Service. Archived from the original on May 30, 2022. Retrieved July 25, 2022.
- ^ "NOAA NCEI U.S. Climate Normals Quick Access". National Oceanic and Atmospheric Administration. Archived from the original on May 5, 2021. Retrieved August 6, 2021.
- ^ "Station Name: WA YAKIMA AIRPORT". National Oceanic and Atmospheric Administration. Retrieved September 8, 2019.
- ^ "Monthly weather forecast and climate - Yakima, WA". Archived from the original on March 28, 2020. Retrieved March 28, 2020.
- ^ "Climatography of the United States NO.81" (PDF). National Oceanic and Atmospheric Administration. May 2011. Archived from the original (PDF) on August 9, 2014. Retrieved January 11, 2011.
- ^ "Hundreds of deaths reported as cities urge residents to conserve power during ravaging heat wave". CNN. Retrieved June 30, 2021.
- ^ "NowData-NOAA Online Weather Data". National Oceanic and Atmospheric Administration (NOAA). Retrieved September 10, 2015.
- ^ "MT Missoula INTL AP". NOAA. Retrieved September 10, 2015.
- ^ "WMO Climate Normals for Missoula/Johnson–Bell Field, MT 1961–1990". NOAA. Retrieved September 10, 2015.
- ^ a b c d e f "Combined Statistical Areas of the United States and Puerto Rico" (PDF). census.gov. U.S. Census Bureau. Retrieved 30 April 2022.
- ^ "Kennewich-Richand-Walla Walla, WA CSA". censusreporter.org. Retrieved 30 April 2022.
- ^ a b c "QuickFacts". census.gov. U.S. Census Bureau. Retrieved 30 April 2022.
- ^ a b c "QuickFacts". census.gov. U.S. Census Bureau. Retrieved 30 April 2022.
- ^ "QuickFacts: Yakima County, Washington". census.gov. U.S. Census Bureau. Retrieved 30 April 2022.
- ^ "Quick Facts". census.gov. U.S. Census Bureau. Retrieved 30 April 2022.
- ^ "QuickFacts: Missoula County, Montana". census.gov. U.S. Census Bureau. Retrieved 30 April 2022.
- ^ "QuickFacts". census.gov. U.S. Census Bureau. Retrieved 30 April 2022.
- ^ "QuickFacts: Spokane city, Washington". census.gov. U.S. Census Bureau. Retrieved 29 April 2022.
- ^ "QuickFacts: Spokane Valley city, Washington". census.gov. U.S. Census Bureau. Retrieved 29 April 2022.
- ^ "QuickFacts: Yakima city, Washington". census.gov. U.S. Census Bureau. Retrieved 29 April 2022.
- ^ "QuickFacts: Kennewick city, Washington". census.gov. U.S. Census Bureau. Retrieved 29 April 2022.
- ^ "QuickFacts: Pasco city, Washington". census.gov. U.S. Census Bureau. Retrieved 30 April 2022.
- ^ "QuickFacts: Missoula city, Montana". census.gov. U.S. Census Bureau. Retrieved 29 April 2022.
- ^ "QuickFacts: Richland city, Washington". census.gov. U.S. Census Bureau. Retrieved 30 April 2022.
- ^ "QuickFacts: Coeur d'Alene city, Idaho". census.gov. U.S. Census Bureau. Retrieved 30 April 2022.
- ^ "QuickFacts: Post Falls city, Idaho". census.gov. U.S. Census Bureau. Retrieved 30 April 2022.
- ^ "QuickFacts: Wenatchee city, Washington". census.gov. U.S. Census Bureau. Retrieved 30 April 2022.
- ^ "QuickFacts: Lewiston city, Idaho". census.gov. U.S. Census Bureau. Retrieved 30 April 2022.
- ^ "QuickFacts: Walla Walla city, Washington". census.gov. U.S. Census Bureau. Retrieved 30 April 2022.
- ^ "QuickFacts: Pullman city, Washington". census.gov. U.S. Census Bureau. Retrieved 30 April 2022.
- ^ "QuickFacts: Moscow city, Idaho". census.gov. U.S. Census Bureau. Retrieved 30 April 2022.
- ^ "QuickFacts: Moses Lake city, Washington". census.gov. U.S. Census Bureau. Retrieved 30 April 2022.
- ^ "QuickFacts: Kalispell city, Montana". census.gov. U.S. Census Bureau. Retrieved 30 April 2022.
- ^ "QuickFacts: Hermiston city, Oregon". census.gov. U.S. Census Bureau. Retrieved 30 April 2022.
- ^ "QuickFacts: Ellensburg city, Washington". census.gov. U.S. Census Bureau. Retrieved 30 April 2022.
- ^ "QuickFacts: Pendleton city, Oregon". census.gov. U.S. Census Bureau. Retrieved 30 April 2022.
- ^ "QuickFacts: Sunnyside city, Washington". census.gov. U.S. Census Bureau. Retrieved 30 April 2022.
- ^ "QuickFacts: West Richland city, Washington". census.gov. U.S. Census Bureau. Retrieved 30 April 2022.
- ^ "QuickFacts: Hayden city, Idaho". census.gov. U.S. Census Bureau. Retrieved 30 April 2022.
- ^ "QuickFacts: East Wentachee city, Washington". census.gov. U.S. Census Bureau. Retrieved 30 April 2022.
- ^ "QuickFacts: Cheney city, Washington". census.gov. U.S. Census Bureau. Retrieved 30 April 2022.
- ^ "QuickFacts: La Grande city, Oregon". census.gov. U.S. Census Bureau. Retrieved 30 April 2022.
- ^ "QuickFacts: Liberty Lake city, Washington". census.gov. U.S. Census Bureau. Retrieved 30 April 2022.
- ^ "QuickFacts: Grandview city, Washington". census.gov. U.S. Census Bureau. Retrieved 30 April 2022.
- ^ "QuickFacts: Airway Heights city, Washington". census.gov. U.S. Census Bureau. Retrieved 30 April 2022.
- ^ "Communities of the Inland Northwest". ewu.edu. Eastern Washington University. Retrieved 17 October 2022.
- ^ St. George, Donna (24 September 1997). "National Origins: Washington-Idaho Border; America's Golden Land Of Lentils". New York Times. Retrieved 17 October 2022.
- ^ "Project details - Columbia Basin Project". United States Bureau of Reclamation. Archived from the original on 15 February 2015. Retrieved 25 October 2009.
- ISBN 0-9719258-5-2.
- ^ "United States Wine and Grape Industry FAQS". wineamerica.org. WineAmerica. Retrieved 17 October 2022.
- ^ "Regions & AVAs". washingtonwine.org. Washington State Wine Commission. Retrieved 17 October 2022.
- ^ Prager, Mike (October 29, 2017). "From a $2,500 start, the restored Fox theater was brought back from the brink". Spokesman-Review. Retrieved November 11, 2021.
- ^ Sowa, Tom (September 29, 2006). "Met Theater will be renamed to honor Bing Crosby". The Spokesman-Review. Retrieved October 13, 2014.
- ^ "Spokane Comedy Club". Spokane Comedy Club. Retrieved February 18, 2017.
- ^ "About Us". The Modern Theater. Retrieved January 24, 2014.
- ^ "Richland Players: Bringing great productions to the Tri-Cities". tri-cityherald.com. [dead link]
- ^ "Theater History". Archived from the original on May 25, 2014. Retrieved May 22, 2014.
- ^ a b "Nielsen DMA Rankings – Full List". lyonspr.com. Nielsen. Archived from the original on 12 April 2018. Retrieved 17 October 2022.
State of Idaho | |
|---|---|
Boise (capital) | |
| Topics | |
| Society | |
| Regions | |
| Larger cities | |
| Smaller cities | |
| Counties |
|