
Inyo County, California
County of Inyo | |
|---|---|
 Wildflowers blooming in Death Valley after a wet winter | |
 Seal | |
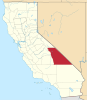
 Interactive map of Inyo County | |
 Location in the state of California | |
| Coordinates: 36°35′N 117°25′W / 36.583°N 117.417°W | |
| Country | |
| State | |
| Region | Eastern California |
| Established | March 22, 1866[1] |
| Named for | ɨnnɨyun 'it's dangerous' in Timbisha[2] |
| County seat | Independence |
| Largest city | Bishop |
| Government | |
| • Type | Council–CAO |
| • Body | Board of Supervisors |
| • Chair[4] | Jennifer Roeser |
| • Vice Chair[5] | Scott Marcellin |
| • Board of Supervisors | Supervisors[3]
|
| • County Administrator FIPS code | 06-027 |
| GNIS feature ID | 1804637 |
| Congressional district | 3rd |
| Website | www |
Inyo County (
History


Present-day Inyo county has been the
Inyo County was formed in 1866 out of the territory of the unorganized
For many years it has been commonly believed that the county derived its name from the Mono tribe's name for the mountains in its former homeland. Actually the name came to be thought of, mistakenly, as the name of the mountains to the east of the Owens Valley when the first whites there asked the local Owens Valley Paiutes for the name of the mountains to the east. They responded that that was the land of Inyo. They meant by this that those lands belonged to the Timbisha tribe headed by a man whose name was Inyo.[citation needed] Inyo was the name of the headman of one of the Timbisha bands at the time of contact when the first whites, the Bennett-Arcane Party of 1849, wandered, lost, into Death Valley on their expedition to the gold fields of western California. The Owens Valley whites misunderstood the reference and thought that Inyo was the name of the mountains when actually it was the name of the chief, or headman, of the tribe that had those mountains as part of their homeland.[citation needed] In Timbisha, ɨnnɨyun means "it's (or he's) dangerous".[2]
To supply the growing
Natural history
Inyo County is host to a number of natural superlatives. Among them are:
- Mount Whitney, with an elevation of 14,505 feet (4,421 m), the highest point in the contiguous United States, the 12th highest peak in the U.S., and the 24th highest peak in North America.
- Badwater Basin, in Death Valley, the lowest point in North America
- Methuselah, an ancient Bristlecone pine tree and one of the oldest living trees on Earth
- Owens Valley, the deepest valley on the American continents
- Two mountain ranges exceeding 14,000 feet (4,300 m) in elevation: The Sierra Nevada and the White Mountains
- Ten of California's twelve peaks which exceed 14,000 feet (a 14ersnot (at least partly) in Inyo County
- The largest escarpment in the United States, rising from the floor of Death Valley to the top of Telescope Peak in the Panamint Range

Geography
According to the
Lakes
National protected areas
There are 22 official
Except as noted, the wilderness areas are managed solely by the Bureau of Land Management and lie entirely within Inyo County:
- Argus Range Wilderness
- Coso Range Wilderness
- Darwin Falls Wilderness
- Death Valley Wilderness(part)
- Funeral Mountains Wilderness
- Golden Trout Wilderness (part)
- Ibex Wilderness
- Inyo Mountains Wilderness(part)
- John Muir Wilderness (part)
- Malpais Mesa Wilderness
- Manly Peak Wilderness
- Nopah Range Wilderness
- Owens Peak Wilderness (part)
- Pahrump Valley Wilderness(part)
- Piper Mountain Wilderness
- Resting Spring Range Wilderness
- Sacatar Trail Wilderness (part)
- Saddle Peak Hills Wilderness (part)
- South Nopah Range Wilderness
- South Sierra Wilderness (part)
- Surprise Canyon Wilderness
- Sylvania Mountains Wilderness
Death Valley National Park
Death Valley National Park is a mostly
It is the hottest and driest of the national parks in the United States. It also features the second-lowest point in the
Other parks
- Alabama Hills Recreation Area
- Last Chance Meadow Research Natural Area
- California Bighorn Sheep Zoological Area
Demographics
| Census | Pop. | Note | %± |
|---|---|---|---|
| 1870 | 1,956 | — | |
| 1880 | 2,928 | 49.7% | |
| 1890 | 3,544 | 21.0% | |
| 1900 | 4,377 | 23.5% | |
| 1910 | 6,974 | 59.3% | |
| 1920 | 7,031 | 0.8% | |
| 1930 | 6,555 | −6.8% | |
| 1940 | 7,625 | 16.3% | |
| 1950 | 11,658 | 52.9% | |
| 1960 | 11,684 | 0.2% | |
| 1970 | 15,571 | 33.3% | |
| 1980 | 17,895 | 14.9% | |
| 1990 | 18,281 | 2.2% | |
| 2000 | 17,945 | −1.8% | |
| 2010 | 18,546 | 3.3% | |
| 2020 | 19,016 | 2.5% | |
| 2023 (est.) | 18,527 | [15] | −2.6% |
| U.S. Decennial Census[16] 1790–1960[17] 1900–1990[18] 1990–2000[19] 2010[20] 2020[21] | |||
2020 census
| Race / Ethnicity | Pop 2010[20] | Pop 2020[21] | % 2010 | % 2020 |
|---|---|---|---|---|
White alone (NH)
|
12,296 | 11,035 | 66.30% | 58.03% |
Black or African American alone (NH)
|
102 | 85 | 0.55% | 0.45% |
Alaska Native alone (NH)
|
1,895 | 2,189 | 10.22% | 11.51% |
| Asian alone (NH) | 229 | 273 | 1.23% | 1.44% |
| Pacific Islander alone (NH) | 15 | 13 | 0.08% | 0.07% |
| Some Other Race alone (NH) | 21 | 87 | 0.11% | 0.46% |
| Mixed Race/Multi-Racial (NH) | 391 | 935 | 2.11% | 4.92% |
| Hispanic or Latino (any race) | 3,597 | 4,399 | 19.40% | 23.13% |
| Total | 18,546 | 19,016 | 100.00% | 100.00% |
Note: the US Census treats Hispanic/Latino as an ethnic category. This table excludes Latinos from the racial categories and assigns them to a separate category. Hispanics/Latinos can be of any race.
2011
| Population, race, and income | |||||
|---|---|---|---|---|---|
| Total population[22] | 18,457 | ||||
| White[22] | 14,339 | 77.7% | |||
| Black or African American[22] | 204 | 1.1% | |||
| American Indian or Alaska Native[22] | 1,846 | 10.0% | |||
| Asian[22] | 271 | 1.5% | |||
| Native Hawaiian or other Pacific Islander[22] | 66 | 0.4% | |||
| Some other race[22] | 1,374 | 7.4% | |||
| Two or more races[22] | 357 | 1.9% | |||
| Hispanic or Latino (of any race)[23] | 3,445 | 18.7% | |||
| Per capita income[24] | $27,532 | ||||
| Median household income[25] | $49,571 | ||||
| Median family income[26] | $68,204 | ||||
Places by population, race, and income
| Places by population and race | ||||||||
|---|---|---|---|---|---|---|---|---|
| Place | Type[27] | Population[22] | White[22] | Other[22] [note 1] |
Asian[22] | Black or African American[22] |
Native American[22] [note 2] |
Hispanic or Latino (of any race)[23] |
| Big Pine | CDP | 1,563 | 77.4% | 7.8% | 1.5% | 1.0% | 12.3% | 11.5% |
| Bishop | City |
3,839 | 78.5% | 17.6% | 2.6% | 0.1% | 1.2% | 31.2% |
| Cartago | CDP | 84 | 100.0% | 0.0% | 0.0% | 0.0% | 0.0% | 0.0% |
| Darwin | CDP | 32 | 100.0% | 0.0% | 0.0% | 0.0% | 0.0% | 0.0% |
| Dixon Lane-Meadow Creek | CDP | 2,800 | 86.1% | 11.3% | 0.0% | 0.0% | 2.5% | 23.0% |
| Furnace Creek | CDP | 115 | 79.1% | 0.0% | 0.0% | 0.0% | 20.9% | 8.7% |
| Homewood Canyon | CDP | 79 | 100.0% | 0.0% | 0.0% | 0.0% | 0.0% | 0.0% |
| Independence | CDP | 520 | 73.8% | 7.1% | 0.6% | 2.1% | 16.3% | 7.9% |
| Keeler | CDP | 88 | 100.0% | 0.0% | 0.0% | 0.0% | 0.0% | 0.0% |
| Lone Pine | CDP | 2,076 | 79.1% | 5.3% | 3.0% | 1.3% | 11.2% | 18.3% |
| Mesa | CDP | 442 | 77.4% | 17.0% | 5.7% | 0.0% | 0.0% | 16.1% |
| Olancha | CDP | 245 | 52.2% | 47.8% | 0.0% | 0.0% | 0.0% | 38.8% |
| Pearsonville | CDP | 6 | 100.0% | 0.0% | 0.0% | 0.0% | 0.0% | 0.0% |
| Round Valley | CDP | 396 | 87.4% | 4.5% | 0.5% | 0.0% | 7.6% | 14.6% |
| Shoshone | CDP | 36 | 94.4% | 0.0% | 0.0% | 0.0% | 5.6% | 8.3% |
| Tecopa | CDP | 98 | 100.0% | 0.0% | 0.0% | 0.0% | 0.0% | 5.1% |
| Trona | CDP | 0 | 0.0% | 0.0% | 0.0% | 0.0% | 0.0% | 0.0% |
| Valley Wells | CDP | 0 | 0.0% | 0.0% | 0.0% | 0.0% | 0.0% | 0.0% |
| West Bishop | CDP | 3,019 | 89.7% | 4.1% | 1.5% | 4.3% | 0.4% | 15.8% |
| Wilkerson | CDP | 484 | 100.0% | 0.0% | 0.0% | 0.0% | 0.0% | 0.0% |
| Places by population and income | |||||
|---|---|---|---|---|---|
| Place | Type[27] | Population[28] | Per capita income[24] | Median household income[25] | Median family income[26] |
| Big Pine | CDP | 1,563 | $28,276 | $63,269 | $75,500 |
| Bishop | City |
3,839 | $27,205 | $34,258 | $61,574 |
| Cartago | CDP | 84 | $37,211 | $44,293 | [29] |
| Darwin | CDP | 32 | $18,525 | $33,929 | [29] |
| Dixon Lane-Meadow Creek | CDP | 2,800 | $26,640 | $56,620 | $68,385 |
| Furnace Creek | CDP | 115 | $30,670 | $31,000 | $92,813 |
| Homewood Canyon | CDP | 79 | $5,525 | $15,347 | [29] |
| Independence | CDP | 520 | $26,418 | $43,750 | $64,044 |
| Keeler | CDP | 88 | $20,125 | $14,821 | $14,565 |
| Lone Pine | CDP | 2,076 | $20,995 | $35,938 | $48,214 |
| Mesa | CDP | 442 | $31,341 | $62,014 | $64,063 |
| Olancha | CDP | 245 | $20,648 | $37,250 | $102,802 |
| Pearsonville | CDP | 6 | [29] | [29] | [29] |
| Round Valley | CDP | 396 | $34,338 | $75,341 | $83,125 |
| Shoshone | CDP | 36 | $22,358 | $41,250 | $41,250 |
| Tecopa | CDP | 98 | $17,664 | $22,188 | $21,875 |
| Trona | CDP | 0 | [29] | [29] | [29] |
| Valley Wells | CDP | 0 | [29] | [29] | [29] |
| West Bishop | CDP | 3,019 | $33,802 | $79,219 | $95,208 |
| Wilkerson | CDP | 484 | $34,174 | $49,167 | $71,875 |
2010 Census
The
| Population reported at 2010 United States Census
| |||||||||
|---|---|---|---|---|---|---|---|---|---|
The County |
Total Population |
White |
African American |
Native American |
Asian |
Pacific Islander |
other races |
two or more races |
Latino (of any race) |
| Inyo County | 18,546 | 13,741 | 109 | 2,121 | 243 | 16 | 1,676 | 640 | 3,597 |
Incorporated city |
Total Population |
White |
African American |
Native American |
Asian |
Pacific Islander |
other races |
two or more races |
Latino (of any race) |
| Bishop | 3,879 | 2,867 | 22 | 91 | 61 | 1 | 723 | 114 | 1,200 |
Total Population |
White |
African American |
Native American |
Asian |
Pacific Islander |
other races |
two or more races |
Latino (of any race) | |
| Big Pine | 1,756 | 1,192 | 3 | 438 | 13 | 1 | 52 | 57 | 182 |
| Cartago | 92 | 63 | 0 | 7 | 0 | 0 | 11 | 11 | 16 |
| Darwin | 43 | 38 | 0 | 2 | 1 | 1 | 0 | 1 | 2 |
| Dixon Lane-Meadow Creek | 2,645 | 2,287 | 6 | 32 | 47 | 3 | 215 | 55 | 493 |
| Furnace Creek | 24 | 6 | 0 | 16 | 0 | 0 | 0 | 2 | 0 |
| Homewood Canyon | 44 | 37 | 0 | 0 | 0 | 0 | 5 | 2 | 6 |
| Independence | 669 | 493 | 6 | 98 | 8 | 1 | 28 | 35 | 93 |
| Keeler | 66 | 63 | 0 | 0 | 2 | 0 | 0 | 1 | 6 |
| Lone Pine | 2,035 | 1,334 | 6 | 205 | 17 | 1 | 376 | 96 | 694 |
| Mesa | 251 | 220 | 0 | 10 | 3 | 0 | 14 | 4 | 26 |
| Olancha | 192 | 133 | 0 | 4 | 8 | 0 | 38 | 9 | 47 |
| Pearsonville | 17 | 16 | 0 | 0 | 0 | 0 | 1 | 0 | 1 |
| Round Valley | 435 | 333 | 38 | 21 | 3 | 0 | 27 | 13 | 69 |
| Shoshone | 31 | 28 | 1 | 1 | 0 | 0 | 0 | 1 | 0 |
| Tecopa | 150 | 119 | 1 | 8 | 2 | 0 | 1 | 19 | 8 |
| Trona | 18 | 18 | 0 | 0 | 0 | 0 | 0 | 0 | 0 |
| Valley Wells | 0 | 0 | 0 | 0 | 0 | 0 | 0 | 0 | 0 |
| West Bishop | 2,607 | 2,373 | 10 | 28 | 45 | 1 | 72 | 78 | 261 |
| Wilkerson | 563 | 524 | 0 | 13 | 5 | 1 | 5 | 15 | 53 |
Other unincorporated areas |
Total Population |
White |
African American |
Native American |
Asian |
Pacific Islander |
other races |
two or more races |
Latino (of any race) |
| All others not CDPs (combined) | 3,029 | 1,597 | 16 | 1,147 | 28 | 6 | 108 | 127 | 440 |
2000
At the 2000
as their first language.There were 7,703 households, of which 27.9% had children under the age of 18 living with them, 49.8% were married couples living together, 9.9% had a female householder with no husband present, and 35.9% were non-families. 31.4% of all households were made up of individuals, and 13.6% had someone living alone who was 65 years of age or older. The average household size was 2.31 and the average family size was 2.88.
24.4% of the population were under the age of 18, 5.8% from 18 to 24, 23.4% from 25 to 44, 27.3% from 45 to 64, and 19.1% who were 65 years of age or older. The median age was 43 years. For every 100 females there were 95.4 males. For every 100 females age 18 and over, there were 92.9 males.
The
Politics
Voter registration
| Population and registered voters | ||
|---|---|---|
| Total population[22] | 18,457 | |
| Registered voters[32][note 3] | 9,922 | 53.8% |
| Democratic[32] | 3,066 | 30.9% |
| Republican[32] | 4,271 | 43.0% |
| Democratic–Republican spread[32] | -1,205 | -12.1% |
| American Independent[32] | 414 | 4.2% |
| Green[32] | 88 | 0.9% |
| Libertarian[32] | 79 | 0.8% |
| Peace and Freedom[32] | 29 | 0.3% |
| Americans Elect[32] | 0 | 0.0% |
| Other[32] | 46 | 0.5% |
| No party preference[32] | 1,929 | 19.4% |
Cities by population and voter registration
| Cities by population and voter registration | |||||||
|---|---|---|---|---|---|---|---|
| City | Population[22] | Registered voters[32] [note 3] |
Democratic[32] | Republican[32] | D–R spread[32] | Other[32] | No party preference[32] |
| Bishop | 3,839 | 42.9% | 31.4% | 40.3% | -8.9% | 10.4% | 21.7% |
Overview

Inyo has historically been a strongly
| Year | Republican | Democratic | Third party | |||
|---|---|---|---|---|---|---|
| No. | % | No. | % | No. | % | |
| 2020 | 4,620 | 48.71% | 4,634 | 48.86% | 230 | 2.43% |
| 2016 | 4,248 | 51.94% | 3,155 | 38.57% | 776 | 9.49% |
| 2012 | 4,340 | 54.01% | 3,422 | 42.58% | 274 | 3.41% |
| 2008 | 4,523 | 52.88% | 3,743 | 43.76% | 288 | 3.37% |
| 2004 | 5,091 | 59.09% | 3,350 | 38.88% | 175 | 2.03% |
| 2000 | 4,713 | 60.31% | 2,652 | 33.93% | 450 | 5.76% |
| 1996 | 3,924 | 51.84% | 2,601 | 34.36% | 1,044 | 13.79% |
| 1992 | 3,689 | 43.58% | 2,695 | 31.84% | 2,080 | 24.57% |
| 1988 | 5,042 | 64.34% | 2,653 | 33.85% | 142 | 1.81% |
| 1984 | 5,863 | 70.32% | 2,360 | 28.30% | 115 | 1.38% |
| 1980 | 5,201 | 64.79% | 2,080 | 25.91% | 746 | 9.29% |
| 1976 | 3,905 | 58.23% | 2,635 | 39.29% | 166 | 2.48% |
| 1972 | 4,873 | 68.07% | 2,006 | 28.02% | 280 | 3.91% |
| 1968 | 3,641 | 54.45% | 2,314 | 34.60% | 732 | 10.95% |
| 1964 | 2,751 | 46.51% | 3,161 | 53.44% | 3 | 0.05% |
| 1960 | 2,962 | 54.65% | 2,443 | 45.07% | 15 | 0.28% |
| 1956 | 3,524 | 66.19% | 1,782 | 33.47% | 18 | 0.34% |
| 1952 | 3,819 | 68.87% | 1,698 | 30.62% | 28 | 0.50% |
| 1948 | 2,135 | 55.79% | 1,539 | 40.21% | 153 | 4.00% |
| 1944 | 1,699 | 50.64% | 1,647 | 49.09% | 9 | 0.27% |
| 1940 | 1,483 | 44.53% | 1,820 | 54.65% | 27 | 0.81% |
| 1936 | 912 | 36.47% | 1,560 | 62.38% | 29 | 1.16% |
| 1932 | 698 | 30.91% | 1,459 | 64.61% | 101 | 4.47% |
| 1928 | 1,206 | 57.37% | 861 | 40.96% | 35 | 1.67% |
| 1924 | 950 | 47.52% | 256 | 12.81% | 793 | 39.67% |
| 1920 | 1,195 | 57.20% | 682 | 32.65% | 212 | 10.15% |
| 1916 | 846 | 41.96% | 966 | 47.92% | 204 | 10.12% |
| 1912 | 8 | 0.49% | 806 | 49.54% | 813 | 49.97% |
| 1908 | 583 | 40.94% | 618 | 43.40% | 223 | 15.66% |
| 1904 | 452 | 55.73% | 231 | 28.48% | 128 | 15.78% |
| 1900 | 396 | 42.35% | 505 | 54.01% | 34 | 3.64% |
| 1896 | 286 | 34.01% | 532 | 63.26% | 23 | 2.73% |
| 1892 | 409 | 51.13% | 266 | 33.25% | 125 | 15.63% |
| 1888 | 437 | 58.66% | 273 | 36.64% | 35 | 4.70% |
| 1884 | 345 | 53.41% | 283 | 43.81% | 18 | 2.79% |
| 1880 | 321 | 53.95% | 274 | 46.05% | 0 | 0.00% |
In the
The county is in California's 3rd congressional district, represented by Republican Kevin Kiley.[36]
On November 4, 2008, Inyo County voted 60.6% for Proposition 8 which amended the California Constitution to ban same-sex marriages.[37]
Crime
The following table includes the number of incidents reported and the rate per 1,000 persons for each type of offense.
| Population and crime rates | ||
|---|---|---|
| Population[22] | 18,457 | |
| Violent crime[38] | 80 | 4.33 |
| Homicide[38] | 2 | 0.11 |
| Forcible rape[38] | 11 | 0.60 |
| Robbery[38] | 7 | 0.38 |
| Aggravated assault[38] | 60 | 3.25 |
| Property crime[38] | 154 | 8.34 |
| Burglary[38] | 75 | 4.06 |
| Larceny-theft[38][note 4] | 177 | 9.59 |
| Motor vehicle theft[38] | 18 | 0.98 |
| Arson[38] | 1 | 0.05 |
Cities by population and crime rates
| Cities by population and crime rates | ||||||||
|---|---|---|---|---|---|---|---|---|
| City | Population[39] | Violent crimes[39] | Violent crime rate per 1,000 persons |
Property crimes[39] | Property crime rate per 1,000 persons | |||
| Bishop | 3,900 | 16 | 4.10 | 137 | 35.13 | |||
County Sheriffs
- W. A. Greenly (22 Mar 1866- 7 Nov 1867)
- William A. Moore (7 Nov 1867- 7 Nov 1875)
- Thomas Passmore (7 Nov 1875- 10 Feb 1878)- Killed On Duty
- William A. Moore (10 Feb 1878- 4 Jul 1879) - Killed On Duty
- Stephen G. Gregg (4 Jul 1879- 7 Nov 1888)
- Fred Charles Scott (7 Nov 1888- 7 Nov 1896)
- Charles Albert Collins ( 7 Nov 1896- 7 Nov 1916)
- Boone Newett (7 Nov 1916- 7 Nov 1918)
- Frank Logan (7 Nov 1918- 7 Nov 1924)
- Charles Albert Collins (7 Nov 1924-7 Nov 1926)
- Tom Hutchinson (7 Nov 1926- 7 Nov 1934)
- Emmett L. Shay (7 Nov 1934- 7 Nov 1942)
- Charles P. Cline (7 Nov 1942- 7 Nov 1954)
- Merrill Howard (7 Nov 1954- 7 Nov 1960)
- Merrill Franklin Culbertson (7 Nov 1960- 7 Nov 1962)
- Merrill L. Curtis (7 Nov 1962- 7 Nov 1970)
- Floyd Barton (7 Nov 1970- 7 Nov 1982)
- Floyd Tidwell (7 Nov 1982- 7 Nov 1984)
- Don Dorsey (7 Nov 1984- 7 Nov 1996)
- Dan Lucas ( 7 Nov 1996- 7 Nov 2006)
- William R. "Bill " Lutze (7 Nov 2006–2018)
Stephanie J. Rennie (3 Jan 2023 - Current)
Education
School districts in Inyo County are:
- Big Pine Unified School District
- Bishop Unified School District
- Bishop Union High School District
- Bishop Union Elementary School District
- Death Valley Unified School District
- Lone Pine Unified School District
- Owens Valley Unified School District
- Round Valley School District
Deep Springs College is a two-year alternative education college in Deep Springs Valley.
Higher education in Inyo County is provided by the Kern Community College District.
Notable locations
- Mushroom Rock
- Mount Whitney
- Death Valley National Park
- Badwater Basin
- Lake Manly
- Furnace Creek, California (Hottest air temperature ever recorded here in 1913 at 134.6 °F (57.0 °C). In July 1972, a ground temperature of 201 °F (94 °C) was measured in Furnace Creek. This may be the highest natural ground surface temperature ever recorded.)
Transportation
In the 1920s, automobile clubs and nearby towns started to lobby for trans-Sierra highways over Piute Pass[40] and other locations. However, by end of the 1920s, the Forest Service and the Sierra Club decided that roadless wilderness in the Sierra was valuable, and fought the proposal. The Piute Pass proposal faded out by the early 1930s, with the Forest Service proposing a route over Minaret Summit in 1933.[40] The Minaret Summit route was lobbied against by California's Governor Ronald Reagan in 1972. The expansion of the John Muir and Ansel Adams Wildernesses in the 1980s sealed off the Minaret Summit route.[40]
A trans-Sierra route between
Major highways
- U.S. Route 6
- U.S. Route 395
 State Route 127
 State Route 136
 State Route 168
 State Route 178
 State Route 190
Public transportation
Airports
Bishop Airport, Independence Airport, Lone Pine Airport and Shoshone Airport are general aviation airports located near their respective cities. Stovepipe Wells Airport and Furnace Creek Airport are located in Death Valley National Park.
Communities

Cities
Census-designated places
Other unincorporated communities
Source:[44]
- Alabama Hills
- Charleston
- Chicago Valley
- Coso_Junction
- Death Valley Junction
- Deep Springs
- Dunmovin
- Haiwee
- Laws
- Panamint Springs
- Sandy Valley
- Stewart Valley
Population ranking
The population ranking of the following table is based on the 2010 census of Inyo County.[45]
† county seat
| Rank | City/Town/etc. | Municipal type | Population (2010 Census) |
|---|---|---|---|
| 1 | Bishop | City | 3,879 |
| 2 | Dixon Lane-Meadow Creek | CDP | 2,645 |
| 3 | West Bishop | CDP | 2,607 |
| 4 | Lone Pine | CDP | 2,035 |
| 5 | Big Pine | CDP | 1,756 |
| 6 | Bishop Reservation[46] | AIAN | 1,588 |
| 7 | † Independence | CDP | 669 |
| 8 | Wilkerson | CDP | 563 |
| 9 | Big Pine Reservation[47] | AIAN | 499 |
| 10 | Round Valley | CDP | 435 |
| 11 | Mesa | CDP | 251 |
| 12 | Lone Pine Reservation[48] | AIAN | 212 |
| 13 | Olancha | CDP | 192 |
| 14 | Tecopa | CDP | 150 |
| 15 | Fort Independence Reservation[49] | AIAN | 93 |
| 16 | Cartago | CDP | 92 |
| 17 | Keeler | CDP | 66 |
| 18 | Homewood Canyon | CDP | 44 |
| 19 | Darwin | CDP | 43 |
| 20 | Shoshone | CDP | 31 |
| t-21 | Furnace Creek | CDP | 24 |
| t-21 | Timbi-Sha Shoshone Reservation[50] | AIAN | 24 |
| 22 | Trona | CDP | 18 |
| 23 | Pearsonville | CDP | 17 |
| 24 | Valley Wells | CDP | 0 (permanent) |
See also
Notes
- ^ Other = Some other race + Two or more races
- ^ Native American = Native Hawaiian or other Pacific Islander + American Indian or Alaska Native
- ^ a b Percentage of registered voters with respect to total population. Percentages of party members with respect to registered voters follow.
- ^ Only larceny-theft cases involving property over $400 in value are reported as property crimes.
References
- ^ "Inyo County". Geographic Names Information System. United States Geological Survey, United States Department of the Interior. Retrieved April 8, 2015.
- ^ a b William Bright & John McLaughlin, "Inyo Redux", Names 48:147-150 (2000)
- ^ "Board of Supervisors | Inyo County California".
- ^ "District 4 | Inyo County California".
- ^ "District 3 | Inyo County California".
- ^ "County Administrative Officer | Inyo County California".
- ^ "Mount Whitney". Peakbagger.com. Archived from the original on April 10, 2015. Retrieved April 9, 2015.
- ^ a b "Highest and Lowest Elevations". United States Geological Survey. Retrieved April 29, 2021.
- ^ a b "Inyo County, California". United States Census Bureau. Retrieved January 30, 2022.
- ^ "Find a County". National Association of Counties. Archived from the original on May 31, 2011. Retrieved June 7, 2011.
- ^ California; Hittell, Theodore Henry (1865). California, Theodore Henry Hittell, The general laws of the State of California, from 1850 to 1864, H.H. Bancroft, San Francisco, 1865. p.190. Retrieved November 5, 2011.
- ^ "2010 Census Gazetteer Files". United States Census Bureau. August 22, 2012. Archived from the original on September 25, 2015. Retrieved September 26, 2015.
- ^ a b National Park Index (2001–2003), p. 26
- ^ NPS website, "Backcountry Roads"
- ^ "Annual Estimates of the Resident Population for Counties: April 1, 2020 to July 1, 2023". United States Census Bureau. Retrieved March 26, 2024.
- US Census Bureau. Retrieved January 24, 2022.
- ^ "Historical Census Browser". University of Virginia Library. Archived from the original on May 30, 2019. Retrieved September 26, 2015.
- ^ Forstall, Richard L., ed. (March 27, 1995). "Population of Counties by Decennial Census: 1900 to 1990". United States Census Bureau. Archived from the original on September 24, 2015. Retrieved September 26, 2015.
- ^ "Census 2000 PHC-T-4. Ranking Tables for Counties: 1990 and 2000" (PDF). United States Census Bureau. April 2, 2001. Archived (PDF) from the original on December 18, 2014. Retrieved September 26, 2015.
- ^ a b "P2 HISPANIC OR LATINO, AND NOT HISPANIC OR LATINO BY RACE - 2010: DEC Redistricting Data (PL 94-171) - Inyo County, California". United States Census Bureau.
- ^ a b "P2 HISPANIC OR LATINO, AND NOT HISPANIC OR LATINO BY RACE - 2020: DEC Redistricting Data (PL 94-171) - Inyo County, California". United States Census Bureau.
- ^ a b c d e f g h i j k l m n o p q U.S. Census Bureau. American Community Survey, 2011 American Community Survey 5-Year Estimates, Table B02001. U.S. Census website . Retrieved 2013-10-26.
- ^ a b U.S. Census Bureau. American Community Survey, 2011 American Community Survey 5-Year Estimates, Table B03003. U.S. Census website . Retrieved 2013-10-26.
- ^ a b U.S. Census Bureau. American Community Survey, 2011 American Community Survey 5-Year Estimates, Table B19301. U.S. Census website . Retrieved 2013-10-21.
- ^ a b U.S. Census Bureau. American Community Survey, 2011 American Community Survey 5-Year Estimates, Table B19013. U.S. Census website . Retrieved 2013-10-21.
- ^ a b U.S. Census Bureau. American Community Survey, 2011 American Community Survey 5-Year Estimates, Table B19113. U.S. Census website . Retrieved 2013-10-21.
- ^ a b U.S. Census Bureau. American Community Survey, 2011 American Community Survey 5-Year Estimates. U.S. Census website . Retrieved 2013-10-21.
- ^ U.S. Census Bureau. American Community Survey, 2011 American Community Survey 5-Year Estimates, Table B01003. U.S. Census website . Retrieved 2013-10-21.
- ^ a b c d e f g h i j k l Data unavailable
- ^ "2010 Census P.L. 94-171 Summary File Data". United States Census Bureau.
- ^ "U.S. Census website". United States Census Bureau. Retrieved May 14, 2011.
- ^ a b c d e f g h i j k l m n o p q California Secretary of State. February 10, 2013 – Report of Registration Archived July 27, 2013, at the Wayback Machine. Retrieved 2013-10-31.
- ^ Leip, David. "Dave Leip's Atlas of U.S. Presidential Elections". uselectionatlas.org. Archived from the original on July 9, 2018. Retrieved August 31, 2018.
- ^ "Communities of Interest — County". California Citizens Redistricting Commission. Archived from the original on October 23, 2015. Retrieved April 8, 2015.
- ^ "Members Assembly". State of California. Archived from the original on April 24, 2013. Retrieved April 11, 2013.
- ^ "California's 8th Congressional District - Representatives & District Map". Civic Impulse, LLC. Retrieved March 9, 2013.
- ^ "Statement of Vote, November 4, 2008, General election" (PDF). California Secretary of State. Archived from the original (PDF) on May 6, 2013. Retrieved May 6, 2021.
- ^ a b c d e f g h i j Office of the Attorney General, Department of Justice, State of California. Table 11: Crimes – 2009 Archived December 2, 2013, at the Wayback Machine. Retrieved 2013-11-14.
- ^ a b c United States Department of Justice, Federal Bureau of Investigation. Crime in the United States, 2012, Table 8 (California) Archived June 28, 2016, at the Wayback Machine. Retrieved 2013-11-14.
- ^ a b c Marsh, Steve (2015). "The High Sierra Piute Highway" (PDF). US Forest Service.
- ^ "Trail Over Mountains Supported". Los Angeles Times. June 15, 1923. p. II10.
- ^ "See It All in the Sierra". The Fresno Bee. October 24, 1976.
- ^ "Reno".
- ^ "General Plan = Goals and Policy Report 2001" (PDF). Inyo county general plan. Inyo county. Retrieved August 22, 2022.
- ^ Promotions, Center for New Media and. "US Census Bureau 2010 Census". census.gov. Retrieved January 18, 2017.
- ^ Staff, Website Services & Coordination. "US Census Bureau 2010 Census Interactive Population Map". census.gov. Retrieved January 18, 2017.[permanent dead link]
- ^ Staff, Website Services & Coordination. "US Census Bureau 2010 Census Interactive Population Map". census.gov. Retrieved January 18, 2017.[permanent dead link]
- ^ Staff, Website Services & Coordination. "US Census Bureau 2010 Census Interactive Population Map". census.gov. Archived from the original on February 7, 2017. Retrieved January 18, 2017.
External links
 Media from Commons
 Travel information from Wikivoyage
Places adjacent to Inyo County, California | ||||||||||||||||
|---|---|---|---|---|---|---|---|---|---|---|---|---|---|---|---|---|
| ||||||||||||||||
 | ||||
| CDPs | ||||
| Unincorporated communities | ||||
| Indian reservations | ||||
| Ghost towns | ||||
| Other | ||||
| ||||
| International | |
|---|---|
| National | |
| Geographic | |
| Other | |