Keihanshin
Keihanshin
Kyoto–Osaka–Kobe Kinki MMA | |
|---|---|
Major metropolitan area of Japan | |
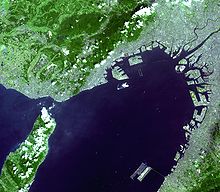
Keihanshin (京阪神, "Kyoto–Osaka–Kobe") is a
The
The name Keihanshin is
Definitions

Major Metropolitan Area


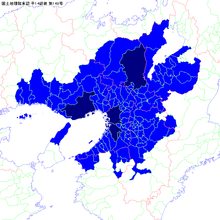
The Japan Statistics Bureau defines a Major Metropolitan Area or MMA (大都市圏) as a set of municipalities where at least 1.5% of the resident population aged 15 and above commute to school or work in a
This region consists of the combination of the metropolitan areas of Osaka, Kobe, Kyoto, and Himeji, and additionally includes several periurban areas (particularly in eastern Shiga Prefecture) that are not part of the four metropolitan areas.
As of 2015[update], the entire Keihanshin region had a population of 19,302,746 over an area of 13,228 square kilometres (5,107 square miles).[3]
Range of distance
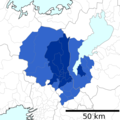
The Japan Statistics Bureau defines the set of municipalities that are entirely or mostly within 50 kilometres (31 miles) of the Municipal Office of Osaka as one measure of the metropolitan area. As of 2015[update], the population for this region was 16,260,117.[8]
Urban Employment Area

The
The core area is the set of municipalities that contain a densely inhabited district (DID) with a population of 10,000 or more. The Urban Employment Area is called Metropolitan Employment Area, when its core area has 50,000 DID population or more. Otherwise, the area is called Micropolitan Employment Area. A DID is a group of census enumeration districts inhabited at densities of 4,000 or more persons per km2. Outlying areas are those municipalities where 10% or more of the employed population work in the core area or in another outlying area. Overlaps are not allowed and an outlying area is assigned to the core area where it has the highest commuter ratio.
This definition assigns a Metropolitan Employment Area to the following cities of the Keihanshin region: Osaka, Kobe, Kyoto, Himeji, and Wakayama. The lists below indicate which cities belong to which metropolitan area. Towns and villages are not listed.
Osaka MEA
Osaka metropolitan area
Osaka MEA | |
|---|---|
 (2015) | |
| Prefectures |
|
| Core cities | |
| Area (2011)[10] | |
| • Total | 4,291.37 km2 (1,656.91 sq mi) |
| • Inhabitable area | 2,509.71 km2 (969.00 sq mi) |
| Population (2015)[11] | |
| • Total | 12,078,820 |
| • Rank | 2nd in Japan |
| • Density | 2,800/km2 (7,300/sq mi) |
| GDP (nominal)[10] | 45.4 trillion Japanese yen (2010) |
The Osaka Metropolitan Employment Area has a population (as of 2015[update]) of 12,078,820[11] and consists of the following cities:
- Core cities: Osaka, Sakai, Kadoma, Higashiōsaka
- Outlying cities
- Osaka Prefecture (entire prefecture)
- Hyōgo Prefecture (southeastern part): Sanda
- Nara Prefecture (northern part):
- Other cities: Yawata (Kyoto), Hashimoto (Wakayama)
Kyoto MEA

The
and consists of the following cities:- Core cities: Kyoto, Kusatsu
- Outlying cities
- Kyoto Prefecture (southern part): Kyotanabe
- Shiga Prefecture (southwestern part): Otsu, Moriyama
- Kyoto Prefecture (southern part):
Kobe MEA

The Kobe Metropolitan Employment Area has a population (as of 2015[update]) of 2,565,501[11] and consists of the following cities:
- Core cities: Kobe
- Outlying cities
- Hyōgo Prefecture (southern part): Ono
- Hyōgo Prefecture (southeastern part): Sanda
- Hyōgo Prefecture (southern part): Ono
- Hyōgo Prefecture (southern part):
Himeji MEA

The Himeji Metropolitan Employment Area has a population (as of 2015[update]) of 773,389[11] and consists of the following cities:
- Core cities: Himeji
- Outlying cities
- Hyōgo Prefecture (southwestern part): Tatsuno
- Hyōgo Prefecture (southern part): Ono
Wakayama MEA

The Wakayama Metropolitan Employment Area has a population (as of 2015[update]) of 569,758[11] and consists of the following cities:
- Core cities: Wakayama
- Outlying cities
- Wakayama Prefecture (northwestern part): Kainan
Historical demographics of Keihanshin
Per Japanese census data, Keihanshin, also known as Greater Osaka, has had continuous population throughout the 20th century. From 1960 to 2010 the population nearly doubled from 10.6 million to 19.3 million.[12][13] Beginning at around 2010, Keihanshin has experienced a small population decline.
| Year | Population |
|---|---|
| 1950 | 7,005,000 |
| 1960 | 10,615,000 |
| 1970 | 15,272,000 |
| 1980 | 17,028,000 |
| 1990 | 18,389,000 |
| 2000 | 18,660,180 |
| 2010 | 19,341,976 |
| 2020 | 19,223,980 |
Cities

Core cities
The core cities formed Keihanshin are
The core cities of Keihanshin are:[14]
- Osaka (population 2.75 million)
- Kobe (population 1.53 million)
- Kyoto (population 1.46 million)
- Sakai (population 826,447)
Other cities within the area

The other cities in the prefectures of Osaka, Hyōgo, Kyoto and Nara include:
- Aioi
- Akashi
- Amagasaki(pop 460,000)
- Ashiya
- Awaji
- Daitō
- Fujiidera
- Habikino
- Hannan
- Higashiōsaka(pop 490,000)
- Himeji(pop 530,000)
- Hirakata(pop 400,000)
- Ibaraki
- Ikeda
- Itami
- Izumi
- Izumiōtsu
- Izumisano
- Jōyō
- Kadoma
- Kaizuka
- Kakogawa
- Kameoka
- Kasai
- Kashiwara
- Katano
- Katō
- Kawachinagano
- Kawanishi
- Kishiwada
- Kizugawa
- Kyōtanabe
- Matsubara
- Miki
- Minoh
- Moriguchi
- Mukō
- Nagaokakyō
- Nantan
- Neyagawa
- Nishinomiya(pop 490,000)
- Ono
- Ōsakasayama
- Sanda
- Sasayama
- Sennan
- Settsu
- Shijōnawate
- Suita(pop 390,000)
- Takaishi
- Takarazuka
- Takasago
- Takatsuki(pop 350,000)
- Tatsuno
- Tondabayashi
- Toyonaka(pop 400,000)
- Uji
- Yao
- Yawata
Additional cities
In the major metropolitan area (MMA) definition used by the Japanese Statistics Bureau, the following cities in the prefectures of Mie, Shiga, Nara, Wakayama are included:
Mie Prefecture
Shiga Prefecture
Nara Prefecture
Wakayama Prefecture
Transportation

Air
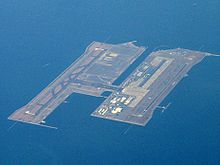
There are two major airports. The fairly centrally located
, serves primarily domestic routes.Kobe Airport, built on a reclaimed island south of Port Island opened in 2006, offering domestic flights.
Rail
Keihanshin has a very extensive network of railway lines, comparable to that of Greater Tokyo. Main rail terminals in the cities include, Umeda/Osaka, Namba, Tennoji, Sannomiya, and Kyoto.
High speed rail
All trains on the two
There are also numerous Limited Express services which operate on conventional lines, but are designed for comfortable long-distance travel. Many of these trains operate at speeds that most other countries would consider "high-speed". From Osaka and Kyoto, Limited Express services connect most major cities within the Keihanshin area and beyond, and are more popular than the Shinkansen for connections within the area due to service to more areas and more centrally located and well connected stations in areas also serviced by Shinkansen. Lower ticket prices also encourages usage, though they are more expensive than the regular/commuter trains which operate on the same lines.
Commuter rail
Both
Municipal subway
Osaka, Kyoto and Kobe each have municipal subway systems. The Osaka Municipal Subway was privatized in 2018 and is now operated by Osaka Metro.[16] Other rapid transit systems in the region include Kobe New Transit which serves the artificial islands off the coast of Kobe including Kobe Airport, as well as Osaka Monorail that connects municipalities in Osaka Prefecture to Osaka International Airport.
Economy
GDP (purchasing power parity) 2015

Compared with other urban regions of the world, the agglomeration of Osaka-Kobe is the ninth largest economy, in terms of gross metropolitan product at purchasing power parity (PPP), in 2015 according to a study by the Brookings Institution.[17]
| Rank | Metro area | Country | GDP(PPP) (in billion US$) |
|---|---|---|---|
| 1 | Tokyo | 1,624
| |
| 2 | New York | 1,492
| |
| 3 | Los Angeles | 927.6
| |
| 4 | Seoul-Incheon | 903.5
| |
| 5 | London | 831.1
| |
| 6 | Paris | 818.5
| |
| 7 | Shanghai | 809.5
| |
| 8 | Moscow | 749.7
| |
| 9 | Osaka-Kobe | 681.0
| |
| 10 | Beijing | 663.6
|
Metropolitan employment areas
| Area | 1980 | 1985 | 1990 | 1995 | 2010 |
|---|---|---|---|---|---|
| Osaka MEA | 119.5 | 162.5 | 235.7 | 272.2 | 406.3 |
| Kyoto MEA | 23.7 | 34.0 | 45.7 | 53.9 | 90.6 |
| Kobe MEA | 22.0 | 31.0 | 44.0 | 48.7 | 75.5 |
| Himeji MEA | 7.3 | 10.1 | 13.7 | 17.3 | 26.4 |
Wakayama MEA
|
5.7 | 7.6 | 8.6 | 9.7 | 19.3 |
Prefectures

- 2014 average exchange rate (1 yen)[20]
| Prefecture | Gross Prefecture Product (in billion yen)[21] |
Gross Prefecture Product (in billion US$) |
|---|---|---|
37,934
|
358
| |
19,788
|
187
| |
10,054
|
95
| |
5,846
|
55
| |
3,579
|
34
| |
3,541
|
33
| |
| Kansai Region | 80,741
|
762
|
GDP (nominal) 2014
Kansai region and Top 20 Countries.[22]
| Rank | Country | GDP (in US$) | |
|---|---|---|---|
| 1 | 17.43 trillion
| ||
| 2 | 10.53 trillion
| ||
| 3 | 4.85 trillion
| ||
| ・・・ | |||
| 15 | 1.30 trillion
| ||
| 16 | 934.1 billion
| ||
| 17 | 891.1 billion
| ||
| 18 | 881.0 billion
| ||
| (Kansai Region) | 762.1 billion
| ||
| 19 | 756.4 billion
| ||
| 20 | 709.3 billion
| ||
See also
- Hanshin Industrial Region (Osaka and Kobe area)
- Kamigata
- Kansai region
- Kansai Science City
- Keihanshin industrial region
- List of metropolitan areas by population
- List of metropolitan areas in Asia by population
- List of metropolitan areas in Japan by population
- Jing-Jin-Ji
References
- ^ Statistical Handbook of Japan. Statistics Bureau of Japan
- ^ "Global Wealth GDP Nominal Distribution: Who Are The Leaders Of The Global Economy? - Full Size". www.visualcapitalist.com. Retrieved 2022-03-27.
- ^ a b Japan Statistics Bureau - "2015 Census", retrieved June 27, 2021
- ^ Brookings Institution report 2015, retrieved August 23, 2015
- Worldwide Centers of CommerceIndex 2008" page 8 and 22, retrieved June 11, 2008
- ^ NationMaster.com
- ^ Japan Statistics Bureau - Definition of Major Metropolitan Area
- ^ Japan Statistics Bureau - Basic Figures for Range of Distance
- ^ "What are UEA?". Center for Spatial Information Science, the University of Tokyo. Retrieved January 25, 2019.
- ^ a b Kanemoto, Yoshitsugu. "Metropolitan Employment Area (MEA) Data". Center for Spatial Information Science, University of Tokyo. Retrieved January 25, 2019.
- ^ a b c d e f Kanemoto, Yoshitsugu. "Urban Employment Area (UEA) Code Table". Center for Spatial Information Science, University of Tokyo. Retrieved January 25, 2019.
- ^ a b "Greater Osaka population". Archived from the original on 2019-08-13. Retrieved 2019-08-13.
- ^ a b "Keihanshin population". Archived from the original on 2020-07-27. Retrieved 2020-07-27.
- ^ https://www.e-stat.go.jp/stat-search/file-download?statInfId=000031652963&fileKind=2 [bare URL PDF]
- ^ JR West. "JRおでかけネット - きっぷ・サービス案内 - ご利用可能エリア 近畿圏エリア" (in Japanese). Archived from the original on 2009-02-23. Retrieved 2008-02-25.
- ^ "会社概要|Osaka Metro". Osaka Metro (in Japanese). Retrieved 2023-01-05.
- ^ Redefining Global Cities
- ^ Yoshitsugu Kanemoto. "Metropolitan Employment Area (MEA) Data". Center for Spatial Information Science, The University of Tokyo.
- ^ Conversion rates - Exchange rates - OECD Data
- ^ Yearly average currency exchange rates
- ^ "Gross Prefecture Product 2014" (PDF). Archived from the original (PDF) on 2016-03-17. Retrieved 2015-08-23.
- ^ World Economic Outlook Database October 2017
