
La Plata County, Colorado
La Plata County | |
|---|---|
UTC−6 (MDT) | |
| Congressional district | 3rd |
| Website | co |
La Plata County is a county located in the
La Plata County comprises the Durango, CO
The county is home to
Geography
According to the
Adjacent counties
- San Juan County - north
- Hinsdale County - northeast
- Archuleta County - east
- San Juan County, New Mexico - south
- Montezuma County - west
- Dolores County - northwest
Major highways
- U.S. Highway 160
- U.S. Highway 550
 State Highway 140
 State Highway 151
 State Highway 172
Demographics
| Census | Pop. | Note | %± |
|---|---|---|---|
| 1880 | 1,110 | — | |
| 1890 | 5,509 | 396.3% | |
| 1900 | 7,016 | 27.4% | |
| 1910 | 10,812 | 54.1% | |
| 1920 | 11,218 | 3.8% | |
| 1930 | 12,975 | 15.7% | |
| 1940 | 15,494 | 19.4% | |
| 1950 | 14,880 | −4.0% | |
| 1960 | 19,225 | 29.2% | |
| 1970 | 19,199 | −0.1% | |
| 1980 | 27,424 | 42.8% | |
| 1990 | 32,284 | 17.7% | |
| 2000 | 43,941 | 36.1% | |
| 2010 | 51,334 | 16.8% | |
| 2020 | 55,638 | 8.4% | |
| 2023 (est.) | 56,407 | [6] | 1.4% |
| U.S. Decennial Census[7] 1790-1960[8] 1900-1990[9] 1990-2000[10] 2010-2020[1] | |||
As of the
There were 17,342 households, out of which 29.60% had children under the age of 18 living with them, 49.90% were married couples living together, 8.70% had a female householder with no husband present, and 37.20% were non-families. 24.80% of all households were made up of individuals, and 6.10% had someone living alone who was 65 years of age or older. The average household size was 2.43 and the average family size was 2.92.
In the county, the population was spread out, with 22.70% under the age of 18, 13.90% from 18 to 24, 29.00% from 25 to 44, 25.10% from 45 to 64, and 9.40% who were 65 years of age or older. The median age was 36 years. For every 100 females there were 103.60 males. For every 100 females age 18 and over, there were 103.10 males.
The median income for a household in the county was $40,159, and the median income for a family was $50,446. Males had a median income of $32,486 versus $24,666 for females. The
Communities
City
Towns
Census-designated place
Other unincorporated communities
Ghost towns
- Greysill Mines
- La Plata
- Parrott City[12]
Politics
In its early years La Plata County generally leaned towards the Democratic Party. Only
| Year | Republican | Democratic | Third party | |||
|---|---|---|---|---|---|---|
| No. | % | No. | % | No. | % | |
| 2020 | 14,233 | 39.91% | 20,548 | 57.61% | 886 | 2.48% |
| 2016 | 12,587 | 40.41% | 15,525 | 49.84% | 3,038 | 9.75% |
| 2012 | 12,794 | 43.65% | 15,489 | 52.85% | 1,025 | 3.50% |
| 2008 | 11,503 | 41.11% | 16,057 | 57.39% | 419 | 1.50% |
| 2004 | 11,704 | 45.87% | 13,409 | 52.56% | 400 | 1.57% |
| 2000 | 9,993 | 48.77% | 7,864 | 38.38% | 2,633 | 12.85% |
| 1996 | 8,057 | 46.52% | 6,509 | 37.58% | 2,755 | 15.91% |
| 1992 | 5,522 | 35.37% | 5,913 | 37.87% | 4,178 | 26.76% |
| 1988 | 7,714 | 57.73% | 5,443 | 40.73% | 205 | 1.53% |
| 1984 | 8,719 | 67.49% | 4,040 | 31.27% | 159 | 1.23% |
| 1980 | 7,291 | 59.76% | 3,034 | 24.87% | 1,876 | 15.38% |
| 1976 | 6,228 | 59.05% | 3,843 | 36.44% | 476 | 4.51% |
| 1972 | 5,691 | 62.24% | 2,830 | 30.95% | 623 | 6.81% |
| 1968 | 4,269 | 57.10% | 2,523 | 33.75% | 684 | 9.15% |
| 1964 | 3,550 | 44.34% | 4,442 | 55.48% | 15 | 0.19% |
| 1960 | 4,772 | 58.83% | 3,329 | 41.04% | 10 | 0.12% |
| 1956 | 4,770 | 66.81% | 2,366 | 33.14% | 4 | 0.06% |
| 1952 | 4,425 | 66.03% | 2,210 | 32.98% | 66 | 0.98% |
| 1948 | 2,735 | 51.03% | 2,536 | 47.31% | 89 | 1.66% |
| 1944 | 3,023 | 59.64% | 2,031 | 40.07% | 15 | 0.30% |
| 1940 | 3,871 | 57.39% | 2,835 | 42.03% | 39 | 0.58% |
| 1936 | 2,354 | 42.19% | 3,040 | 54.49% | 185 | 3.32% |
| 1932 | 2,124 | 38.50% | 3,156 | 57.21% | 237 | 4.30% |
| 1928 | 2,837 | 59.58% | 1,872 | 39.31% | 53 | 1.11% |
| 1924 | 1,469 | 35.13% | 1,516 | 36.25% | 1,197 | 28.62% |
| 1920 | 1,711 | 50.85% | 1,445 | 42.94% | 209 | 6.21% |
| 1916 | 1,029 | 27.07% | 2,590 | 68.14% | 182 | 4.79% |
| 1912 | 692 | 19.44% | 1,775 | 49.86% | 1,093 | 30.70% |
| 1908 | 1,381 | 36.80% | 2,004 | 53.40% | 368 | 9.81% |
| 1904 | 1,745 | 51.13% | 1,458 | 42.72% | 210 | 6.15% |
| 1900 | 900 | 32.50% | 1,844 | 66.59% | 25 | 0.90% |
| 1896 | 91 | 3.22% | 2,729 | 96.57% | 6 | 0.21% |
| 1892 | 545 | 33.58% | 0 | 0.00% | 1,078 | 66.42% |
| 1888 | 849 | 51.11% | 774 | 46.60% | 38 | 2.29% |
| 1884 | 722 | 51.02% | 629 | 44.45% | 64 | 4.52% |
| 1880 | 259 | 42.88% | 345 | 57.12% | 0 | 0.00% |
Recreation
National forest and wilderness
National historic district
- Durango-Silverton Narrow-Gauge Railroad National Historic District
Trails
- Colorado Trail
- Old Spanish National Historic Trail
Bicycle route
Scenic byway
- San Juan Skyway National Scenic Byway
Education
Public Education
Durango School District 9-R
- Elementary Schools
- Animas Valley Elementary School
- Florida Mesa Elementary School
- Fort Lewis Mesa Elementary School
- Needham Elementary School
- Park Elementary School
- Riverview Elementary School
- Sunnyside Elementary School
- Middle Schools
- Escalante Middle School
- Miller Middle School
- High Schools
- Durango High School
- Durango Big Picture High School
Bayfield School District
- Elementary Schools
- Bayfield Primary School
- Bayfield Intermediate School
- Middle School
- Bayfield Middle School
- High School
- Bayfield High School
Ignacio School District 11-JT
- Elementary School
- Ignacio Elementary School
- Middle School
- Ignacio Middle School
- High School
- Ignacio High School
See also
- Bibliography of Colorado
- Geography of Colorado
- History of Colorado
- Index of Colorado-related articles
- List of Colorado-related lists
- Outline of Colorado
References
- ^ a b "State & County QuickFacts". United States Census Bureau. Retrieved September 5, 2021.
- ^ "Find a County". National Association of Counties. Retrieved June 7, 2011.
- National Archives.
- Colorado census statistical areas.
- ^ "US Gazetteer files: 2010, 2000, and 1990". United States Census Bureau. February 12, 2011. Retrieved April 23, 2011.
- ^ "Annual Estimates of the Resident Population for Counties: April 1, 2020 to July 1, 2023". United States Census Bureau. Retrieved March 31, 2024.
- ^ "U.S. Decennial Census". United States Census Bureau. Retrieved June 8, 2014.
- ^ "Historical Census Browser". University of Virginia Library. Retrieved June 8, 2014.
- ^ "Population of Counties by Decennial Census: 1900 to 1990". United States Census Bureau. Retrieved June 8, 2014.
- ^ "Census 2000 PHC-T-4. Ranking Tables for Counties: 1990 and 2000" (PDF). United States Census Bureau. Archived (PDF) from the original on March 27, 2010. Retrieved June 8, 2014.
- ^ "U.S. Census website". United States Census Bureau. Retrieved May 14, 2011.
- ^ Parrott
- ^ Leip, David. "Dave Leip's Atlas of U.S. Presidential Elections". uselectionatlas.org. Retrieved May 26, 2017.
External links
- La Plata County Government website
- La Plata County State Register properties Archived March 10, 2005, at the Wayback Machine
- Colorado County Evolution by Don Stanwyck
- Colorado Historical Society
- La Plata County Central Reservations
- Access Durango, Colorado Community Portal
Places adjacent to La Plata County, Colorado | ||||||||||||||||
|---|---|---|---|---|---|---|---|---|---|---|---|---|---|---|---|---|
| ||||||||||||||||
Municipalities and communities of La Plata County, Colorado, United States | ||
|---|---|---|
| City | 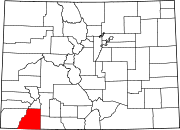 | |
| Towns | ||
| CDPs | ||
| Unincorporated communities | ||
Ghost towns | ||
Indian reservations | ||
| Footnotes | ‡This populated place also has portions in an adjacent county or counties | |
| ||
37°17′N 107°51′W / 37.29°N 107.85°W
| International | |
|---|---|
| National | |
| Other | |