
Lawrence County, Illinois
Lawrence County | |
|---|---|
UTC−5 (CDT) | |
| Congressional district | 12th |
| Website | www.lawrencecounty illinois.com |
Lawrence County is the easternmost
History
Lawrence County was formed in 1821 out of Crawford and Edwards counties. It was named for Capt. James Lawrence, who was killed in action during the War of 1812 while commanding the frigate USS Chesapeake.[3] Mortally wounded, he gave his men the famous last order, "Don't give up the ship."
-
 Lawrence County from its creation in 1821 to 1824
 -
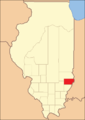
 Lawrence County between 1824 and 1841
 -
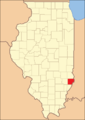 Lawrence County in 1841, when the creation of Richland County reduced Lawrence to its current size


Geography
According to the
Climate and weather
| Lawrenceville, Illinois | ||||||||||||||||||||||||||||||||||||||||||||||||||||||||||||
|---|---|---|---|---|---|---|---|---|---|---|---|---|---|---|---|---|---|---|---|---|---|---|---|---|---|---|---|---|---|---|---|---|---|---|---|---|---|---|---|---|---|---|---|---|---|---|---|---|---|---|---|---|---|---|---|---|---|---|---|---|
| Climate chart (explanation) | ||||||||||||||||||||||||||||||||||||||||||||||||||||||||||||
| ||||||||||||||||||||||||||||||||||||||||||||||||||||||||||||
| ||||||||||||||||||||||||||||||||||||||||||||||||||||||||||||
In recent years, average temperatures in the county seat of Lawrenceville have ranged from a low of 18 °F (−8 °C) in January to a high of 88 °F (31 °C) in July, although a record low of −26 °F (−32 °C) was recorded in January 1994 and a record high of 104 °F (40 °C) was recorded in June 1988. Average monthly precipitation ranged from 2.51 inches (64 mm) in February to 5.13 inches (130 mm) in May.[5]
Transit
Major highways
Adjacent counties
- Crawford County - north
- Knox County, Indiana - east
- Wabash County - south
- Richland County - west
Demographics
| Census | Pop. | Note | %± |
|---|---|---|---|
| 1830 | 3,668 | — | |
| 1840 | 7,092 | 93.3% | |
| 1850 | 6,121 | −13.7% | |
| 1860 | 9,214 | 50.5% | |
| 1870 | 12,533 | 36.0% | |
| 1880 | 13,663 | 9.0% | |
| 1890 | 14,693 | 7.5% | |
| 1900 | 16,523 | 12.5% | |
| 1910 | 22,661 | 37.1% | |
| 1920 | 21,380 | −5.7% | |
| 1930 | 21,885 | 2.4% | |
| 1940 | 21,075 | −3.7% | |
| 1950 | 20,539 | −2.5% | |
| 1960 | 18,540 | −9.7% | |
| 1970 | 17,522 | −5.5% | |
| 1980 | 17,807 | 1.6% | |
| 1990 | 15,972 | −10.3% | |
| 2000 | 15,452 | −3.3% | |
| 2010 | 16,833 | 8.9% | |
| 2020 | 15,280 | −9.2% | |
| 2023 (est.) | 14,813 | [6] | −3.1% |
| U.S. Decennial Census[7] 1790-1960[8] 1900-1990[9] 1990-2000[10] 2010-2013[1] | |||

As of the
Of the 6,130 households, 28.6% had children under the age of 18 living with them, 50.7% were married couples living together, 10.7% had a female householder with no husband present, 33.8% were non-families, and 30.1% of all households were made up of individuals. The average household size was 2.34 and the average family size was 2.88. The median age was 39.7 years.[11]
The median income for a household in the county was $38,771 and the median income for a family was $45,565. Males had a median income of $40,949 versus $25,991 for females. The per capita income for the county was $19,297. About 14.8% of families and 17.5% of the population were below the
Communities
Cities
Village
Unincorporated communities
Townships
Nine townships make up Lawrence County. They are:
Politics
In its early days, Lawrence County was a Democratic-leaning swing county, voting Republican only twice up to 1892 when it supported
| Year | Republican | Democratic | Third party | |||
|---|---|---|---|---|---|---|
| No. | % | No. | % | No. | % | |
| 2020 | 4,886 | 76.08% | 1,419 | 22.10% | 117 | 1.82% |
| 2016 | 4,521 | 74.19% | 1,290 | 21.17% | 283 | 4.64% |
| 2012 | 3,857 | 64.40% | 2,011 | 33.58% | 121 | 2.02% |
| 2008 | 3,403 | 51.89% | 3,016 | 45.99% | 139 | 2.12% |
| 2004 | 4,162 | 61.85% | 2,518 | 37.42% | 49 | 0.73% |
| 2000 | 3,594 | 54.64% | 2,822 | 42.90% | 162 | 2.46% |
| 1996 | 2,568 | 40.18% | 2,871 | 44.92% | 953 | 14.91% |
| 1992 | 2,681 | 35.80% | 3,270 | 43.67% | 1,537 | 20.53% |
| 1988 | 3,655 | 53.57% | 3,140 | 46.02% | 28 | 0.41% |
| 1984 | 4,686 | 61.35% | 2,924 | 38.28% | 28 | 0.37% |
| 1980 | 4,453 | 56.68% | 3,030 | 38.57% | 373 | 4.75% |
| 1976 | 4,345 | 51.47% | 4,044 | 47.90% | 53 | 0.63% |
| 1972 | 5,347 | 65.36% | 2,818 | 34.45% | 16 | 0.20% |
| 1968 | 4,883 | 54.58% | 3,075 | 34.37% | 988 | 11.04% |
| 1964 | 4,176 | 44.85% | 5,136 | 55.15% | 0 | 0.00% |
| 1960 | 6,120 | 62.45% | 3,667 | 37.42% | 13 | 0.13% |
| 1956 | 6,104 | 61.89% | 3,751 | 38.03% | 7 | 0.07% |
| 1952 | 6,207 | 61.54% | 3,875 | 38.42% | 4 | 0.04% |
| 1948 | 4,472 | 49.38% | 4,391 | 48.48% | 194 | 2.14% |
| 1944 | 5,191 | 55.79% | 4,003 | 43.02% | 111 | 1.19% |
| 1940 | 6,061 | 51.22% | 5,625 | 47.54% | 147 | 1.24% |
| 1936 | 5,060 | 44.39% | 6,168 | 54.11% | 170 | 1.49% |
| 1932 | 4,194 | 40.17% | 6,100 | 58.42% | 147 | 1.41% |
| 1928 | 5,851 | 60.16% | 3,806 | 39.13% | 69 | 0.71% |
| 1924 | 4,607 | 51.50% | 4,103 | 45.87% | 235 | 2.63% |
| 1920 | 4,720 | 54.17% | 3,707 | 42.54% | 287 | 3.29% |
| 1916 | 4,481 | 44.47% | 5,052 | 50.14% | 543 | 5.39% |
| 1912 | 1,617 | 30.39% | 2,550 | 47.93% | 1,153 | 21.67% |
| 1908 | 2,197 | 47.16% | 2,253 | 48.36% | 209 | 4.49% |
| 1904 | 1,969 | 50.64% | 1,712 | 44.03% | 207 | 5.32% |
| 1900 | 1,961 | 48.03% | 2,021 | 49.50% | 101 | 2.47% |
| 1896 | 1,972 | 49.41% | 1,948 | 48.81% | 71 | 1.78% |
| 1892 | 1,523 | 45.30% | 1,572 | 46.76% | 267 | 7.94% |
See also
References
- ^ a b "State & County QuickFacts". United States Census Bureau. Archived from the original on June 6, 2011. Retrieved July 6, 2014.
- ^ "Find a County". National Association of Counties. Retrieved June 7, 2011.
- ^ Gannett, Henry (1905). The Origin of Certain Place Names in the United States. U.S. Government Printing Office. p. 182.
- ^ a b "Population, Housing Units, Area, and Density: 2010 - County". United States Census Bureau. Archived from the original on February 12, 2020. Retrieved July 12, 2015.
- ^ a b "Monthly Averages for Lawrenceville, Illinois". The Weather Channel. Retrieved January 27, 2011.
- ^ "Annual Estimates of the Resident Population for Counties: April 1, 2020 to July 1, 2023". United States Census Bureau. Retrieved April 2, 2024.
- ^ "U.S. Decennial Census". United States Census Bureau. Retrieved July 6, 2014.
- ^ "Historical Census Browser". University of Virginia Library. Retrieved July 6, 2014.
- ^ "Population of Counties by Decennial Census: 1900 to 1990". United States Census Bureau. Retrieved July 6, 2014.
- ^ "Census 2000 PHC-T-4. Ranking Tables for Counties: 1990 and 2000" (PDF). United States Census Bureau. Archived (PDF) from the original on March 27, 2010. Retrieved July 6, 2014.
- ^ a b c "DP-1 Profile of General Population and Housing Characteristics: 2010 Demographic Profile Data". United States Census Bureau. Archived from the original on February 13, 2020. Retrieved July 12, 2015.
- ^ "DP02 SELECTED SOCIAL CHARACTERISTICS IN THE UNITED STATES – 2006-2010 American Community Survey 5-Year Estimates". United States Census Bureau. Archived from the original on February 13, 2020. Retrieved July 12, 2015.
- ^ "DP03 SELECTED ECONOMIC CHARACTERISTICS – 2006-2010 American Community Survey 5-Year Estimates". United States Census Bureau. Archived from the original on February 13, 2020. Retrieved July 12, 2015.
- ^ Leip, David. "Dave Leip's Atlas of U.S. Presidential Elections". uselectionatlas.org. Retrieved November 9, 2018.
External links
- Lawrence County official site
- Lawrence County Fact Sheet, Illinois State Archives
- Blue Star Emergency Medical Services Official Site
Places adjacent to Lawrence County, Illinois | ||||||||||||||||
|---|---|---|---|---|---|---|---|---|---|---|---|---|---|---|---|---|
| ||||||||||||||||
 | ||||
Village | ||||
| Townships | ||||
| Unincorporated communities | ||||
| ||||
| Counties |  | |
|---|---|---|
| Mid-sized cities (25,000+) | ||
| Small cities (10,000-25,000) | ||
| Small cities (5,000-10,000) | ||
| Transit systems | ||
| Amtrak stations | ||
| Interstates | ||
| Airports/military bases |
| |
| Universities | ||
| Colleges | ||
| Sports teams based in Southern Illinois | ||
| International | |
|---|---|
| National | |
| Other | |