
Learning curve

Graphs are unavailable due to technical issues. There is more info on Phabricator and on MediaWiki.org. |
Graphs are unavailable due to technical issues. There is more info on Phabricator and on MediaWiki.org. |
A learning curve is a graphical representation of the relationship between how proficient people are at a task and the amount of experience they have. Proficiency (measured on the vertical axis) usually increases with increased experience (the horizontal axis), that is to say, the more someone, groups, companies or industries perform a task, the better their performance at the task.[1]
The common expression "a steep learning curve" is a misnomer suggesting that an activity is difficult to learn and that expending much effort does not increase proficiency by much, although a learning curve with a steep start actually represents rapid progress.[2][3] In fact, the gradient of the curve has nothing to do with the overall difficulty of an activity, but expresses the expected rate of change of learning speed over time. An activity that it is easy to learn the basics of, but difficult to gain proficiency in, may be described as having "a steep learning curve".[citation needed]
The learning curve may refer to a specific task or a
In psychology


Hermann Ebbinghaus' memory tests, published in 1885, involved memorizing series of
The first known use of the term 'learning curve' is from 1903: "Bryan and Harter (6) found in their study of the acquisition of the telegraphic language a learning curve which had the rapid rise at the beginning followed by a period of slower learning, and was thus convex to the vertical axis."[5][3]
Psychologist Arthur Bills gave a more detailed description of learning curves in 1934. He also discussed the properties of different types of learning curves, such as negative acceleration, positive acceleration, plateaus, and ogive curves.[8]
In economics
History

In 1936,
In 1952, the US Air Force published data on the learning curve in the airframe industry from 1940 to mid-1945.[9] Specifically, they tabulated and plotted the direct man-hour cost of various products as a function of cumulative production. This formed the basis of many studies on learning curves in the 1950s.[10]
In 1968
Models

The main statistical models for learning curves are as follows:[15][16]
- Wright's model ("log-linear"): , where
- is the cost of the -th unit,
- is the total number of units made,
- is the cost of the first unit made,
- is the exponent measuring the strength of learning.
- Plateau model: , where models the minimal cost achievable. In other words, the learning ceases after cost reaches a sufficiently low level.
- Stanford-B model: , where models worker's prior experience.
- DeJong's model: , where models the fraction of production done by machines (assumed to be unable to learn, unlike a human worker).
- S-curve model: , a combination of Stanford-B model and DeJong's model.


The key variable is the exponent measuring the strength of learning. It is usually expressed as , where is the "learning rate". In words, it means that the unit cost decreases by , for every doubling of total units made. Wright found that in aircraft manufacturing, meaning that the unit cost decreases by 20% for every doubling of total units made.


Applications
The economic learning of productivity and efficiency generally follows the same kinds of experience curves and have interesting secondary effects. Efficiency and productivity improvement can be considered as whole organization or industry or economy learning processes, as well as for individuals. The general pattern is of first speeding up and then slowing down, as the practically achievable level of methodology improvement is reached. The effect of reducing local effort and resource use by learning improved methods often has the opposite latent effect on the next larger scale system, by facilitating its expansion, or
A comprehensive understanding of the application of learning curve on managerial economics would provide plenty of benefits on strategic level. People could predict the appropriate timing of the introductions for new products and offering competitive pricing decisions, deciding investment levels by stimulate innovations on products and the selection of organizational design structures.[17] Balachander and Srinivasan used to study a durable product and its pricing strategy on the principles of the learning curve. Based on the concepts that the growing experience in producing and selling a product would cause the decline of unit production cost, they found the potential best introductory price for this product.[18] As for the problems of production management under the limitation of scarce resources, Liao [19] observed that without including the effects of the learning curve on labor hours and machines hours, people might make incorrect managerial decisions. Demeester and Qi [20] used the learning curve to study the transition between the old products' eliminating and new products' introduction. Their results indicated that the optimal switching time is determined by the characteristics of product and process, market factors, and the features of learning curve on this production. Konstantaras, Skouri, and Jaber [21] applied the learning curve on demand forecasting and the economic order quantity. They found that the buyers obey to a learning curve, and this result is useful for decision-making on inventory management.
Learning curves have been used to model Moore's law in the semiconductor industry.[22]
When wages are proportional to number of products made, workers may resist changing to a different post or having a new member on the team, since it would temporarily decrease productivity. Learning curves has been used to adjust for temporary dips so that workers are paid more for the same product while they are learning.[15]
Examples and mathematical modeling
A learning curve is a plot of proxy measures for implied learning (proficiency or progression toward a limit) with experience.
- The horizontal axis represents experience either directly as time (clock time, or the time spent on the activity), or can be related to time (a number of trials, or the total number of units produced).
- The vertical axis is a measure representing 'learning' or 'proficiency' or other proxy for "efficiency" or "productivity". It can either be increasing (for example, the score in a test), or decreasing (the time to complete a test).
For the performance of one person in a series of trials the curve can be erratic, with proficiency increasing, decreasing or leveling out in a plateau.
When the results of a large number of individual trials are averaged then a smooth curve results, which can often be described with a mathematical function.
-
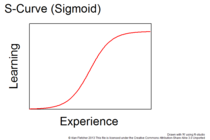 S-curve or sigmoid function
 -
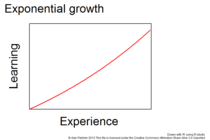 Exponential growth
 -
 Exponential rise or fall to a limit
 -
 Power law


Several main functions have been used:[23][24][25]
- The S-Curve or Sigmoid function is the idealized general form of all learning curves, with slowly accumulating small steps at first followed by larger steps and then successively smaller ones later, as the learning activity reaches its limit. That idealizes the normal progression from discovery of something to learn about followed to the limit of learning about it. The other shapes of learning curves (4, 5 & 6) show segments of S-curves without their full extents. In this case the improvement of proficiency starts slowly, then increases rapidly, and finally levels off.
- Exponential growth; the proficiency can increase without limit, as in Exponential growth
- Exponential rise or fall to a Limit; proficiency can exponentially approach a limit in a manner similar to that in which a capacitor charges or discharges (exponential decay) through a resistor. The increase in skill or retention of information may increase rapidly to its maximum rate during the initial attempts, and then gradually levels out, meaning that the subject's skill does not improve much with each later repetition, with less new knowledge gained over time.
- Power law; similar in appearance to an exponential decay function, and is almost always used for a decreasing performance metric, such as cost. It also has the property that if plotted as the logarithm of proficiency against the logarithm of experience the result is a straight line, and it is often presented that way.
The specific case of a plot of Unit Cost versus Total Production with a power law was named the
In machine learning
Plots relating performance to experience are widely used in
Broader interpretations
Initially introduced in
General learning limits
Learning curves, also called experience curves, relate to the much broader subject of natural limits for resources and technologies in general. Such limits generally present themselves as increasing complications that slow the learning of how to do things more efficiently, like the well-known limits of perfecting any process or product or to perfecting measurements.
Efficiency and development curves typically follow a two-phase process of first bigger steps corresponding to finding things easier, followed by smaller steps of finding things more difficult. It reflects bursts of learning following breakthroughs that make learning easier followed by meeting constraints that make learning ever harder, perhaps toward a point of cessation.
- Natural Limits One of the key studies in the area concerns diminishing returns on investments generally, either physical or financial, pointing to whole system limits for resource development or other efforts. The most studied of these may be Energy Return on Energy Invested or EROEI, discussed at length in an Encyclopedia of the Earth article and in an OilDrum article and series also referred to as Hubert curves. The energy needed to produce energy is a measure of our difficulty in learning how to make remaining energy resources useful in relation to the effort expended. Energy returns on energy invested have been in continual decline for some time, caused by natural resource limits and increasing investment. Energy is both nature's and our own principal resource for making things happen. The point of diminishing returns is when increasing investment makes the resource more expensive. As natural limits are approached, easily used sources are exhausted and ones with more complications need to be used instead. As an environmental signal persistently diminishing EROI indicates an approach of whole system limits in our abilityto make things happen.
- Useful Natural Limits EROEI measures the return on invested effort as a ratio of R/I or learning progress. The inverse I/R measures learning difficulty. The simple difference is that if R approaches zero R/I will too, but I/R will approach infinity. When complications emerge to limit learning progress the limit of useful returns, uR, is approached and R-uR approaches zero. The difficulty of useful learning I/(R-uR) approaches infinity as increasingly difficult tasks make the effort unproductive. That point is approached as a vertical asymptote, at a particular point in time, that can be delayed only by unsustainable effort. It defines a point at which enough investment has been made and the task is done, usually planned to be the same as when the task is complete. For unplanned tasks it may be either foreseen or discovered by surprise. The usefulness measure, uR, is affected by the complexity of environmental responses that can only be measured when they occur unless they are foreseen.
In culture
"Steep learning curve"
The expression "steep learning curve" is used with opposite meanings. Most sources, including the
The common English usage aligns with a metaphorical interpretation of the learning curve as a hill to climb. (A steeper hill is initially hard, while a gentle slope is less strainful, though sometimes rather tedious. Accordingly, the shape of the curve (hill) may not indicate the total amount of work required. Instead, it can be understood as a matter of preference related to ambition, personality and learning style.)
-
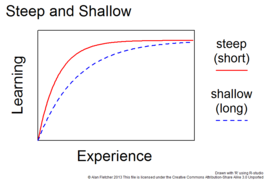 Short and long learning curves
 -
 Product A has lower functionality and a short learning curve. Product B has greater functionality but takes longer to learn.


The term 'learning curve' with meanings of 'easy' and 'difficult' can be described with adjectives like 'short' and 'long' rather than steep and 'shallow'.[2] If two products have similar functionality then the one with a "steep" curve is probably better, because it can be learned in a shorter time. On the other hand, if two products have different functionality, then one with a short curve (a short time to learn) and limited functionality may not be as good as one with a long curve (a long time to learn) and greater functionality.
For example, the Windows program
"On a steep learning curve"
Ben Zimmer discusses the use of the term "on a steep learning curve" in Downton Abbey, a television series set in the early 20th century, concentrating mainly on whether use of the term is an anachronism. "Matthew Crawley, the presumptive heir of Downton Abbey and now the co-owner of the estate, says, 'I've been on a steep learning curve since arriving at Downton.' By this he means that he has had a difficult time learning the ways of Downton, but people did not start talking that way until the 1970s."[3][34]
Zimmer also comments that the popular use of steep as difficult is a reversal of the technical meaning. He identifies the first use of steep learning curve as 1973, and the arduous interpretation as 1978.
Difficulty curves in video games
The idea of learning curves is often translated into
See also
- Forgetting curve
- Learning speed
- Labor productivity
- Learning-by-doing (economics)
- Population growth
- Trial and error
References
- ^ Compare: "Learning Curve". Business Dictionary. Archived from the original on 14 August 2020. Retrieved 8 December 2018.
Graphical representation of the common sense principle that more one does something the better one gets at it. Learning curve shows the rate of improvement in performing a task as a function of time, or the rate of change in average cost (in hours or money) as a function of cumulative output.
- ^ PMID 16772776., see the "Discussions" section, Dr. Smith's remark about the usage of the term "steep learning curve": "First, semantics. A steep learning curve is one where you gain proficiency over a short number of trials. That means the curve is steep. I think semantically we are really talking about a prolonged or long learning curve. I know it is a subtle distinction, but I can't miss the opportunity to make that point."
- ^ a b c d e Zimmer, Ben (February 8, 2013) A "Steep Learning Curve" for "Downton Abbey". visualthesaurus.com
- ^ )
- ^ a b Hall, Granville Stanley; Titchener, Edward Bradford; Dallenbach, Karl M. (1903). The American Journal of Psychology. Vol. 14. University of Illinois Press.
- ^ doi:10.2514/8.155.
- ^ "Classics in the History of Psychology – Introduction to Ebbinghaus (1885/1913) by R. H. Wozniak". psychclassics.yorku.ca.
- ^ Bills, A.G. (1934). General experimental psychology. Longmans Psychology Series. pp. 192–215. New York: Longmans, Green and Co.
- ^ AIR MATERIEL COMMAND WRIGHT-PATTERSON AFB OH. "Source Book of World War II Basic Data-Airframe Industry. Volume 1. Direct Man-Hours-Progress Curves." (1952): 0201.
- ^ Asher, H. (1956). Cost-quantity relationships in the airframe industry (Doctoral dissertation, The Ohio State University).
- ^ "What is Henderson's Law?". Henderson's Law. Retrieved 2020-06-02.
- ^ Henderson, Bruce (1968-01-01) The Experience Curve. Boston Consulting Group
- ISBN 1-4051-1999-3
- S2CID 61642172
- ^ ISSN 0011-7315.
- ISSN 0169-8141.
- ^ Abernathy, W. J.; Wayne, K. (1974), "Limits of the learning curve", Harvard Business Review, 52 (5): 109–119
- S2CID 154822091
- ISSN 1558-2345.
- ^ Newell, A. (1980) Mechanisms of skill acquisition and the law of practice. University of Southern California
- ISBN 9780080430768
- .
- ^ "Learning Curve Basics" (PDF). Archived from the original (PDF) on 2013-07-18. Retrieved 2013-03-17. U.S. Department of Defense Manual Number 5000.2-M, mandates the use of learning curves for costing of defense programs (variable costs of production)
- ISBN 978-0-387-30768-8.
- ^ Madhavan, P.G. (1997). "A New Recurrent Neural Network Learning Algorithm for Time Series Prediction" (PDF). Journal of Intelligent Systems. p. 113, Fig. 3.
- ^ Singh, Anmol (2021). "Machine learning for astronomy with scikit learning". Learning Curve My Personal Tutor.
- ^ Meek, Christopher; Thiesson, Bo; Heckerman, David (Summer 2002). "The Learning-Curve Sampling Method Applied to Model-Based Clustering" (PDF). Journal of Machine Learning Research. 2 (3): 397.
- JSTOR 258605.
- Bibcode:1988ptw..conf..291P.
- ^ a b "Steep learning curves". 2009-07-16.
- ^ Zimmer, Ben (February 13, 2012) "Downton Abbey" anachronisms: beyond nitpickery, upenn.edu, also Comment by J Oliver : Season Three, episode 5
- Gamasutra. Retrieved February 3, 2020.
- . Retrieved February 3, 2020.
- ISBN 978-0-8173-1737-9.
- ISBN 978-0-429-51601-6.)
{{cite book}}: CS1 maint: multiple names: authors list (link - ISBN 978-1-61520-718-3.
- ISBN 978-1-4800-0575-4.