
List of municipalities in Maryland

townships, areas outside of municipalities have no government below the county level.[4]
With the exception of
Maryland Constitution and state code.[6] Since its separation from Baltimore County in 1851, the City of Baltimore functions more as a county than a city under state law since it exercises charter home rule, which empowers the city with broad legislative authority similar to Maryland's six home rule counties.[7]
The largest municipality by population in Maryland is Baltimore, an independent city, with 585,708 residents, and the smallest municipality by population is Port Tobacco Village with 18 residents.[2] The largest municipality by land area is also Baltimore, which spans 80.94 sq mi (209.6 km2), while Brookview is the smallest at 0.04 sq mi (0.10 km2).[2] Many of Maryland's largest population centers, including Columbia, Germantown, Silver Spring, Waldorf, Glen Burnie, Ellicott City, Dundalk and Bethesda, are unincorporated census designated places.[2]
List of municipalities
- Largest municipalities in Maryland by population
-
 Skyline of Baltimore, the largest municipality in Maryland by population
 -
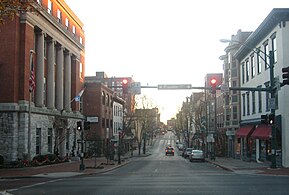
 Frederick, the second-largest municipality in Maryland by population
 -
 Gaithersburg, a suburb of Washington, D.C., and third-largest municipality by population
 -
 Rockville, a suburb of Washington, D.C., and fourth-largest municpiality by population
 -
 Bowie, the fifth-largest municipality in Maryland by population
 -
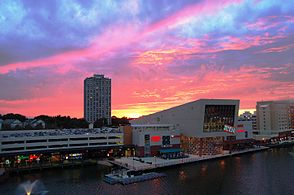
 Hagerstown, Maryland's sixth-largest municipality by population
 -
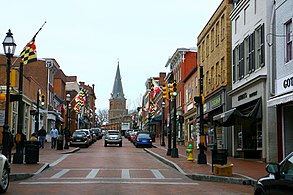 Annapolis, the state's capital and seventh-largest city by population


‡ State capital and county seat
| Name | Type[2] | County(ies)[2] | Population (2020)[8] |
Population (2010)[2] |
Change | Land area (2010)[2] |
Population density | |
|---|---|---|---|---|---|---|---|---|
| sq mi | km2 | |||||||
| Aberdeen | City | Harford |
16,254 | 14,959 | +8.7% | 6.80 | 17.6 | 2,390.3/sq mi (922.9/km2) |
| Accident | Town | Garrett |
338 | 325 | +4.0% | 0.49 | 1.3 | 689.8/sq mi (266.3/km2) |
| Annapolis‡ | City | Anne Arundel |
40,812 | 38,394 | +6.3% | 7.18 | 18.6 | 5,684.1/sq mi (2,194.7/km2) |
Baltimore |
City | — | 585,708 | 620,961 | −5.7% | 80.94 | 209.6 | 7,236.3/sq mi (2,794.0/km2) |
| Barclay | Town | Queen Anne's |
183 | 120 | +52.5% | 0.16 | 0.41 | 1,143.8/sq mi (441.6/km2) |
| Barnesville | Town | Montgomery | 144 | 172 | −16.3% | 0.49 | 1.3 | 293.9/sq mi (113.5/km2) |
| Barton | Town | Allegany | 464 | 457 | +1.5% | 0.22 | 0.57 | 2,109.1/sq mi (814.3/km2) |
Bel Air † |
Town | Harford |
10,661 | 10,120 | +5.3% | 2.93 | 7.6 | 3,638.6/sq mi (1,404.9/km2) |
| Berlin | Town | Worcester | 5,026 | 4,485 | +12.1% | 3.15 | 8.2 | 1,595.6/sq mi (616.0/km2) |
| Berwyn Heights | Town | Prince George's |
3,345 | 3,123 | +7.1% | 0.69 | 1.8 | 4,847.8/sq mi (1,871.8/km2) |
| Betterton | Town | Kent | 286 | 345 | −17.1% | 0.99 | 2.6 | 288.9/sq mi (111.5/km2) |
| Bladensburg | Town | Prince George's |
9,657 | 9,148 | +5.6% | 1.00 | 2.6 | 9,657.0/sq mi (3,728.6/km2) |
| Boonsboro | Town | Washington | 3,799 | 3,336 | +13.9% | 2.90 | 7.5 | 1,310.0/sq mi (505.8/km2) |
| Bowie | City | Prince George's |
58,329 | 54,727 | +6.6% | 18.43 | 47.7 | 3,164.9/sq mi (1,222.0/km2) |
| Brentwood | Town | Prince George's |
3,828 | 3,046 | +25.7% | 0.38 | 0.98 | 10,073.7/sq mi (3,889.5/km2) |
| Brookeville | Town | Montgomery | 166 | 134 | +23.9% | 0.12 | 0.31 | 1,383.3/sq mi (534.1/km2) |
| Brookview | Town | Dorchester | 48 | 60 | −20.0% | 0.04 | 0.10 | 1,200.0/sq mi (463.3/km2) |
| Brunswick | City | Frederick | 7,762 | 5,870 | +32.2% | 3.26 | 8.4 | 2,381.0/sq mi (919.3/km2) |
| Burkittsville | Town | Frederick | 142 | 151 | −6.0% | 0.45 | 1.2 | 315.6/sq mi (121.8/km2) |
| Cambridge† | City | Dorchester | 13,096 | 12,326 | +6.2% | 10.34 | 26.8 | 1,266.5/sq mi (489.0/km2) |
| Capitol Heights | Town | Prince George's |
4,050 | 4,337 | −6.6% | 0.80 | 2.1 | 5,062.5/sq mi (1,954.6/km2) |
| Cecilton | Town | Cecil |
676 | 663 | +2.0% | 0.46 | 1.2 | 1,469.6/sq mi (567.4/km2) |
| Centreville† | Town | Queen Anne's |
4,727 | 4,285 | +10.3% | 2.45 | 6.3 | 1,929.4/sq mi (744.9/km2) |
| Charlestown | Town | Cecil |
1,496 | 1,183 | +26.5% | 1.19 | 3.1 | 1,257.1/sq mi (485.4/km2) |
| Chesapeake Beach | Town | Calvert |
6,356 | 5,753 | +10.5% | 2.71 | 7.0 | 2,345.4/sq mi (905.6/km2) |
| Chesapeake City | Town | Cecil |
736 | 673 | +9.4% | 0.50 | 1.3 | 1,472.0/sq mi (568.3/km2) |
| Chestertown† | Town | Kent | 5,532 | 5,252 | +5.3% | 2.60 | 6.7 | 2,127.7/sq mi (821.5/km2) |
| Cheverly | Town | Prince George's |
6,170 | 6,173 | 0.0% | 1.35 | 3.5 | 4,570.4/sq mi (1,764.6/km2) |
| Chevy Chase | Town | Montgomery | 2,904 | 2,824 | +2.8% | 0.47 | 1.2 | 6,178.7/sq mi (2,385.6/km2) |
| Chevy Chase Section Five | Village | Montgomery | 672 | 658 | +2.1% | 0.10 | 0.26 | 6,720.0/sq mi (2,594.6/km2) |
| Chevy Chase Section Three | Village | Montgomery | 802 | 760 | +5.5% | 0.12 | 0.31 | 6,683.3/sq mi (2,580.4/km2) |
| Chevy Chase View | Town | Montgomery | 1,005 | 920 | +9.2% | 0.28 | 0.73 | 3,589.3/sq mi (1,385.8/km2) |
| Chevy Chase Village | Town | Montgomery | 2,049 | 1,953 | +4.9% | 0.42 | 1.1 | 4,878.6/sq mi (1,883.6/km2) |
| Church Creek | Town | Dorchester | 102 | 125 | −18.4% | 0.34 | 0.88 | 300.0/sq mi (115.8/km2) |
| Church Hill | Town | Queen Anne's |
808 | 745 | +8.5% | 0.71 | 1.8 | 1,138.0/sq mi (439.4/km2) |
| Clear Spring | Town | Washington | 372 | 358 | +3.9% | 0.11 | 0.28 | 3,381.8/sq mi (1,305.7/km2) |
| College Park | City | Prince George's |
34,740 | 30,413 | +14.2% | 5.64 | 14.6 | 6,159.6/sq mi (2,378.2/km2) |
| Colmar Manor | Town | Prince George's |
1,588 | 1,404 | +13.1% | 0.47 | 1.2 | 3,378.7/sq mi (1,304.5/km2) |
| Cottage City | Town | Prince George's |
1,335 | 1,305 | +2.3% | 0.25 | 0.65 | 5,340.0/sq mi (2,061.8/km2) |
| Crisfield | City | Somerset | 2,475 | 2,726 | −9.2% | 1.62 | 4.2 | 1,527.8/sq mi (589.9/km2) |
| Cumberland† | City | Allegany | 19,076 | 20,859 | −8.5% | 10.08 | 26.1 | 1,892.5/sq mi (730.7/km2) |
| Deer Park | Town | Garrett |
303 | 399 | −24.1% | 1.00 | 2.6 | 303.0/sq mi (117.0/km2) |
| Delmar | Town | Wicomico |
3,798 | 3,003 | +26.5% | 1.72 | 4.5 | 2,208.1/sq mi (852.6/km2) |
| Denton† | Town | Caroline | 4,848 | 4,418 | +9.7% | 5.28 | 13.7 | 918.2/sq mi (354.5/km2) |
| District Heights | City | Prince George's |
5,959 | 5,837 | +2.1% | 0.93 | 2.4 | 6,407.5/sq mi (2,474.0/km2) |
| Eagle Harbor | Town | Prince George's |
67 | 63 | +6.3% | 0.12 | 0.31 | 558.3/sq mi (215.6/km2) |
| East New Market | Town | Dorchester | 389 | 400 | −2.7% | 0.40 | 1.0 | 972.5/sq mi (375.5/km2) |
| Easton† | Town | Talbot | 17,101 | 15,945 | +7.2% | 10.56 | 27.4 | 1,619.4/sq mi (625.3/km2) |
| Edmonston | Town | Prince George's |
1,617 | 1,445 | +11.9% | 0.39 | 1.0 | 4,146.2/sq mi (1,600.8/km2) |
| Eldorado | Town | Dorchester | 45 | 59 | −23.7% | 0.08 | 0.21 | 562.5/sq mi (217.2/km2) |
| Elkton† | Town | Cecil |
15,807 | 15,443 | +2.4% | 8.35 | 21.6 | 1,893.1/sq mi (730.9/km2) |
| Emmitsburg | Town | Frederick | 2,770 | 2,814 | −1.6% | 1.52 | 3.9 | 1,822.4/sq mi (703.6/km2) |
| Fairmount Heights | Town | Prince George's |
1,528 | 1,494 | +2.3% | 0.27 | 0.70 | 5,659.3/sq mi (2,185.1/km2) |
| Federalsburg | Town | Caroline | 2,833 | 2,739 | +3.4% | 1.93 | 5.0 | 1,467.9/sq mi (566.7/km2) |
| Forest Heights | Town | Prince George's |
2,658 | 2,447 | +8.6% | 0.48 | 1.2 | 5,537.5/sq mi (2,138.0/km2) |
| Frederick† | City | Frederick | 78,171 | 65,239 | +19.8% | 21.99 | 57.0 | 3,554.8/sq mi (1,372.5/km2) |
| Friendsville | Town | Garrett |
438 | 491 | −10.8% | 0.91 | 2.4 | 481.3/sq mi (185.8/km2) |
| Frostburg | City | Allegany | 7,027 | 9,002 | −21.9% | 3.42 | 8.9 | 2,054.7/sq mi (793.3/km2) |
| Fruitland | City | Wicomico |
5,534 | 4,866 | +13.7% | 3.78 | 9.8 | 1,464.0/sq mi (565.3/km2) |
| Funkstown | Town | Washington | 852 | 904 | −5.8% | 0.36 | 0.93 | 2,366.7/sq mi (913.8/km2) |
| Gaithersburg | City | Montgomery | 69,657 | 59,933 | +16.2% | 10.20 | 26.4 | 6,829.1/sq mi (2,636.7/km2) |
| Galena | Town | Kent | 539 | 612 | −11.9% | 0.36 | 0.93 | 1,497.2/sq mi (578.1/km2) |
| Galestown | Town | Dorchester | 111 | 138 | −19.6% | 0.23 | 0.60 | 482.6/sq mi (186.3/km2) |
| Garrett Park | Town | Montgomery | 996 | 992 | +0.4% | 0.26 | 0.67 | 3,830.8/sq mi (1,479.1/km2) |
| Glenarden | City | Prince George's |
6,402 | 6,000 | +6.7% | 1.22 | 3.2 | 5,247.5/sq mi (2,026.1/km2) |
| Glen Echo | Town | Montgomery | 279 | 255 | +9.4% | 0.10 | 0.26 | 2,790.0/sq mi (1,077.2/km2) |
| Goldsboro | Town | Caroline | 211 | 246 | −14.2% | 0.74 | 1.9 | 285.1/sq mi (110.1/km2) |
| Grantsville | Town | Garrett |
968 | 766 | +26.4% | 0.98 | 2.5 | 987.8/sq mi (381.4/km2) |
| Greenbelt | City | Prince George's |
24,921 | 23,068 | +8.0% | 6.28 | 16.3 | 3,968.3/sq mi (1,532.2/km2) |
| Greensboro | Town | Caroline | 1,919 | 1,931 | −0.6% | 1.05 | 2.7 | 1,827.6/sq mi (705.6/km2) |
| Hagerstown† | City | Washington | 43,527 | 39,662 | +9.7% | 11.79 | 30.5 | 3,691.9/sq mi (1,425.4/km2) |
| Hampstead | Town | Carroll | 6,241 | 6,323 | −1.3% | 3.19 | 8.3 | 1,956.4/sq mi (755.4/km2) |
| Hancock | Town | Washington | 1,557 | 1,545 | +0.8% | 2.73 | 7.1 | 570.3/sq mi (220.2/km2) |
| Havre de Grace | City | Harford |
14,807 | 12,952 | +14.3% | 5.50 | 14.2 | 2,692.2/sq mi (1,039.5/km2) |
| Hebron | Town | Wicomico |
1,113 | 1,084 | +2.7% | 1.28 | 3.3 | 869.5/sq mi (335.7/km2) |
| Henderson | Town | Caroline | 160 | 146 | +9.6% | 0.13 | 0.34 | 1,230.8/sq mi (475.2/km2) |
| Highland Beach | Town | Anne Arundel |
118 | 96 | +22.9% | 0.06 | 0.16 | 1,966.7/sq mi (759.3/km2) |
| Hillsboro | Town | Caroline | 128 | 161 | −20.5% | 0.15 | 0.39 | 853.3/sq mi (329.5/km2) |
| Hurlock | Town | Dorchester | 2,070 | 2,092 | −1.1% | 2.66 | 6.9 | 778.2/sq mi (300.5/km2) |
| Hyattsville | City | Prince George's |
21,187 | 17,557 | +20.7% | 2.67 | 6.9 | 7,935.2/sq mi (3,063.8/km2) |
| Indian Head | Town | Charles |
3,894 | 3,844 | +1.3% | 1.23 | 3.2 | 3,165.9/sq mi (1,222.3/km2) |
| Keedysville | Town | Washington | 1,213 | 1,152 | +5.3% | 0.92 | 2.4 | 1,318.5/sq mi (509.1/km2) |
| Kensington | Town | Montgomery | 2,122 | 2,213 | −4.1% | 0.48 | 1.2 | 4,420.8/sq mi (1,706.9/km2) |
| Kitzmiller | Town | Garrett |
300 | 321 | −6.5% | 0.22 | 0.57 | 1,363.6/sq mi (526.5/km2) |
| Landover Hills | Town | Prince George's |
1,815 | 1,687 | +7.6% | 0.30 | 0.78 | 6,050.0/sq mi (2,335.9/km2) |
| La Plata† | Town | Charles |
10,159 | 8,753 | +16.1% | 7.40 | 19.2 | 1,372.8/sq mi (530.1/km2) |
| Laurel | City | Prince George's |
30,060 | 25,115 | +19.7% | 4.30 | 11.1 | 6,990.7/sq mi (2,699.1/km2) |
| Laytonsville | Town | Montgomery | 572 | 353 | +62.0% | 1.04 | 2.7 | 550.0/sq mi (212.4/km2) |
| Leonardtown† | Town | St. Mary's | 4,563 | 2,930 | +55.7% | 3.18 | 8.2 | 1,434.9/sq mi (554.0/km2) |
| Loch Lynn Heights | Town | Garrett |
493 | 552 | −10.7% | 0.32 | 0.83 | 1,540.6/sq mi (594.8/km2) |
| Lonaconing | Town | Allegany | 1,001 | 1,214 | −17.5% | 0.41 | 1.1 | 2,441.5/sq mi (942.7/km2) |
| Luke | Town | Allegany | 85 | 65 | +30.8% | 0.27 | 0.70 | 314.8/sq mi (121.6/km2) |
| Manchester | Town | Carroll | 5,408 | 4,808 | +12.5% | 2.34 | 6.1 | 2,311.1/sq mi (892.3/km2) |
| Mardela Springs | Town | Wicomico |
357 | 347 | +2.9% | 0.39 | 1.0 | 915.4/sq mi (353.4/km2) |
| Martin's Additions | Village | Montgomery | 946 | 933 | +1.4% | 0.14 | 0.36 | 6,757.1/sq mi (2,608.9/km2) |
| Marydel | Town | Caroline | 176 | 141 | +24.8% | 0.08 | 0.21 | 2,200.0/sq mi (849.4/km2) |
| Middletown | Town | Frederick | 4,943 | 4,136 | +19.5% | 1.74 | 4.5 | 2,840.8/sq mi (1,096.8/km2) |
| Midland | Town | Allegany | 488 | 446 | +9.4% | 0.19 | 0.49 | 2,568.4/sq mi (991.7/km2) |
| Millington | Town | Queen Anne's |
549 | 642 | −14.5% | 0.66 | 1.7 | 831.8/sq mi (321.2/km2) |
| Morningside | Town | Prince George's |
1,240 | 2,015 | −38.5% | 0.56 | 1.5 | 2,214.3/sq mi (854.9/km2) |
| Mountain Lake Park | Town | Garrett |
2,147 | 2,092 | +2.6% | 1.94 | 5.0 | 1,106.7/sq mi (427.3/km2) |
| Mount Airy | Town | Carroll, Frederick | 9,654 | 9,288 | +3.9% | 4.12 | 10.7 | 2,343.2/sq mi (904.7/km2) |
| Mount Rainier | City | Prince George's |
8,333 | 8,080 | +3.1% | 0.65 | 1.7 | 12,820.0/sq mi (4,949.8/km2) |
| Myersville | Town | Frederick | 1,748 | 1,626 | +7.5% | 1.02 | 2.6 | 1,713.7/sq mi (661.7/km2) |
| New Carrollton | City | Prince George's |
13,715 | 12,135 | +13.0% | 1.53 | 4.0 | 8,964.1/sq mi (3,461.0/km2) |
| New Market | Town | Frederick | 1,525 | 656 | +132.5% | 0.80 | 2.1 | 1,906.3/sq mi (736.0/km2) |
| New Windsor | Town | Carroll | 1,441 | 1,396 | +3.2% | 0.74 | 1.9 | 1,947.3/sq mi (751.9/km2) |
| North Beach | Town | Calvert |
2,146 | 1,978 | +8.5% | 0.33 | 0.85 | 6,503.0/sq mi (2,510.8/km2) |
| North Brentwood | Town | Prince George's |
593 | 517 | +14.7% | 0.10 | 0.26 | 5,930.0/sq mi (2,289.6/km2) |
| North Chevy Chase | Village | Montgomery | 682 | 519 | +31.4% | 0.11 | 0.28 | 6,200.0/sq mi (2,393.8/km2) |
| North East | Town | Cecil |
4,085 | 3,572 | +14.4% | 2.06 | 5.3 | 1,983.0/sq mi (765.6/km2) |
| Oakland† | Town | Garrett |
1,851 | 1,925 | −3.8% | 2.59 | 6.7 | 714.7/sq mi (275.9/km2) |
| Ocean City | Town | Worcester | 6,844 | 7,102 | −3.6% | 4.41 | 11.4 | 1,551.9/sq mi (599.2/km2) |
| Oxford | Town | Talbot | 611 | 651 | −6.1% | 0.54 | 1.4 | 1,131.5/sq mi (436.9/km2) |
| Perryville | Town | Cecil |
4,391 | 4,361 | +0.7% | 3.05 | 7.9 | 1,439.7/sq mi (555.9/km2) |
| Pittsville | Town | Wicomico |
1,636 | 1,417 | +15.5% | 1.68 | 4.4 | 973.8/sq mi (376.0/km2) |
| Pocomoke City | City | Worcester | 4,295 | 4,184 | +2.7% | 3.69 | 9.6 | 1,164.0/sq mi (449.4/km2) |
| Poolesville | Town | Montgomery | 5,742 | 4,883 | +17.6% | 3.93 | 10.2 | 1,461.1/sq mi (564.1/km2) |
| Port Deposit | Town | Cecil |
614 | 653 | −6.0% | 2.27 | 5.9 | 270.5/sq mi (104.4/km2) |
| Port Tobacco Village | Town | Charles |
18 | 13 | +38.5% | 0.16 | 0.41 | 112.5/sq mi (43.4/km2) |
| Preston | Town | Caroline | 673 | 719 | −6.4% | 0.57 | 1.5 | 1,180.7/sq mi (455.9/km2) |
| Princess Anne† | Town | Somerset | 3,446 | 3,290 | +4.7% | 1.67 | 4.3 | 2,063.5/sq mi (796.7/km2) |
| Queen Anne | Town | Queen Anne's, Talbot |
192 | 222 | −13.5% | 0.13 | 0.34 | 1,476.9/sq mi (570.2/km2) |
| Queenstown | Town | Queen Anne's |
705 | 664 | +6.2% | 1.45 | 3.8 | 486.2/sq mi (187.7/km2) |
| Ridgely | Town | Caroline | 1,611 | 1,639 | −1.7% | 1.78 | 4.6 | 905.1/sq mi (349.4/km2) |
| Rising Sun | Town | Cecil |
2,740 | 2,781 | −1.5% | 1.26 | 3.3 | 2,174.6/sq mi (839.6/km2) |
| Riverdale Park | Town | Prince George's |
7,351 | 6,956 | +5.7% | 1.65 | 4.3 | 4,455.2/sq mi (1,720.1/km2) |
| Rock Hall | Town | Kent | 1,198 | 1,310 | −8.5% | 1.34 | 3.5 | 894.0/sq mi (345.2/km2) |
| Rockville† | City | Montgomery | 67,117 | 61,209 | +9.7% | 13.51 | 35.0 | 4,967.9/sq mi (1,918.1/km2) |
| Rosemont | Village | Frederick | 272 | 294 | −7.5% | 0.56 | 1.5 | 485.7/sq mi (187.5/km2) |
St. Michaels |
Town | Talbot | 1,049 | 1,029 | +1.9% | 1.15 | 3.0 | 912.2/sq mi (352.2/km2) |
| Salisbury† | City | Wicomico |
33,050 | 30,343 | +8.9% | 13.40 | 34.7 | 2,466.4/sq mi (952.3/km2) |
| Seat Pleasant | City | Prince George's |
4,522 | 4,542 | −0.4% | 0.73 | 1.9 | 6,194.5/sq mi (2,391.7/km2) |
| Secretary | Town | Dorchester | 472 | 535 | −11.8% | 0.26 | 0.67 | 1,815.4/sq mi (700.9/km2) |
| Sharpsburg | Town | Washington | 560 | 705 | −20.6% | 0.23 | 0.60 | 2,434.8/sq mi (940.1/km2) |
| Sharptown | Town | Wicomico |
691 | 651 | +6.1% | 0.41 | 1.1 | 1,685.4/sq mi (650.7/km2) |
| Smithsburg | Town | Washington | 2,977 | 2,975 | +0.1% | 1.05 | 2.7 | 2,835.2/sq mi (1,094.7/km2) |
| Snow Hill† | Town | Worcester | 2,156 | 2,103 | +2.5% | 3.01 | 7.8 | 716.3/sq mi (276.6/km2) |
| Somerset | Town | Montgomery | 1,187 | 1,216 | −2.4% | 0.27 | 0.70 | 4,396.3/sq mi (1,697.4/km2) |
| Sudlersville | Town | Queen Anne's |
507 | 497 | +2.0% | 0.94 | 2.4 | 539.4/sq mi (208.2/km2) |
| Sykesville | Town | Carroll | 4,316 | 4,436 | −2.7% | 1.58 | 4.1 | 2,731.6/sq mi (1,054.7/km2) |
| Takoma Park | City | Montgomery | 17,629 | 16,715 | +5.5% | 2.08 | 5.4 | 8,475.5/sq mi (3,272.4/km2) |
| Taneytown | City | Carroll | 7,234 | 6,728 | +7.5% | 3.03 | 7.8 | 2,387.5/sq mi (921.8/km2) |
| Templeville | Town | Queen Anne's |
113 | 138 | −18.1% | 0.08 | 0.21 | 1,412.5/sq mi (545.4/km2) |
| Thurmont | Town | Frederick | 6,213 | 6,170 | +0.7% | 3.12 | 8.1 | 1,991.3/sq mi (768.9/km2) |
| Trappe | Town | Talbot | 1,177 | 1,077 | +9.3% | 2.78 | 7.2 | 423.4/sq mi (163.5/km2) |
| Union Bridge | Town | Carroll | 936 | 975 | −4.0% | 1.04 | 2.7 | 900.0/sq mi (347.5/km2) |
| University Park | Town | Prince George's |
2,454 | 2,548 | −3.7% | 0.50 | 1.3 | 4,908.0/sq mi (1,895.0/km2) |
| Upper Marlboro† | Town | Prince George's |
652 | 631 | +3.3% | 0.40 | 1.0 | 1,630.0/sq mi (629.3/km2) |
| Vienna | Town | Dorchester | 270 | 271 | −0.4% | 0.19 | 0.49 | 1,421.1/sq mi (548.7/km2) |
| Walkersville | Town | Frederick | 6,156 | 5,800 | +6.1% | 4.35 | 11.3 | 1,415.2/sq mi (546.4/km2) |
| Washington Grove | Town | Montgomery | 505 | 555 | −9.0% | 0.35 | 0.91 | 1,442.9/sq mi (557.1/km2) |
| Westernport | Town | Allegany | 1,812 | 1,888 | −4.0% | 0.87 | 2.3 | 2,082.8/sq mi (804.2/km2) |
| Westminster† | City | Carroll | 20,126 | 18,590 | +8.3% | 6.63 | 17.2 | 3,035.6/sq mi (1,172.1/km2) |
| Willards | Town | Wicomico |
963 | 958 | +0.5% | 1.07 | 2.8 | 900.0/sq mi (347.5/km2) |
| Williamsport | Town | Washington | 2,083 | 2,137 | −2.5% | 1.04 | 2.7 | 2,002.9/sq mi (773.3/km2) |
| Woodsboro | Town | Frederick | 1,092 | 1,141 | −4.3% | 0.71 | 1.8 | 1,538.0/sq mi (593.8/km2) |
| Total | — | — | 1,555,037 | 1,511,348 | +2.9% | 425.78 | 1,102.8 | 3,652.2/sq mi (1,410.1/km2) |
See also
Notes
References
- ^ "Census Regions and Divisions of the United States" (PDF). U.S. Census Bureau. Archived from the original (PDF) on June 17, 2016. Retrieved June 9, 2016.
- ^ 2010 United States Census. United States Census Bureau. Archived from the originalon February 13, 2020. Retrieved June 17, 2016.
- 2010 United States Census. United States Census Bureau. September 2012. p. 18. Retrieved August 6, 2016.
- ^ Scarr, Harry (November 1994). "Chapter 8". Geographic areas reference manual (PDF). Washington, D.C.: U.S. Dept. of Commerce, Economics and Statistics Administration, Bureau of the Census.
- ^ Maryland Legislature. "Appendix F - Article 23A of the Maryland State Code "Corporations-Municipal"". State of Maryland Department of Legislative Services. Retrieved August 23, 2016.
- ^ a b c Burrell, Linda M.; Best, Kevin J.; Liskey, Karen A.; Rocker, Patricia A., eds. (July 1, 2000). Maryland's 157: The Incorporated Cities and Towns. Annapolis, MD: Maryland Municipal League. p. 3.
- ^ Burrell, Linda M.; Best, Kevin J.; Liskey, Karen A.; Rocker, Patricia A., eds. (July 1, 2000). Maryland's 157: The Incorporated Cities and Towns. Annapolis, MD: Maryland Municipal League. p. 5.
- ^ "Explore Census Data".
External links
Wikimedia Commons has media related to Municipalities in Maryland.
- Local government: Municipalities. (2007). Maryland Manual On-Line. State of Maryland Archives. Retrieved on August 7, 2016.