
Marion County, Georgia
Marion County | |
|---|---|
UTC−4 (EDT) | |
| Congressional district | 2nd |
| Website | www |
Marion County is a
General Francis Marion of South Carolina.[3]
Marion County is included in the
metropolitan statistical area
.
The art site of Pasaquan is located in Marion County.
Geography
According to the
U.S. Census Bureau, the county has a total area of 367 square miles (950 km2), of which 366 square miles (950 km2) is land and 1.5 square miles (3.9 km2) (0.4%) is water.[4]
The southern half of Marion County, roughly south of
Flint River sub-basin of the same larger ACF River Basin.[5]
Major highways
 State Route 26
 State Route 30
 State Route 41
- State Route 41 Connector
 State Route 127
 State Route 137
- State Route 137 Spur
 State Route 153
 State Route 240
- State Route 240 Connector
 State Route 352
 State Route 355
Adjacent counties
- Talbot County (north)
- Taylor County (northeast)
- Schley County (east)
- Sumter County (southeast)
- Webster County (south)
- Chattahoochee County (west)
Communities
City
- Buena Vista (county seat)
Census-designated place
Unincorporated communities
Demographics
| Census | Pop. | Note | %± |
|---|---|---|---|
| 1830 | 1,436 | — | |
| 1840 | 4,812 | 235.1% | |
| 1850 | 10,280 | 113.6% | |
| 1860 | 7,390 | −28.1% | |
| 1870 | 8,000 | 8.3% | |
| 1880 | 8,598 | 7.5% | |
| 1890 | 7,728 | −10.1% | |
| 1900 | 10,080 | 30.4% | |
| 1910 | 9,147 | −9.3% | |
| 1920 | 7,604 | −16.9% | |
| 1930 | 6,968 | −8.4% | |
| 1940 | 6,954 | −0.2% | |
| 1950 | 6,521 | −6.2% | |
| 1960 | 5,477 | −16.0% | |
| 1970 | 5,099 | −6.9% | |
| 1980 | 5,297 | 3.9% | |
| 1990 | 5,590 | 5.5% | |
| 2000 | 7,144 | 27.8% | |
| 2010 | 8,742 | 22.4% | |
| 2020 | 7,498 | −14.2% | |
| 2023 (est.) | 7,440 | [6] | −0.8% |
| U.S. Decennial Census[7] 1790-1880[8] 1890-1910[9] 1920-1930[10] 1930-1940[11] 1940-1950[12] 1960-1980[13] 1980-2000[14] 2010[15] | |||
| Race | Num. | Perc. |
|---|---|---|
White (non-Hispanic)
|
4,486 | 59.83% |
Black or African American (non-Hispanic)
|
2,122 | 28.3% |
Native American
|
12 | 0.16% |
Asian
|
55 | 0.73% |
Pacific Islander
|
15 | 0.2% |
Other/Mixed
|
248 | 3.31% |
Latino
|
560 | 7.47% |
As of the 2020 United States census, there were 7,498 people, 3,408 households, and 2,396 families residing in the county.
Education
The Marion County School District contains a primary school and a secondary school that serves students from preschool to grade 12.[17]
Politics
As with most Solid South counties, Marion County was dominated by the Democratic Party presidential level until 1964. Starting with the 2000s, the county has become consistently Republican at the presidential level, though by smaller margins than many rural counties in Georgia.
| Year | Republican | Democratic | Third party | |||
|---|---|---|---|---|---|---|
| No. | % | No. | % | No. | % | |
| 2020 | 2,275 | 62.74% | 1,312 | 36.18% | 39 | 1.08% |
| 2016 | 1,921 | 60.22% | 1,213 | 38.03% | 56 | 1.76% |
| 2012 | 1,733 | 54.51% | 1,412 | 44.42% | 34 | 1.07% |
| 2008 | 1,772 | 55.58% | 1,381 | 43.32% | 35 | 1.10% |
| 2004 | 1,670 | 56.48% | 1,275 | 43.12% | 12 | 0.41% |
| 2000 | 1,187 | 54.35% | 982 | 44.96% | 15 | 0.69% |
| 1996 | 678 | 37.23% | 977 | 53.65% | 166 | 9.12% |
| 1992 | 711 | 34.58% | 1,145 | 55.69% | 200 | 9.73% |
| 1988 | 804 | 48.67% | 844 | 51.09% | 4 | 0.24% |
| 1984 | 846 | 47.08% | 951 | 52.92% | 0 | 0.00% |
| 1980 | 567 | 31.98% | 1,174 | 66.22% | 32 | 1.80% |
| 1976 | 291 | 18.13% | 1,314 | 81.87% | 0 | 0.00% |
| 1972 | 850 | 83.83% | 164 | 16.17% | 0 | 0.00% |
| 1968 | 186 | 14.51% | 247 | 19.27% | 849 | 66.22% |
| 1964 | 719 | 66.27% | 365 | 33.64% | 1 | 0.09% |
| 1960 | 154 | 19.27% | 645 | 80.73% | 0 | 0.00% |
| 1956 | 158 | 20.36% | 618 | 79.64% | 0 | 0.00% |
| 1952 | 182 | 21.85% | 651 | 78.15% | 0 | 0.00% |
| 1948 | 45 | 8.32% | 283 | 52.31% | 213 | 39.37% |
| 1944 | 70 | 12.26% | 501 | 87.74% | 0 | 0.00% |
| 1940 | 77 | 11.27% | 605 | 88.58% | 1 | 0.15% |
| 1936 | 62 | 12.84% | 420 | 86.96% | 1 | 0.21% |
| 1932 | 24 | 5.01% | 455 | 94.99% | 0 | 0.00% |
| 1928 | 114 | 23.80% | 365 | 76.20% | 0 | 0.00% |
| 1924 | 31 | 9.66% | 272 | 84.74% | 18 | 5.61% |
| 1920 | 180 | 43.27% | 236 | 56.73% | 0 | 0.00% |
| 1916 | 96 | 20.51% | 330 | 70.51% | 42 | 8.97% |
| 1912 | 41 | 13.85% | 240 | 81.08% | 15 | 5.07% |
See also
 State of Georgia portal
References
- ^ "Census - Geography Profile: Marion County, Georgia". United States Census Bureau. Retrieved December 27, 2022.
- ^ "Find a County". National Association of Counties. Retrieved June 7, 2011.
- ^ Gannett, Henry (1905). The Origin of Certain Place Names in the United States. U.S. Government Printing Office. p. 200.
- ^ "US Gazetteer files: 2010, 2000, and 1990". United States Census Bureau. February 12, 2011. Retrieved April 23, 2011.
- ^ "Georgia Soil and Water Conservation Commission Interactive Mapping Experience". Georgia Soil and Water Conservation Commission. Retrieved November 22, 2015.
- ^ "Annual Estimates of the Resident Population for Counties: April 1, 2020 to July 1, 2023". United States Census Bureau. Retrieved March 31, 2024.
- ^ "Decennial Census of Population and Housing by Decades". United States Census Bureau.
- ^ "1880 Census Population by Counties 1790-1800" (PDF). United States Census Bureau. 1880.
- ^ "1910 Census of Population - Georgia" (PDF). United States Census Bureau. 1910.
- ^ "1930 Census of Population - Georgia" (PDF). United States Census Bureau. 1930.
- ^ "1940 Census of Population - Georgia" (PDF). United States Census Bureau. 1940.
- ^ "1950 Census of Population - Georgia -" (PDF). United States Census Bureau. 1950.
- ^ "1980 Census of Population - Number of Inhabitants - Georgia" (PDF). United States Census Bureau. 1980.
- ^ "2000 Census of Population - Population and Housing Unit Counts - Georgia" (PDF). United States Census Bureau. 2000.
- ^ "State & County QuickFacts". United States Census Bureau. Archived from the original on June 7, 2011. Retrieved June 24, 2014.
- ^ "Explore Census Data". data.census.gov. Retrieved December 18, 2021.
- ^ "Marion County Schools". www.marion.k12.ga.us. Retrieved July 15, 2019.
- ^ Leip, David. "Dave Leip's Atlas of U.S. Presidential Elections". uselectionatlas.org. Retrieved March 22, 2018.
Places adjacent to Marion County, Georgia | ||||||||||||||||
|---|---|---|---|---|---|---|---|---|---|---|---|---|---|---|---|---|
| ||||||||||||||||
Municipalities and communities of Marion County, Georgia, United States | ||
|---|---|---|
| City | 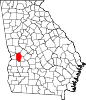 | |
| CDP | ||
| Other unincorporated communities | ||
| ||
| Central cities/largest cities |  Columbus, Georgia Metropolitan Statistical Area Auburn, Alabama Metropolitan Statistical Area Tuskegee, Alabama Micropolitan Statistical Area (defunct) | |
|---|---|---|
| Cities in Georgia | ||
| Cities in Alabama | ||
| Counties in Georgia | ||
| Counties in Alabama | ||
| International | |
|---|---|
| National | |
| Other | |