
Diagnosis of myocardial infarction
| Myocardial infarction diagnosis | |
|---|---|
| Purpose | Diagnose myocardial infarct via physical exam and EKG (plus blood test) |
A diagnosis of myocardial infarction is created by integrating the history of the presenting illness and physical examination with
A
Diagnostic criteria
According to the WHO criteria as revised in 2000,[6] a cardiac troponin rise accompanied by either typical symptoms, pathological Q waves, ST elevation or depression or coronary intervention are diagnostic of MI.
Previous WHO criteria[7] formulated in 1979 put less emphasis on cardiac biomarkers; according to these, a patient is diagnosed with myocardial infarction if two (probable) or three (definite) of the following criteria are satisfied:
- Clinical history of ischaemic type chest pain lasting for more than 20 minutes
- Changes in serial ECG tracings
- Rise and fall of serum cardiac biomarkers such as creatine kinase-MB fraction and troponin
Physical examination
The general appearance of patients may vary according to the experienced symptoms; the patient may be comfortable, or restless and in severe distress with an increased
: 1444If heart failure ensues, elevated
: 1450Electrocardiogram
The primary purpose of the
The 12 lead ECG is used to classify patients into one of three groups:[11]
- those with ST segment elevation or new bundle branch block (suspicious for acute injury and a possible candidate for acute reperfusion therapy with thrombolytics or primary PCI),
- those with ST segment depression or T wave inversion (suspicious for ischemia), and
- those with a so-called non-diagnostic or normal ECG.
A normal ECG does not rule out acute myocardial infarction. Mistakes in interpretation are relatively common, and the failure to identify high risk features has a negative effect on the quality of patient care.[12]
It should be determined if a person is at high risk for myocardial infarction before conducting imaging tests to make a diagnosis.[13] People who have a normal ECG and who are able to exercise, for example, do not merit routine imaging.[13] Imaging tests such as stress radionuclide myocardial perfusion imaging or stress echocardiography can confirm a diagnosis when a person's history, physical exam, ECG and cardiac biomarkers suggest the likelihood of a problem.[13]
Cardiac markers
Cardiac markers or cardiac enzymes are proteins that leak out of injured myocardial cells through their damaged cell membranes into the bloodstream. Until the 1980s, the enzymes SGOT and LDH were used to assess cardiac injury. Now, the markers most widely used in detection of MI are MB subtype of the enzyme creatine kinase and cardiac troponins T and I as they are more specific for myocardial injury. The cardiac troponins T and I which are released within 4–6 hours of an attack of MI and remain elevated for up to 2 weeks, have nearly complete tissue specificity and are now the preferred markers for assessing myocardial damage.[14] Heart-type fatty acid binding protein is another marker, used in some home test kits. Elevated troponins in the setting of chest pain may accurately predict a high likelihood of a myocardial infarction in the near future.[15] New markers such as glycogen phosphorylase isoenzyme BB are under investigation.[16] Note that only the cardiac troponins are used clinically for myocardial infarction as creatine kinase adds little value in diagnosing MI while adding to system cost.[17][18][19]
The diagnosis of myocardial infarction requires two out of three components (history, ECG, and enzymes). When damage to the heart occurs, levels of cardiac markers rise over time, which is why blood tests for them are taken over a 24-hour period. Because these enzyme levels are not elevated immediately following a heart attack, patients presenting with chest pain are generally treated with the assumption that a myocardial infarction has occurred and then evaluated for a more precise diagnosis.[20]
Angiography
In difficult cases or in situations where intervention to restore blood flow is appropriate, coronary angiography can be performed. A catheter is inserted into an artery (typically the radial or femoral artery[21]) and pushed to the vessels supplying the heart. A radio-opaque dye is administered through the catheter and a sequence of x-rays (fluoroscopy) is performed. Obstructed or narrowed arteries can be identified, and angioplasty applied as a therapeutic measure (see below). Angioplasty requires extensive skill, especially in emergency settings. It is performed by a physician trained in interventional cardiology.[citation needed]
Histopathology

-
 A one-week-old myocardial infarction of the posterior left ventricle, with focal rupture, in fresh state (left) and after formalin fixation (right). The infarcted area is pale whereas the rupture is hemorrhagic (dark red).
 -
 Cross-section of the heart, showing an old myocardial infarction of the posterior wall of the left ventricle (seen as pale areas).


Under the microscope, myocardial infarction presents as a circumscribed area of ischemic, coagulative necrosis (cell death). On gross examination, the infarct is not identifiable within the first 12 hours.[22]
Although earlier changes can be discerned using
These features can be recognized in cases where the perfusion was not restored; reperfused infarcts can have other hallmarks, such as contraction band necrosis.[25]
These tables gives an overview of the histopathology seen in myocardial infarction by time after obstruction.[citation needed]
By individual parameters
| Myocardial histologic parameters (HE staining)[26] | Earliest manifestation[26] | Full development[26] | Decrease/disappearance[26] | Image |
|---|---|---|---|---|
| Stretched/wavy fibres | 1–2 h | 
| ||
cytoplasmic hypereosinophilia |
1–3 h | 1–3 days; cytoplasmic hypereosinophilia and loss of striations |
> 3 days: disintegration | 
|
| Interstitial edema | 4–12 h | 
| ||
| Coagulative necrosis: 'nuclear changes' | 12–24 (pyknosis, karyorrhexis) | 1–3 days (loss of nuclei) | Depends on size of infarction | 
|
| Neutrophil infiltration | 12–24 h | 1–3 days | 5–7 days | 
|
| Karyorrhexis of neutrophils | 1.5–2 days | 3–5 days | 
| |
| Macrophages and lymphocytes | 3–5 days | 5–10 days (including 'siderophages') | 10 days to 2 months | 
|
| Vessel/endothelial sprouts* | 5–10 days | 10 days–4 weeks | 4 weeks: disappearance of capillaries; some large dilated vessels persist | 
|
| Fibroblast and young collagen* | 5–10 days | 2–4 weeks | After 4 weeks; depends on size of infarction; | 
|
| Dense fibrosis | 4 weeks | 2–3 months | No | 
|
- Some authors summarize the vascular and early fibrotic changes as 'granulation tissue', which is maximal at 2–3 weeks
Differential diagnoses for myocardial fibrosis:
- Interstitial fibrosis, which is nonspecific, having been described in congestive heart failure, hypertension, and normal aging.[27]
- Subepicardial fibrosis, which is associated with non-infarction diagnoses such as myocarditis[28] and non-ischemic cardiomyopathy.[29]
-
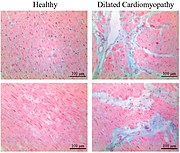 Healthy myocardium versus interstitial fibrosis in dilated cardiomyopathy. Alcian blue stain.
 -
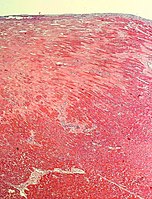 Subepicardial fibrosis (epicardium at top)


Chronological
| Time | Gross examination |
light microscopy
|
|---|---|---|
| 0 - 0.5 hours | None[note 1] | None[note 1] |
| 0.5 – 4 hours | None[note 2] |
|
| 4 – 12 hours |
|
|
| 12 – 24 hours |
|
|
| 1 – 3 days |
|
|
| 3 – 7 days |
|
|
| 7 – 10 days |
|
|
| 10 – 14 days |
|
|
| 2 – 8 weeks |
|
|
| More than 2 months | Completed scarring[note 3] | Dense collagenous scar formed[note 3] |
| If not else specified in boxes, then reference is nr[31] | ||
See also
- Myocardial infarction management
- Myocardial infarction complications
Notes
- ^ a b
For the first ~30 minutes no change at all can be seen by electron microscopyrelaxed myofibrils, as well as glycogen loss and mitochondrial swelling can be observered.
- ^ It is often possible, however, to highlight the area of necrosis that first becomes apparent after 2 to 3 hours by immersion of tissue slices in a solution of triphenyltetrazolium chloride. This dye imparts a brick-red color to intact, noninfarcted myocardium where the dehydrogenase activity is preserved. Because dehydrogenases are depleted in the area of ischemic necrosis (i.e., they leak out through the damaged cell membranes), an infarcted area is revealed as an unstained pale zone. Instead of a triphenyltetrazolium chloride dye, a LDH (lactate dehydrogenase) dye can also be used to visualize an area of necrosis.
- ^ a b Once scarring is completed, there is yet no common method of discerning the actual age of the infarct, since e.g. a scar that is four months old looks identical to a scar that is ten years old.
References
- ^ Mallinson T (2010). "Myocardial Infarction". Focus on First Aid (15): 15. Archived from the original on 2010-05-21. Retrieved 2010-06-08.
- ^ "Myocardial infarction: diagnosis and investigations". GPnotebook. Retrieved 27 November 2006.
- ^ a b Fenton DE, Stahmer S, Baumann DM. McNamara RM, Talavera F, Halamka J, Feied C (eds.). "Myocardial infarction]". eMedicine. Archived from the original on 25 December 2006. Retrieved 27 November 2006.
- ^ "HEART SCAN". University College London. Archived from the original on 16 February 2009. Retrieved 27 November 2006.
- PMID 9885104.
- PMID 10987628.
- PMID 761341.
- ^ a b Garas S, Zafari AM, Garas S. Vanderbush E, Talavera F, Runge MS, Mylonakis E, Zevitz ME (eds.). "Myocardial Infarction". eMedicine. Archived from the original on 11 December 2006. Retrieved 22 November 2006.
- ^ ISBN 0-07-139140-1.
- ISBN 0-89603-552-2.
- PMID 16314375.
- PMID 17015790.
- ^ ABIM Foundation, American Society of Nuclear Cardiology, archived from the original(PDF) on April 16, 2012, retrieved August 17, 2012, which cites
- Hendel RC, Berman DS, Di Carli MF, Heidenreich PA, Henkin RE, Pellikka PA, et al. (June 2009). "ACCF/ASNC/ACR/AHA/ASE/SCCT/SCMR/SNM 2009 Appropriate Use Criteria for Cardiac Radionuclide Imaging: A Report of the American College of Cardiology Foundation Appropriate Use Criteria Task Force, the American Society of Nuclear Cardiology, the American College of Radiology, the American Heart Association, the American Society of Echocardiography, the Society of Cardiovascular Computed Tomography, the Society for Cardiovascular Magnetic Resonance, and the Society of Nuclear Medicine". Journal of the American College of Cardiology. 53 (23): 2201–2229. PMID 19497454.
- Taylor AJ, Cerqueira M, Hodgson JM, Mark D, Min J, O'Gara P, et al. (November 2010). "ACCF/SCCT/ACR/AHA/ASE/ASNC/NASCI/SCAI/SCMR 2010 appropriate use criteria for cardiac computed tomography. A report of the American College of Cardiology Foundation Appropriate Use Criteria Task Force, the Society of Cardiovascular Computed Tomography, the American College of Radiology, the American Heart Association, the American Society of Echocardiography, the American Society of Nuclear Cardiology, the North American Society for Cardiovascular Imaging, the Society for Cardiovascular Angiography and Interventions, and the Society for Cardiovascular Magnetic Resonance". Journal of the American College of Cardiology. 56 (22): 1864–1894. PMID 21087721.
- Anderson JL, Adams CD, Antman EM, Bridges CR, Califf RM, Casey DE, et al. (2007). "ACC/AHA 2007 Guidelines for the Management of Patients with Unstable Angina/Non-ST-Elevation Myocardial Infarction: Executive Summary: A Report of the American College of Cardiology/American Heart Association Task Force on Practice Guidelines (Writing Committee to Revise the 2002 Guidelines for the Management of Patients with Unstable Angina/Non-ST-Elevation Myocardial Infarction): Developed in Collaboration with the American College of Emergency Physicians, the Society for Cardiovascular Angiography and Interventions, and the Society of Thoracic Surgeons: Endorsed by the American Association of Cardiovascular and Pulmonary Rehabilitation and the Society for Academic Emergency Medicine". Circulation. 116 (7): 803. .
- Hendel RC, Berman DS, Di Carli MF, Heidenreich PA, Henkin RE, Pellikka PA, et al. (June 2009). "ACCF/ASNC/ACR/AHA/ASE/SCCT/SCMR/SNM 2009 Appropriate Use Criteria for Cardiac Radionuclide Imaging: A Report of the American College of Cardiology Foundation Appropriate Use Criteria Task Force, the American Society of Nuclear Cardiology, the American College of Radiology, the American Heart Association, the American Society of Echocardiography, the Society of Cardiovascular Computed Tomography, the Society for Cardiovascular Magnetic Resonance, and the Society of Nuclear Medicine". Journal of the American College of Cardiology. 53 (23): 2201–2229.
- S2CID 38481075.
- PMID 12087140.. Summary for laymen
- PMID 15774573.
- PMID 29083808. Retrieved 2024-02-05.
- PMID 31288735.
- PMID 34073539.
- PMID 12383588.
- PMID 29665617.
- ^ ISBN 978-0-7817-4733-2.
- PMID 782705.
- ^ Roy S. "Myocardial infarction". Retrieved 28 November 2006.
- S2CID 23499085.
- ^ PMID 31522288.
- "This article is distributed under the terms of the Creative Commons Attribution 4.0 International License (http://creativecommons.org/licenses/by/4.0/ Archived 2015-11-21 at the Wayback Machine)"
- PMID 31547598.
- PMID 30813942.
- S2CID 54349750.
- ^ Bishop JE, Greenbaum R, Gibson DG, Yacoub M, Laurent GJ. Enhanced deposition of predominantly type I collagen in myocardial disease. J Mol Cell Cardiol. 1990;22:1157–1165
- ISBN 1-4160-2973-7. 8th edition.