
Napa County, California
Napa County, California | |
|---|---|
| County of Napa | |
    Images, from top down, left to right: Napa Valley welcome sign, Bale Grist Mill State Historic Park, a view of Calistoga from Mount Saint Helena, Lake Berryessa | |
|
Former seal | |
 Interactive map of Napa County | |
 Location in the state of California | |
| Coordinates: 38°30′N 122°19′W / 38.50°N 122.32°W | |
| Country | United States |
| State | California |
| Region | San Francisco Bay Area |
| Founded | February 18, 1850[1] |
| Named for | The city of Napa |
| County seat | Napa |
| Largest city | Napa |
| Government | |
| • Type | Council–CEO |
| • Body | Board of Supervisors |
| • Chair[2] | Belia Ramos |
| • Vice Chair [3] | Joelle Gallagher |
| • Board of Supervisors[4] | Supervisors
|
| • County Executive Officer | Ryan Alsop |
| Area | |
| • Total | 789 sq mi (2,040 km2) |
| • Land | 748 sq mi (1,940 km2) |
| • Water | 40 sq mi (100 km2) |
| Highest elevation FIPS code | 06-055 |
| GNIS feature ID | 277292 |
| Website | www |
Napa County (
Napa County comprises the Napa, CA
Napa County, once the producer of many different crops, is known today for its regional wine industry, rising to the first rank of wine regions with France by local wineries Stag's Leap Wine Cellars and Chateau Montelena winning the "Judgment of Paris" in 1976.
History
Prehistory–18th century
In
In 1776, a fort was erected by the Spanish Governor,
Early 19th century
Francis Castro and Father Jose Altimura were the first Europeans to explore the Napa Valley, in 1823.[12] When the first white settlers arrived in the early 1830s, there were six tribes in the valley speaking different dialects and they were often at war with each other. The Mayacomos tribe lived in the area where Calistoga was founded. The Callajomans were in the area near where the town of St. Helena now stands. Further south, the Kymus dwelt in the middle part of the valley. The Napa and Ulcus tribes occupied part of the area where the City of Napa now exists while the Soscol tribe occupied the portion that now makes up the southern end of the valley. Many of the native peoples died during a smallpox epidemic in 1838. Settlers also killed several over claims of cattle theft.
During the era between 1836 and 1846, when California was a province of independent Mexico, the following 13 ranchos were granted in Napa County:[13]
Following his marriage to General Vallejo’s niece Maria Guadalupe Soberanes, Edward Turner Bale became a citizen of Mexico and was granted Rancho Carne Humana in the northern end of the valley. Bale completed building the Bale Grist Mill a few miles north of St. Helena in 1846. Colonel Joseph B. Chiles a guide for one of the earliest immigrant trains to California, was granted Rancho Catacula in 1844.
The Town of Napa was founded on Rancho Entre Napa by Nathan Coombs in 1847.
Following the event of the Mexican–American War, Bear Flag Revolt in 1846 and the Mexican Cession in 1848, settlers were granted deeds from the original ranchos during the 1850s through 1870s. To this day, a number of streets and landmarks around the valley reflect the names of these ranchos and original grantees.
Late 19th century
Napa County was formed and became one of the original California counties when the state became part of the United States in 1850.
Descendants of George Yount and Captain Edward Bale played key roles in the early development of Napa County. Yount's granddaughter Elizabeth Yount married Thomas Rutherford in 1864. The couple received as a wedding gift from George Yount, land in the area of the valley now known as Rutherford. Rutherford established himself as a serious grower and producer of fine wines in the following years. Bale's oldest daughter Lolita married the seaman Louis Bruck. When Bale died in 1848, Bruck became the executor of the will for the family. He was elected the first mayor of Napa City when incorporated in 1872. Charles Krug, a fellow Prussian compatriot and pioneer viticulturalist at Sonoma, married Lolita's younger sister Caroline with a dowry that included land near the Bale mill. Krug then moved north of St. Helena to establish the valley's first commercial winery.
John Patchett opened the first commercial winery in the county in 1859. The vineyard and wine cellar were in an area now in the city limits of Napa. After working as a winemaker for Patchett, Charles Krug founded his own winery in St. Helena 1861.[14]
The county's population began to grow in the mid-century as pioneers, prospectors, and entrepreneurs moved in and set up residence. During this period, settlers primarily raised cattle and farmed grain and fruit crops. Mineral mining also played a role in the economics of the county. In 1858 the great silver rush began in Napa Valley, and miners flocked to the eastern hills. While gold was being prospected in other areas of the state in the 1850s, Napa County became a center for silver and quicksilver mining. In the 1860s, mining carried on, on a large scale, with quicksilver mines operating in many areas of Napa County.
In 1866 John Lawley established a toll road from Calistoga over Mount Saint Helena to Lake County.

In the mid-1860s, entrepreneur
The Veterans Home of California Yountville was established in Yountville in 1884 by the San Francisco chapter of the Grand Army of the Republic. The State of California assumed administration of the Home in 1897.[15]
20th and 21st centuries

By the end of the 1900s, farmers had planted over 500,000 fruit and nut trees in the county, especially plums and pears. This helped to soften the blows to the agricultural economy caused by the phylloxera infestation in the county's vineyards and upcoming prohibition that crippled the wine industry, but resulted in a boom for shipping grapes to immigrant, home winemakers across the country.
During World War II, the Basalt Rock Company located south of the City of Napa on the Napa River, built 3 dozen salvage rescue tugs for the United States Navy.[16] German prisoners of war were housed in a Camp Beale satellite prisoner of war camp near Yountville.[17] The prisoners were utilized to supplement a dwindled able bodied agricultural labor force caused by the needs of the American war effort.
Following the war, several new small and medium size businesses began operating in the county. A large majority of these businesses were related to the wine industry and tourism. Agriculture in the county remained very diverse until late in the 20th century when wine grapes again became the primary focus. While vineyards were planted on well over 90% of the agricultural land in the county, by the end of the 20th century, modern day farmers have recently begun exploring the possibility of raising other food crops in order to again diversify and take advantage of growing conditions.[18]
At 3:20 a.m. on August 24, 2014, the area was struck by a magnitude 6.0 earthquake centered 3.7 miles (6.0 km) northwest of the city of American Canyon.[19][20]
In October 2017, parts of the county were affected by wildfires.
From June to July 2018, the County Fire affected a small part of Napa County after crossing over from Yolo County, California.[21]
In October 2019, heavy smoke and unscheduled black outs by Pacific Gas and Electric Company of up to 20,000 customers affected the county due to fierce winds and threats from the Kincade Fire.[22]
Geography


According to the
Napa is warmer in the summer than
Napa County is home to a variety of
Adjacent counties
- Lake County - northwest
- Yolo County - northeast
- Solano County - east
- Sonoma County - west
National protected area
Rivers and creeks
Lakes, marshes and reservoirs
- East Napa Reservoir
- East Side Reservoir
- Fiege Reservoir
- Lake Berryessa
- Lake Hennessey
- Lake Marie
- Lake Orville
- Lake Whitehead
- Milliken Reservoir
- Napa Sonoma Marsh
- Rector Reservoir
- West Napa Reservoir
Demographics
| Census | Pop. | Note | %± |
|---|---|---|---|
| 1850 | 405 | — | |
| 1860 | 5,521 | 1,263.2% | |
| 1870 | 7,163 | 29.7% | |
| 1880 | 13,235 | 84.8% | |
| 1890 | 16,411 | 24.0% | |
| 1900 | 16,451 | 0.2% | |
| 1910 | 19,800 | 20.4% | |
| 1920 | 20,678 | 4.4% | |
| 1930 | 22,897 | 10.7% | |
| 1940 | 28,503 | 24.5% | |
| 1950 | 46,603 | 63.5% | |
| 1960 | 65,890 | 41.4% | |
| 1970 | 79,140 | 20.1% | |
| 1980 | 99,199 | 25.3% | |
| 1990 | 110,765 | 11.7% | |
| 2000 | 124,279 | 12.2% | |
| 2010 | 136,484 | 9.8% | |
| 2020 | 138,019 | 1.1% | |
| 2023 (est.) | 133,216 | [24] | −3.5% |
| U.S. Decennial Census[25] 1790–1960[26] 1900–1990[27] 1990–2000[28] 2010[29] 2020[30] | |||
2020 census
| Race / Ethnicity | Pop 2010[29] | Pop 2020[30] | % 2010 | % 2020 |
|---|---|---|---|---|
White alone (NH)
|
76,967 | 68,909 | 56.39% | 49.93% |
Black or African American alone (NH)
|
2,440 | 2,300 | 1.79% | 1.67% |
Alaska Native alone (NH)
|
544 | 507 | 0.40% | 0.37% |
| Asian alone (NH) | 8,986 | 10,520 | 6.58% | 7.62% |
| Pacific Islander alone (NH) | 313 | 316 | 0.23% | 0.23% |
| Some Other Race alone (NH) | 221 | 910 | 0.16% | 0.66% |
| Mixed Race/Multi-Racial (NH) | 3,003 | 5,728 | 2.20% | 4.15% |
| Hispanic or Latino (any race) | 44,010 | 48,829 | 32.25% | 35.38% |
| Total | 136,484 | 138,019 | 100.00% | 100.00% |
Note: the US Census treats Hispanic/Latino as an ethnic category. This table excludes Latinos from the racial categories and assigns them to a separate category. Hispanics/Latinos can be of any race.
2011
| Population, race, and income | |||||
|---|---|---|---|---|---|
| Total population[31] | 135,377 | ||||
| White[31] | 109,997 | 81.3% | |||
| Black or African American[31] | 2,710 | 2.0% | |||
| American Indian or Alaska Native[31] | 982 | 0.7% | |||
| Asian[31] | 9,209 | 6.8% | |||
| Native Hawaiian or other Pacific Islander[31] | 441 | 0.3% | |||
| Some other race[31] | 7,692 | 5.7% | |||
| Two or more races[31] | 4,346 | 3.2% | |||
| Hispanic or Latino (of any race)[32] | 42,603 | 31.5% | |||
| Per capita income[33] | $35,309 | ||||
| Median household income[34] | $68,641 | ||||
| Median family income[35] | $79,884 | ||||

Places by population, race, and income
| Places by population and race | ||||||||
|---|---|---|---|---|---|---|---|---|
| Place | Type[36] | Population[31] | White[31] | Other[31] [note 1] |
Asian[31] | Black or African American[31] |
Native American[31] [note 2] |
Hispanic or Latino (of any race)[32] |
| American Canyon | City |
18,489 | 48.7% | 9.4% | 33.4% | 6.5% | 2.0% | 24.7% |
| Angwin | CDP | 3,179 | 69.6% | 9.9% | 13.1% | 7.1% | 0.3% | 25.3% |
| Calistoga | City |
5,159 | 93.3% | 4.7% | 0.9% | 1.0% | 0.0% | 38.2% |
| Deer Park | CDP | 1,047 | 92.0% | 2.8% | 5.3% | 0.0% | 0.0% | 3.5% |
| Moskowite Corner | CDP | 151 | 84.8% | 15.2% | 0.0% | 0.0% | 0.0% | 0.0% |
| Napa | City |
76,560 | 85.9% | 10.0% | 2.2% | 0.9% | 1.0% | 38.1% |
| Oakville | CDP | 137 | 72.3% | 0.0% | 0.0% | 19.0% | 8.8% | 1.5% |
| Rutherford | CDP | 161 | 100.0% | 0.0% | 0.0% | 0.0% | 0.0% | 26.7% |
| St. Helena | City |
5,838 | 85.5% | 8.7% | 2.8% | 1.7% | 1.4% | 25.1% |
Silverado Resort |
CDP | 1,199 | 90.2% | 5.7% | 4.1% | 0.0% | 0.0% | 0.0% |
| Yountville | City |
2,943 | 91.8% | 4.2% | 1.6% | 1.9% | 0.5% | 12.8% |
| Places by population and income | |||||
|---|---|---|---|---|---|
| Place | Type[36] | Population[37] | Per capita income[33] | Median household income[34] | Median family income[35] |
| American Canyon | City |
18,489 | $27,998 | $83,581 | $91,587 |
| Angwin | CDP | 3,179 | $25,140 | $64,479 | $80,179 |
| Calistoga | City |
5,159 | $30,001 | $51,974 | $64,356 |
| Deer Park | CDP | 1,047 | $70,862 | $102,273 | $140,972 |
| Moskowite Corner | CDP | 151 | $21,191 | $31,906 | $56,023 |
| Napa | City |
76,560 | $30,783 | $62,642 | $71,964 |
| Oakville | CDP | 137 | $33,126 | $90,875 | [38] |
| Rutherford | CDP | 161 | $86,111 | $59,457 | $163,229 |
| St. Helena | City |
5,838 | $46,590 | $68,404 | $75,768 |
Silverado Resort |
CDP | 1,199 | $97,089 | $151,000 | $170,924 |
| Yountville | City |
2,943 | $42,152 | $68,368 | $70,917 |
2010
The
| Population reported at 2010 United States Census
| |||||||||
|---|---|---|---|---|---|---|---|---|---|
The County |
Total Population |
White |
African American |
Native American |
Asian |
Pacific Islander |
other races |
two or more races |
Latino (of any race) |
| Napa County | 136,484 | 97,525 | 2,668 | 1,058 | 9,223 | 372 | 20,058 | 5,580 | 44,010 |
Incorporated city |
Total Population |
White |
African American |
Native American |
Asian |
Pacific Islander |
other races |
two or more races |
Latino (of any race) |
| American Canyon | 19,454 | 7,564 | 1,535 | 142 | 6,396 | 176 | 2,357 | 1,284 | 5,009 |
| Calistoga | 5,155 | 3,735 | 27 | 21 | 47 | 10 | 968 | 347 | 2,545 |
| Napa | 76,915 | 57,754 | 486 | 637 | 1,755 | 144 | 13,256 | 2,883 | 28,923 |
| St. Helena | 5,814 | 4,525 | 25 | 35 | 98 | 9 | 978 | 144 | 1,914 |
| Yountville | 2,933 | 2,623 | 38 | 30 | 49 | 0 | 92 | 101 | 289 |
Total Population |
White |
African American |
Native American |
Asian |
Pacific Islander |
other races |
two or more races |
Latino (of any race) | |
| Angwin | 3,051 | 2,124 | 139 | 22 | 339 | 5 | 234 | 188 | 625 |
| Deer Park | 1,267 | 1,108 | 13 | 9 | 51 | 0 | 61 | 25 | 147 |
| Moskowite Corner | 211 | 183 | 1 | 14 | 1 | 0 | 8 | 4 | 25 |
| Oakville | 71 | 26 | 0 | 1 | 1 | 1 | 38 | 4 | 45 |
| Rutherford | 164 | 123 | 0 | 0 | 0 | 0 | 30 | 11 | 70 |
Silverado Resort
|
1,095 | 1,010 | 1 | 1 | 36 | 4 | 28 | 15 | 59 |
Other unincorporated areas |
Total Population |
White |
African American |
Native American |
Asian |
Pacific Islander |
other races |
two or more races |
Latino (of any race) |
| All others not CDPs (combined) | 20,354 | 16,750 | 403 | 146 | 450 | 23 | 2,008 | 574 | 4,359 |
2000
As of the
as their first language.There were 45,402 households, out of which 31.4% had children under the age of 18 living with them, 53.2% were married couples living together, 9.9% had a female householder with no husband present, and 32.4% were non-families. 25.8% of all households were made up of individuals, and 11.6% had someone living alone who was 65 years of age or older. The average household size was 2.62 and the average family size was 3.16.
In the county, the population was spread out, with 24.1% under the age of 18, 8.5% from 18 to 24, 27.7% from 25 to 44, 24.3% from 45 to 64, and 15.4% who were 65 years of age or older. The median age was 38 years. For every 100 females, there were 99.6 males. For every 100 females age 18 and over, there were 97.4 males.
Government

Napa County is governed by a five-member Board of Supervisors. The supervisors are:
- District 1: Joelle Gallagher,
- District 2: Ryan Gregory,
- District 3: Anne Cottrell,
- District 4: Alfredo Pedroza, and
- District 5: Belia Ramos
In the United States House of Representatives, Napa County is in California's 4th congressional district, represented by Democrat Mike Thompson.[41]
In the
The county is one of three counties in California to establish a separate department to deal with
Politics
Historically, Napa County was heavily Republican. It only supported a Democrat for president seven times – four of which were for Franklin D. Roosevelt – in the thirty-two presidential elections between 1860 and 1988. However, a Republican hasn't carried the county since George H. W. Bush in 1988. It is now one of the most Democratic counties in California, and is reckoned as part of the solid bloc of blue counties in the northern part of the state.
On November 4, 2008, Napa County voted 56 percent against
According to the California Secretary of State, as of February 10, 2017, Napa County has 76,038 registered voters, out of 93,926 eligible (81.0%). Of those, 35,660 (46.9%) are registered Democrats, 18,417 (24.2%) are registered Republicans, and 17,827 (23.4%) have declined to state a political party.[45]
| Year | Republican | Democratic | Third party | |||
|---|---|---|---|---|---|---|
| No. | % | No. | % | No. | % | |
| 2020 | 20,676 | 28.66% | 49,817 | 69.05% | 1,657 | 2.30% |
| 2016 | 17,411 | 28.37% | 39,199 | 63.87% | 4,762 | 7.76% |
| 2012 | 19,526 | 34.28% | 35,870 | 62.97% | 1,572 | 2.76% |
| 2008 | 19,484 | 32.67% | 38,849 | 65.14% | 1,309 | 2.19% |
| 2004 | 22,059 | 38.97% | 33,666 | 59.48% | 874 | 1.54% |
| 2000 | 20,633 | 39.89% | 28,097 | 54.32% | 2,994 | 5.79% |
| 1996 | 17,439 | 36.09% | 24,588 | 50.89% | 6,292 | 13.02% |
| 1992 | 15,662 | 29.30% | 24,215 | 45.30% | 13,578 | 25.40% |
| 1988 | 23,235 | 50.19% | 22,283 | 48.14% | 772 | 1.67% |
| 1984 | 26,322 | 57.77% | 18,599 | 40.82% | 640 | 1.40% |
| 1980 | 23,632 | 53.67% | 14,898 | 33.83% | 5,505 | 12.50% |
| 1976 | 20,839 | 51.83% | 18,048 | 44.89% | 1,318 | 3.28% |
| 1972 | 23,403 | 59.61% | 14,529 | 37.01% | 1,329 | 3.39% |
| 1968 | 14,270 | 43.76% | 14,762 | 45.27% | 3,580 | 10.98% |
| 1964 | 11,567 | 37.06% | 19,580 | 62.74% | 63 | 0.20% |
| 1960 | 15,125 | 52.56% | 13,499 | 46.91% | 154 | 0.54% |
| 1956 | 13,610 | 55.93% | 10,623 | 43.66% | 100 | 0.41% |
| 1952 | 14,065 | 61.46% | 8,655 | 37.82% | 163 | 0.71% |
| 1948 | 8,724 | 52.82% | 7,207 | 43.64% | 585 | 3.54% |
| 1944 | 7,092 | 47.48% | 7,748 | 51.87% | 96 | 0.64% |
| 1940 | 5,924 | 46.09% | 6,771 | 52.68% | 158 | 1.23% |
| 1936 | 3,973 | 38.24% | 6,270 | 60.35% | 147 | 1.41% |
| 1932 | 3,521 | 36.97% | 5,745 | 60.32% | 258 | 2.71% |
| 1928 | 4,699 | 57.48% | 3,422 | 41.86% | 54 | 0.66% |
| 1924 | 3,605 | 54.82% | 670 | 10.19% | 2,301 | 34.99% |
| 1920 | 4,448 | 70.99% | 1,444 | 23.05% | 374 | 5.97% |
| 1916 | 3,914 | 52.46% | 3,088 | 41.39% | 459 | 6.15% |
| 1912 | 0 | 0.00% | 2,662 | 46.55% | 3,057 | 53.45% |
| 1908 | 2,405 | 59.08% | 1,336 | 32.82% | 330 | 8.11% |
| 1904 | 2,425 | 63.30% | 1,135 | 29.63% | 271 | 7.07% |
| 1900 | 2,017 | 56.71% | 1,432 | 40.26% | 108 | 3.04% |
| 1896 | 2,032 | 57.03% | 1,472 | 41.31% | 59 | 1.66% |
| 1892 | 1,769 | 50.79% | 1,478 | 42.43% | 236 | 6.78% |
| 1888 | 1,763 | 53.20% | 1,496 | 45.14% | 55 | 1.66% |
| 1884 | 1,593 | 55.37% | 1,256 | 43.66% | 28 | 0.97% |
| 1880 | 1,199 | 51.90% | 1,082 | 46.84% | 29 | 1.26% |
| Year | GOP | DEM |
|---|---|---|
2018
|
35.2% 19,834 | 64.8% 36,513 |
2014
|
31.8% 12,059 | 68.2% 25,846 |
2010
|
38.1% 17,873 | 57.1% 26,766 |
2006
|
54.6% 23,187 | 38.8% 16,504 |
| 2003 | 39.6% 16,097 | 34.7% 14,115 |
2002
|
36.8% 13,483 | 47.8% 17,516 |
1998
|
35.2% 15,193 | 59.9% 25,809 |
1994
|
54.7% 23,429 | 40.7% 17,454 |
1990
|
47.2% 18,931 | 47.5% 19,017 |
1986
|
68.1% 26,445 | 29.5% 11,456 |
1982
|
54.2% 21,812 | 42.3% 17,042 |
1978
|
41.1% 15,621 | 50.5% 19,202 |
1974
|
50.1% 16,048 | 47.4% 15,200 |
1970
|
55.3% 16,844 | 42.7% 13,018 |
1966
|
59.5% 17,740 | 40.5% 12,060 |
1962
|
44.7% 12,326 | 53.5% 14,748 |
Voter registration
| Population and registered voters (2017) | ||
|---|---|---|
| Total population[31] | 135,377 | |
| Registered voters[45][note 4] | 76,038 | 56.2% |
| Democratic[45] | 35,660 | 46.9% |
| Republican[45] | 18,417 | 24.2% |
| Democratic–Republican spread[45] | +17,243 | +22.7% |
| American Independent[45] | 2,311 | 3.0% |
| Green[45] | 639 | 0.8% |
| Libertarian[45] | 589 | 0.8% |
| Peace and Freedom[45] | 207 | 0.3% |
| Other[45] | 388 | 0.5% |
| No party preference[45] | 17,827 | 23.4% |
Cities by population and voter registration
| Cities by population and voter registration | |||||||
|---|---|---|---|---|---|---|---|
| City | Population[31] | Registered voters[45] [note 4] |
Democratic[45] | Republican[45] | D–R spread[45] | Other[45] | No party preference[45] |
| American Canyon | 18,489 | 56.9% | 51.5% | 15.7% | +35.8% | 4.4% | 28.4% |
| Calistoga | 5,159 | 46.7% | 53.2% | 18.8% | +34.4% | 5.2% | 22.8% |
| Napa | 76,560 | 54.8% | 48.1% | 23.7% | +24.4% | 5.6% | 22.6% |
| St. Helena | 5,838 | 57.2% | 47.3% | 24.8% | +22.5% | 4.2% | 23.7% |
| Yountville | 2,943 | 67.9% | 45.6% | 25.9% | +19.7% | 6.5% | 22.0% |
Crime
The following table includes the number of incidents reported and the rate per 1,000 persons for each type of offense.
| Population and crime rates | ||
|---|---|---|
| Population[31] | 135,377 | |
| Violent crime[47] | 580 | 4.28 |
| Homicide[47] | 1 | 0.01 |
| Forcible rape[47] | 34 | 0.25 |
| Robbery[47] | 93 | 0.69 |
| Aggravated assault[47] | 452 | 3.34 |
| Property crime[47] | 1,634 | 12.07 |
| Burglary[47] | 716 | 5.29 |
| Larceny-theft[47][note 5] | 2,091 | 15.45 |
| Motor vehicle theft[47] | 309 | 2.28 |
| Arson[47] | 13 | 0.10 |
Cities by population and crime rates
| Cities by population and crime rates | ||||||||
|---|---|---|---|---|---|---|---|---|
| City | Population[48] | Violent crimes[48] | Violent crime rate per 1,000 persons |
Property crimes[48] | Property crime rate per 1,000 persons | |||
| American Canyon | 19,873 | 64 | 3.22 | 616 | 31.00 | |||
| Calistoga | 5,266 | 4 | 0.76 | 64 | 12.15 | |||
| Napa | 78,589 | 216 | 2.75 | 1,643 | 20.91 | |||
| St. Helena | 5,939 | 3 | 0.51 | 86 | 14.48 | |||
| Yountville | 2,984 | 7 | 2.35 | 56 | 18.77 | |||
Economy
Major Economic Activity in Napa County[49] (Highest number in each category highlighted)
| Economic Sector (NAICS code description) | Number of paid employees (2012) | Annual Payroll (2012) | Number of Establishments (2012) | Gross Revenue (2012) | Major Employers[50] |
|---|---|---|---|---|---|
| Health Care and Social Assistance | 11,022 | $667,321,000 | 406 | Queen of the Valley Medical Center, St. Helena Hospital, Veterans Home, Napa State Hospital, Community Health Clinic Ole, The Doctors Company
| |
| Accommodation and Food Services | 10,025 | $246,578,000 | 375 | Napa Valley , La Toque, Solbar, Terra | |
| Manufacturing (Includes winemaking) | 9,981 | $672,448,000 | 431 | $4,576,801,000[51] | Over 500 wineries; See Napa Valley Vinters for details |
| Retail trade | 6,469 | $191,398,000 | 536 | Walmart, Central Valley Builder's Supply, Bell Products | |
| Administrative and Support and Waste Management and Remediation Services (Includes government) | 3,340 | $96,671,000 | 200 | County of Napa, City of Napa, City of American Canyon | |
| Construction | 2,483 | $138,800,000 | 409 | Nova Group | |
| Educational Services | (1000–2499) | $44,100,000 | 56 | Napa Valley Unified School District, Napa County Office of Education | |
| Wholesale trade | 2,275 | $146,131,000 | 200 | ||
| Agriculture (Includes grapegrowing) | 601-6790 (seasonal)[52] | $22,526,000 | 40 | Vineyard management companies and farmers, see Napa Farm Bureau for details | |
| Professional, Scientific and Professional Services | 1,676 | $99,988,000 | 396 | ||
| Finance and Insurance | 1,565 | $136,673,000 | 203 | The Bank of Napa, Wells Fargo, Bank of America, Umpqua Bank, Rabobank, Westamerica Bank |
Wine

Napa Valley is widely considered one of the top

In 1965, Napa Valley icon Robert Mondavi broke away from his family's Charles Krug estate to found his own. This was the first new large scale winery to be established in the valley since before prohibition. After the establishment of the Mondavi estate, the number of wineries in the valley continued to grow, as did the region's reputation. Consumer trends followed the 60s free lifestyle for experimentation. The old "paesano" customers of "dego red" gallon jug wines changed to young women who considered white wine, not beer, as their new drink of choice for romance. Robert Mondavi Winery attracted new wine aficionados by introducing the larger, 1.5-liter wine bottle for an image of affordable quality.

In addition to large scale wineries, Napa Valley's boutique wineries produce some of the world's best wines. The producers of these wines include but are not limited to:
Today Napa Valley features more than four hundred wineries and grows many different grape varieties including Cabernet Sauvignon, Chardonnay, Merlot, Zinfandel, and other popular varietals. As many as five million people visit the area each year.
Agricultural preservation
.jpg)
Napa County has maintained a rural agricultural environment in a large part of the valley floor while neighboring Sonoma, Solano, and Yolo counties have allowed large tracts of former farmland to be rezoned for commercial and residential development. In 1968 vintners and civic leaders in the county seized an opportunity to preserve farmland by taking advantage of the Williamson Act[54] enacted by the California Legislature to give landowners property tax relief for designating their land for agricultural purposes. This agricultural preserve[55] on the floor of the valley in unincorporated areas between Napa and Calistoga was the first of its kind in the state. Initially, the preserve encompassed 23,000 acres (93.1 km2),but it has grown to more than 30,000 acres (121.4 km2). In 2010, legislation was passed by the California State Senate and State Assembly and sent to the Governor for signing in the form of Senate Bill 1142. This bill was created to provide relief stream of funding to augment the Williamson Act.[56]
The county has resisted encroachment on the preserve since it was created with voters reaffirming their desire to keep it intact on several occasions. In 1990 voters passed Measure J[57] adopting an initiative freezing all county zoning changes until the year 2020 unless there is a ⅔ majority vote to adopt such changes.[58] Measure J was reaffirmed by a 5–2 vote of the California Supreme Court in 1995 in the case of Devita v. County of Napa.[59]
The Land Trust of Napa County[60] was founded in 1976 by a group of local citizens with a mission to protect the natural diversity, scenic open space and agricultural vitality of the county. The trust acquires conservation easements, facilitates land transfers to local, state and federal agencies along with accepting outright donations of land within and outside the boundary of the agricultural preserve. The trust now covers over 50,000 acres (202.3 km2).[61]
While establishment of the agricultural preserve and the land trust has slowed residential development in much of the county, residential growth within the incorporated cities has continued at a moderate pace. Several substantial homes have been built on the hills surrounding the valley in areas not covered by the preserve or the land trust. A large portion of the land south of the City of Napa remained undeveloped for many decades until the 1980s. Several wine bottling facilities and
In November 2009, the Napa Valley Vintners Association, the Napa Farm Bureau, the Napa Valley Grapegrowers and an advocacy group called Preserving the Integrity of Napa's Agriculture completed a two-year study of
Education
In addition to its many public and private schools, two colleges also operate in the county.
K-12 schools
K-12 school districts include:[65]
Unified:
- Calistoga Joint Unified School District
- Fairfield-Suisun Unified School District
- Napa Valley Unified School District
- St. Helena Unified School District
Elementary:
Library
The Napa County Library, is the public library of Napa California. The main branch is in downtown Napa. There are three branch libraries, in American Canyon, Calistoga and Yountville.
Napa County Library is a member of LINK+, a union catalog of contributed holdings from participating libraries in California and Nevada.
Media
Napa County receives media from the rest of the Bay Area.
The county also has several media outlets that serve the local community:
- Napa Valley Register
- St. Helena Star
- Weekly Calistogan
- American Canyon Eagle
- Calistoga Tribune
- Yountville Sun
- Napa Valley Life
- KVON 1440 kHz AM
- K245DK translating KVON 96.9 MHz in early 2019
- KVYN 99.3 MHz FM
- K278AH 103.5 MHz in Calistoga
- KCMU-LP FM 103.3 MHz
Transportation
Major highways
Interstate 80 travels briefly in Napa County.
Public transportation
Airports
- Napa County Airport is a general aviation airport south of the City of Napa.
- Angwin-Parrett Field is a public use airport east of Angwin and is owned by Pacific Union College.
Rail
The Napa Valley Railroad is owned by the Napa Valley Wine Train, a dining/excursion service. The Napa Wine train offers a variety of different experience packages some including: wine tasting including dinner, rides with Santa during Christmas time, special offers showcasing some of the valley's new releases. Customer will be seated in the 100 year old vintage train while they take a 36-mile round trip from Napa to St. Helena and back.
Events

Napa County hosts numerous cultural events throughout the year. The county fair takes place annually in early July at the Napa County Fairgrounds in Calistoga. The Napa Town and Country Fair takes place in mid-July at the Napa Valley Expo in Napa. In order to boost tourism during the normally slow winter months, area hotels, restaurants, tourist-based businesses partnered with the county's local arts agency Arts Council Napa Valley and visitor management bureau Visit Napa Valley to develop Arts in April], a program celebrating the diverse cultural offerings featured in wine and hospitality institutions, beginning in 2011. In March every year since the late '70s, the county plays host to the Napa Valley Marathon.
In June, the annual Napa Valley Wine Auction takes place. Wineries throughout the valley donate wines and other prizes to be auctioned off to the highest bidder. This annual event raises several million dollars per year, benefiting charities throughout Napa County.
Festival Napa Valley
In 2006, Napa Valley became home to the Festival Napa Valley, an annual food, wine, art, and music festival held at various venues throughout the valley. Additional music festivals, including Music in the Vineyards, Live in the Vineyard, the Robert Mondavi Summer Concert Series, all taking place annually in locations throughout the valley.
Napa Valley Film Festival
The Napa Valley Film Festival was founded in 2011 to recognize independent filmmaking of different genres. The festival occurs in November at various venues.[66]
BottleRock Napa Valley
BottleRock Napa Valley is a music festival that took place for the first time in May 2013 on the grounds of the Napa Valley Exposition in Napa. The five-day festival featured over 60 bands and participation by over 300 wineries.[67] Although deemed an artistic success, the organizers of the 2013 event left many unpaid creditors.[68][69] A three-day event was held the following year and featured 45 musical acts.
A year-round arts and cultural resource for the county, Napa Valley Now, is presented by Arts Council Napa Valley. It is free for the public to use and contribute to and features all major happenings throughout the Valley.
Communities
Cities
- American Canyon
- Calistoga
- Napa (county seat)
- St. Helena
- Yountville
Census-designated places
- Angwin
- Deer Park
- Moskowite Corner
- Oakville
- Rutherford
- Silverado Resort
Other unincorporated communities
- Aetna Springs
- Berryessa Highlands
- Circle Oaks
- Lokoya
- Pope Valley
- Vichy Springs
Population ranking
The population ranking of the following table is based on the 2010 census of Napa County.[70]
† county seat
| Rank | City/Town/etc. | Municipal type | Population (2010 Census) |
|---|---|---|---|
| 1 | † Napa | City | 76,915 |
| 2 | American Canyon | City | 19,454 |
| 3 | St. Helena | City | 5,814 |
| 4 | Calistoga | City | 5,155 |
| 5 | Angwin | CDP | 3,051 |
| 6 | Yountville | City | 2,933 |
| 7 | Deer Park | CDP | 1,267 |
| 8 | Silverado Resort
|
CDP | 1,095 |
| 9 | Moskowite Corner | CDP | 211 |
| 10 | Rutherford | CDP | 164 |
| 11 | Oakville | CDP | 71 |
In popular culture
- Bottle Shock (2008) is based on the true story of the famous 1976 "Judgment of Paris," an important event in the history of Napa Valley winemaking.
- The setting for the 1995 movie A Walk in the Clouds is Napa Valley in 1945.
- In the 1998 remake of The Parent Trap, the girls' father was portrayed as a Napa Valley winemaker.[71]
- The Napa Valley Film Commission lists other films with a setting in Napa or with film shot in Napa County.[72]
Notable residents
- Michael Chiarello, chef
- Francis Ford Coppola, director
- Margaret Keane, artist
- Thomas Keller, chef
- Robert Mondavi, winemaker
- Gustave Niebaum, winemaker
- Warren Winiarski, winemaker and grape grower
- Robin Williams, actor[73]
See also
- Pacific Union College
- Eriophyllum latilobum
- Lasthenia conjugens
- List of school districts in California by county
- Napa County Airport
- National Register of Historic Places listings in Napa County, California
Notes
- ^ Other is defined by some other race or two or more races
- ^ Native American = Native Hawaiian or other Pacific Islander + American Indian or Alaska Native
- Progressive Theodore Roosevelt (who was the official “Republican” nominee in California), 478 votes for Socialist Eugene V. Debs, 126 votes for Prohibition Party candidate Eugene W. Chafin, and 21 scattered write-in votes (none of which were for national Republican nominee William Howard Taft)
- ^ a b Percentage of registered voters with respect to total population. Percentages of party members with respect to registered voters follow.
- ^ Only larceny-theft cases involving property over $400 in value are reported as property crimes.
References
- ^ "Chronology". California State Association of Counties. Retrieved February 6, 2015.
- ^ "District 5 | Napa County, CA".
- ^ "District 1 | Napa County, CA".
- ^ "About the Board | Napa County, CA".
- ^ "Mount Saint Helena-East Peak". Peakbagger.com. Retrieved February 9, 2015.
- ^ "Napa County, California". United States Census Bureau. Retrieved January 30, 2022.
- ^ "Find a County". National Association of Counties. Retrieved June 7, 2011.
- ^ "California Wine Country Tours, Napa Valley Wine Tours, Wine Country Tips, San Francisco Wine Country Tours". www.winecountrytourshuttle.com. Archived from the original on February 6, 2015. Retrieved November 28, 2014.
- ISBN 9783540005766. Retrieved September 3, 2012.
- ^ Environmental Assessment for the Napa Valley Wine Train, Napa County and the California Public Utilities Commission, Earth Metrics Inc. report 10072, January 1990
- ^ "Calarchives4u.com". www.calarchives4u.com. Archived from the original on March 27, 2009.
- ^ Heeger, Jack (December 7, 2004). "A peek at Napa Valley's hidden past". Napa Valley Register. Napa, CA: Lee Enterprises, Inc. Retrieved September 30, 2011.
- ^ "Mexican Land Grants / Ranchos Napa County". www.lib.berkeley.edu.
- ^ Brennen, Nancy (November 21, 2010). "John Patchett: Introducing one of Napa's pioneers". Napa Valley Register. Napa, CA: Lee Enterprises, Inc. Archived from the original on November 24, 2010. Retrieved September 30, 2011.
- ^ O’Dea Gaughan, Timothy (March 22, 2009). "Veterans Home marks 125 years". Napa Valley Register. Napa, CA: Lee Enterprises, Inc. Retrieved September 28, 2011.
- ^ Courtney, Kevin (February 11, 2008). "One man's journey to save Napa-made warship". Napa Valley Register. Napa, CA. Retrieved October 16, 2010.
- ^ Huffman, Jennifer (February 12, 2022). "Forgotten history: German POWs worked at Napa ranches during war". Napa Valley Register. Retrieved March 7, 2022.
- ^ Franson, Paul (August 24, 2010). "Vintners and growers investigating planting food other than grapes". Napa Valley Register. Napa, CA. Retrieved August 25, 2010.
- ^ "BBC News - Earthquake rocks northern California". BBC Online. August 24, 2014. Retrieved August 24, 2014.
- ^ "M6.0 - 6km NW of American Canyon, California". USGS. August 24, 2014. Retrieved August 24, 2014.
- ^ Larson, Elizabeth (July 1, 2018). "County fire grows, crosses into Napa County; more evacuation orders, advisories issued". Lake County News. Retrieved October 27, 2019.
- ^ Yune, Howard; Sweeney, Cynthia (October 27, 2019). "More outages strike Napa County after fierce overnight winds; local shelters to open for Sonoma County wildfire evacuees". Napa Valley Register. Napa, California. Retrieved October 27, 2019.
- ^ "2010 Census Gazetteer Files". United States Census Bureau. August 22, 2012. Retrieved September 28, 2015.
- ^ "Annual Estimates of the Resident Population for Counties: April 1, 2020 to July 1, 2023". United States Census Bureau. Retrieved March 26, 2024.
- US Census Bureau. Retrieved January 24, 2022.
- ^ "Historical Census Browser". University of Virginia Library. Retrieved September 28, 2015.
- ^ Forstall, Richard L., ed. (March 27, 1995). "Population of Counties by Decennial Census: 1900 to 1990". United States Census Bureau. Retrieved September 28, 2015.
- ^ "Census 2000 PHC-T-4. Ranking Tables for Counties: 1990 and 2000" (PDF). United States Census Bureau. April 2, 2001. Retrieved September 28, 2015.
- ^ a b "P2 HISPANIC OR LATINO, AND NOT HISPANIC OR LATINO BY RACE - 2010: DEC Redistricting Data (PL 94-171) - Napa County, California". United States Census Bureau.
- ^ a b "P2 HISPANIC OR LATINO, AND NOT HISPANIC OR LATINO BY RACE - 2020: DEC Redistricting Data (PL 94-171) - Napa County, California". United States Census Bureau.
- ^ a b c d e f g h i j k l m n o p q U.S. Census Bureau. American Community Survey, 2011 American Community Survey 5-Year Estimates, Table B02001. U.S. Census website. Retrieved October 26, 2013.
- ^ a b U.S. Census Bureau. American Community Survey, 2011 American Community Survey 5-Year Estimates, Table B03003. U.S. Census website. Retrieved October 26, 2013.
- ^ a b U.S. Census Bureau. American Community Survey, 2011 American Community Survey 5-Year Estimates, Table B19301. U.S. Census website. Retrieved October 21, 2013.
- ^ a b U.S. Census Bureau. American Community Survey, 2011 American Community Survey 5-Year Estimates, Table B19013. U.S. Census website. Retrieved October 21, 2013.
- ^ a b U.S. Census Bureau. American Community Survey, 2011 American Community Survey 5-Year Estimates, Table B19113. U.S. Census website. Retrieved October 21, 2013.
- ^ a b U.S. Census Bureau. American Community Survey, 2011 American Community Survey 5-Year Estimates. U.S. Census website. Retrieved October 21, 2013.
- ^ U.S. Census Bureau. American Community Survey, 2011 American Community Survey 5-Year Estimates, Table B01003. U.S. Census website. Retrieved October 21, 2013.
- ^ Data unavailable
- ^ "2010 Census P.L. 94-171 Summary File Data". United States Census Bureau.
- ^ "U.S. Census website". United States Census Bureau. Retrieved May 14, 2011.
- ^ "California's 5th Congressional District - Representatives & District Map". Civic Impulse, LLC. Retrieved March 3, 2013.
- ^ "Statewide Database". UC Regents. Archived from the original on February 1, 2015. Retrieved December 5, 2014.
- ^ Mark Haefele (January 8, 2014). "What comes after Baca?". Los Angeles Times. Retrieved December 27, 2014.
- ^ "County Results - Election Center 2008". CNN. January 12, 2009. Retrieved June 20, 2017.
- ^ a b c d e f g h i j k l m n o p q California Secretary of State. Report of Registration as of February 10, 2017.
- ^ Leip, David. "Dave Leip's Atlas of U.S. Presidential Elections". uselectionatlas.org.
- ^ a b c d e f g h i j Office of the Attorney General, Department of Justice, State of California. Table 11: Crimes – 2009 Archived December 2, 2013, at the Wayback Machine. Retrieved November 14, 2013.
- ^ a b c United States Department of Justice, Federal Bureau of Investigation. Crime in the United States, 2012, Table 8 (California). Retrieved November 14, 2013.
- ^ "2012 U.S. Census Business Data". 2012. Archived from the original on October 1, 2002. Retrieved December 27, 2014.
- ^ Napa Chamber of Commerce. "Members of Napa County Chamber of Commerce". Retrieved December 27, 2014.
- ^ Stonebridge Research Group (2012). "The Economic Impact of Napa County's Wine and Grapes" (PDF). Retrieved December 27, 2014.
- ^ California Institute for Rural Studies (2006). "An Assessment of the Demand for Farmworker Housing in California" (PDF).
- ^ Burnham, Kelsey (April 18, 2010). "Prohibition in Wine Country". Napa Valley Register. Retrieved April 18, 2010.
- ^ "explanation of Williamson Act" (PDF). Archived from the original (PDF) on June 21, 2007.
- ^ "Napa Chamber of Commerce info on Napa County Agricultural Preserve". Archived from the original on August 17, 2007.
- ^ Jones, Julian (August 26, 2010). "Wiggins bill could help replenish farm funds". Napa Valley Register. Napa, CA: Lee Enterprises, Inc. Retrieved August 27, 2010.
- ^ "article about Measure J". Archived from the original on March 4, 2001.
- ^ Jensen, Peter (March 4, 2012). "Measure J made Napa County voters protectors of agricultural lands". Napa Valley Register. Napa, CA: Lee Enterprises, Inc. Retrieved March 4, 2012.
- ^ "Devita v County of Napa". Archived from the original on June 25, 2007.
- ^ "Land Trust of Napa County". Archived from the original on December 4, 2007.
- ^ "Land Trust of Napa County - Leading Napa Valley's Land Conservation". www.napalandtrust.org.
- ^ "City of American Canyon website". Archived from the original on May 17, 2007.
- ^ "Current Issues of the Napa Valley Farm Bureau". Archived from the original on December 30, 2014. Retrieved December 27, 2014.
- ^ "Joint Letter of NVVA, NVFB, NVGG, PINA" (PDF). November 30, 2009. Archived from the original (PDF) on December 30, 2014. Retrieved December 27, 2014.
- U.S. Census Bureau. Retrieved July 25, 2022. - Text list
- ^ "Napa Valley Film Festival 2022 in Napa Valley, CA - Dates". rove.me. Retrieved October 17, 2022.
- ^ The Event | BottleRock Napa. Bottlerocknapavalley.com. Retrieved on July 21, 2013.
- ^ "New organizers credited with restoring BottleRock's financial footing". Santa Rosa Press Democrat. May 1, 2014. Retrieved May 20, 2023.
- ^ HUFFMAN, JENNIFER (October 18, 2013). "BottleRock festival debts remain unpaid". Napa Valley Register. Retrieved May 20, 2023.
- ^ "By Decade".
- ^ "The Parent Trap (1998)". Rotten Tomatoes. Retrieved June 21, 2012.
- ^ "Napa Valley Film Commission List of Napa Related Movies". Retrieved December 28, 2014.
- ^ Carlyle, Erin. "Robin Williams' Napa Retreat - pg.1". Forbes.
External links
 Napa Valley travel guide from Wikivoyage
- Official website

- Flags of Napa County
- Napa Now history
- Convention & Visitors Bureau
Places adjacent to Napa County, California | ||||||||||||||||
|---|---|---|---|---|---|---|---|---|---|---|---|---|---|---|---|---|
| ||||||||||||||||
Municipalities and communities of Napa County, California, United States | ||
|---|---|---|
| Cities and towns | 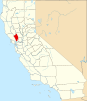 | |
| CDPs |
| |
| Unincorporated communities | ||
| Ghost towns | ||
| ||
| Bodies of water |
|  | |||||||||||
|---|---|---|---|---|---|---|---|---|---|---|---|---|---|
| Counties | |||||||||||||
| Cities and towns |
| ||||||||||||
| CDPs over 10k | |||||||||||||
| Sub-regions | |||||||||||||
| Other | |||||||||||||
| International | |
|---|---|
| National | |
| Geographic | |
| Other | |