
Northumberland County Council elections
This article needs additional citations for verification. (June 2018) |
Northumberland County Council elections are held every four years.
unitary authority of Northumberland in England. Since the last boundary changes in 2013, 67 councillors have been elected from 66 wards.[1]
Council elections
- 1973 Northumberland County Council election
- 1977 Northumberland County Council election
- 1981 Northumberland County Council election
- 1985 Northumberland County Council election
- 1989 Northumberland County Council election
- 1993 Northumberland County Council election
- 1997 Northumberland County Council election
- 2001 Northumberland County Council election
- 2005 Northumberland County Council election
- 2008 Northumberland County Council election
- 2013 Northumberland County Council election
- 2017 Northumberland County Council election
- 2021 Northumberland County Council election
Council composition
| Year | Conservative | Labour | Liberal Democrats | Liberal | Green | Independent
|
Control |
|---|---|---|---|---|---|---|---|
| 1973 | 10 | 28 | - | 3 | - | 21 | No overall control |
| 1977 | 20 | 21 | - | 0 | - | 21[a] | No overall control |
| 1981 | 14 | 34 | - | 15 | - | 3 | Labour |
| 1985 | 12 | 30 | - | 20 | - | 4[b] | No overall control |
| 1989 | 17 | 38 | 8 | - | - | 3 | Labour |
| 1993 | 13 | 39 | 11 | - | 0 | 5 | Labour |
| 1997 | 13 | 43 | 8 | - | 0 | 2 | Labour |
| 2001 | 17 | 38 | 9 | - | 0 | 3 | Labour |
| 2005 | 14 | 35 | 14 | - | 0 | 4 | Labour |
| 2008 | 17 | 17 | 26 | - | 0 | 7 | No overall control |
| 2013 | 21 | 32 | 11 | - | 0 | 3 | No overall control |
| 2017 | 33 | 24 | 3 | - | 0 | 7 | No overall control |
| 2021 | 34 | 21 | 3 | - | 2 | 7 | Conservative |
County result maps
-
 1981 results map
 -
 1985 results map
 -
 1989 results map
 -
 1993 results map
 -
 1997 results map
 -
 2001 results map
 -
 2005 results map
 -
 2008 results map
 -
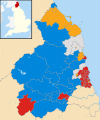
 2013 results map
 -
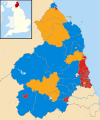
 2017 results map
 -
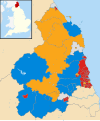
 2021 results map


By-election results
1997-2001
| Party | Candidate | Votes | % | ±% | |
|---|---|---|---|---|---|
| Conservative | 546 | 35.8 | +0.5 | ||
| Liberal Democrats | 420 | 27.5 | -9.6 | ||
| Labour | 307 | 20.1 | -7.5 | ||
Independent
|
253 | 16.8 | +16.8 | ||
| Majority | 126 | 8.3 | |||
| Turnout | 1,526 | ||||
| Conservative gain from Liberal Democrats | Swing | ||||
| Party | Candidate | Votes | % | ±% | |
|---|---|---|---|---|---|
| Liberal Democrats | 720 | 58.7 | +58.7 | ||
| Labour | 483 | 39.4 | -39.8 | ||
| Conservative | 23 | 1.9 | -18.9 | ||
| Majority | 237 | 19.3 | |||
| Turnout | 1,226 | ||||
| Liberal Democrats gain from Labour | Swing | ||||
| Party | Candidate | Votes | % | ±% | |
|---|---|---|---|---|---|
| Labour | 574 | 58.0 | -21.3 | ||
| Liberal Democrats | 391 | 39.5 | +18.8 | ||
| Conservative | 24 | 2.4 | +2.4 | ||
| Majority | 183 | 18.5 | |||
| Turnout | 989 | 30.0 | |||
| Labour hold | Swing | ||||
2005-2008
| Party | Candidate | Votes | % | ±% | |
|---|---|---|---|---|---|
| Liberal Democrats | Leslie Cassie | 473 | 40.7 | +0.3 | |
| Conservative | David Bawn | 304 | 26.2 | +3.8 | |
| Green | Nicholas Best | 154 | 13.3 | -3.0 | |
| Labour | Ian Fleming | 144 | 12.4 | -8.5 | |
Independent
|
John Beynon | 87 | 7.5 | +7.5 | |
| Majority | 169 | 14.5 | -3.5 | ||
| Turnout | 1,162 | 33.9 | -34.0 | ||
| Liberal Democrats hold | Swing | ||||
| Party | Candidate | Votes | % | ±% | |
|---|---|---|---|---|---|
| Labour | 841 | 67.2 | +3.0 | ||
| Liberal Democrats | 411 | 32.8 | +6.3 | ||
| Majority | 430 | 34.4 | |||
| Turnout | 1,252 | ||||
| Labour hold | Swing | ||||
2008-2013
| Party | Candidate | Votes | % | ±% | |
|---|---|---|---|---|---|
| Conservative | Eileen Armstrong | 843 | 62.6 | +2.0 | |
| Liberal Democrats | Andrew Duffield | 403 | 29.9 | +1.6 | |
| Labour | Andrew Avery | 100 | 7.4 | +2.9 | |
| Majority | 440 | 32.7 | |||
| Turnout | 1,346 | ||||
| Conservative hold | Swing | ||||
2013-2017
| Party | Candidate | Votes | % | ±% | |
|---|---|---|---|---|---|
| Liberal Democrats | Kate Cairns | 742 | 49.6 | +49.6 | |
| Conservative | John Hope | 352 | 23.5 | +0.7 | |
| Independent | Wendy Pattison | 208 | 13.9 | +13.9 | |
| UKIP | Michael Weatheritt | 146 | 9.8 | -3.1 | |
| Labour | Nicola Morrison | 48 | 3.2 | +3.2 | |
| Majority | 390 | 26.1 | |||
| Turnout | 1,496 | ||||
| Liberal Democrats gain from Independent | Swing | ||||
| Party | Candidate | Votes | % | ±% | |
|---|---|---|---|---|---|
| Labour | Mark Purvis | 508 | 69.5 | -21.2 | |
| UKIP | Peter Curtis | 102 | 14.0 | +14.0 | |
| Liberal Democrats | Andy McGregor | 82 | 11.2 | +11.2 | |
| Conservative | Chris Galley | 39 | 5.3 | -4.0 | |
| Majority | 406 | 55.5 | |||
| Turnout | 731 | ||||
| Labour hold | Swing | ||||
| Party | Candidate | Votes | % | ±% | |
|---|---|---|---|---|---|
| Independent | Derek Kennedy | 501 | 36.6 | +36.6 | |
| Conservative | Tom Gillanders | 454 | 33.2 | -15.1 | |
| Labour | Nuala Rose | 200 | 14.6 | -0.3 | |
| Independent | Anne Pickering | 125 | 9.1 | +9.1 | |
| Green | Lee Williscroft-Ferris | 89 | 6.5 | +6.5 | |
| Majority | 47 | 3.4 | |||
| Turnout | 1,369 | ||||
| Independent gain from Conservative | Swing | ||||
2017-2021
| Party | Candidate | Votes | % | ±% | |
|---|---|---|---|---|---|
| Labour | Leslie Bowman | 916 | 57.6 | +7.4 | |
| Conservative | Maureen Levy | 510 | 32.1 | -7.2 | |
| Liberal Democrats | Anita Romer | 164 | 10.3 | +10.3 | |
| Majority | 406 | 25.5 | |||
| Turnout | 1,590 | ||||
| Labour hold | Swing | ||||
2021-2025
| Party | Candidate | Votes | % | ±% | |
|---|---|---|---|---|---|
| Liberal Democrats | Suzanne Fairless-Aitken | 584 | 47.3 | +11.8 | |
| Conservative | Stephen Ball | 370 | 30.0 | -13.8 | |
| Labour | Jonathan Wheeler | 154 | 12.5 | -8.1 | |
| Independent | Lee Williscroft-Ferris | 127 | 10.3 | +10.3 | |
| Majority | 214 | 17.3 | |||
| Turnout | 1,235 | ||||
| Liberal Democrats gain from Conservative | Swing | ||||
| Party | Candidate | Votes | % | ±% | |
|---|---|---|---|---|---|
| Conservative | Eve Chicken | 702 | 55.6 | +1.1 | |
| Labour | Christine Savage | 511 | 40.5 | -5.0 | |
| Green | Clive Robson | 29 | 2.3 | +2.3 | |
| Liberal Democrats | Alisdair Gibbs-Barton | 21 | 1.7 | +1.7 | |
| Majority | 191 | 15.1 | |||
| Turnout | 1,263 | ||||
| Conservative hold | Swing | ||||
References
- ^ "The Northumberland (Electoral Changes) Order 2011", legislation.gov.uk, The National Archives, SI 2011/2, retrieved 15 August 2022
- ^ "Local Elections Archive Project — Choppington Division". www.andrewteale.me.uk. Retrieved 25 January 2024.
- ^ "Local Elections Archive Project — Ponteland East Ward". www.andrewteale.me.uk. Retrieved 25 January 2024.
- ^ "Local Elections Archive Project — Longhoughton Ward". www.andrewteale.me.uk. Retrieved 25 January 2024.
- ^ "Local Elections Archive Project — College Ward". www.andrewteale.me.uk. Retrieved 25 January 2024.
- ^ "Local Elections Archive Project — Hexham West Ward". www.andrewteale.me.uk. Retrieved 25 January 2024.
- ^ "Local Elections Archive Project — Holywell Ward". www.andrewteale.me.uk. Retrieved 25 January 2024.
- ^ "Local Elections Archive Project — Hexham East Ward". www.andrewteale.me.uk. Retrieved 25 January 2024.
- ^ "Local Elections Archive Project — Seghill with Seaton Delaval Ward". www.andrewteale.me.uk. Retrieved 25 January 2024.
