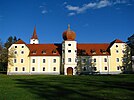
Požega-Slavonia County
Požega-Slavonia County
Požeško-slavonska županija | |
|---|---|
 Požega-Slavonia County within Croatia | |
| Country | Croatia |
| County seat | Požega |
| Government | |
| • Župan | Antonija Jozić (HDZ) |
| Area | |
| • Total | 1,823 km2 (704 sq mi) |
| Population (2021)[2] | |
| • Total | 64,420 |
| • Density | 35/km2 (92/sq mi) |
| Area code | 034 |
| ISO 3166 code | HR-11 |
| HDI (2019) | 0.798[3] high · 18th |
| Website | www |
Požega-Slavonia County (Croatian: Požeško-slavonska županija [pôʒeʃko-slǎʋoːnskaː ʒupǎnija]) is a Croatian county in western Slavonia. Its capital is Požega. Its population was 78,034 at the 2011 census.
Alongside the
Geography
Požega-Slavonia county borders on Bjelovar-Bilogora County in the northwest, Virovitica-Podravina County in the north, Osijek-Baranja County in the northeast, Brod-Posavina County in the south, and Sisak-Moslavina County in the southwest.
Administrative divisions
Požega-Slavonija County is divided into:
- City of Požega (county seat)
- Town of Lipik
- Town of Pakrac
- Town of Kutjevo
- Town of Pleternica
- Municipalities:
| Municipality | Area (km2) | Population (2011 census) |
Settlements |
|---|---|---|---|
| Brestovac | 279.53 | 3,726 | Amatovci • Bogdašić • Bolomače • Boričevci • Brestovac • Busnovi • Crljenci • Čečavac • Čečavački Vučjak • Daranovci • Deževci • Dolac • Donji Gučani • Gornji Gučani • Ivandol • Jaguplije • Jeminovac • Kamenska • Kamenski Šeovci • Kamenski Vučjak • Koprivna • Kruševo • Kujnik • Mihajlije • Mijači • Mrkoplje • Novo Zvečevo • Nurkovac • Oblakovac • Orljavac • Pasikovci • Pavlovci • Perenci • Podsreće • Požeški Brđani • Rasna • Ruševac • Sažije • Skenderovci • Sloboština • Striježevica • Šnjegavić • Šušnjari • Vilić Selo • Vranić • Zakorenje • Završje • Žigerovci |
| Kaptol | 90 | 3,472 | Alilovci • Bešinci • Češljakovci • Doljanovci • Golo Brdo • Kaptol • Komarovci • Novi Bešinci • Podgorje • Ramanovci |
| Čaglin | 179 | 2,723 | Čaglin • Darkovac • Djedina Rijeka • Dobra Voda • Dobrogošće • Draganlug • Duboka • Imrijevci • Ivanovci • Jasik • Jezero • Jurkovac • Kneževac • Latinovac • Migalovci • Milanlug • Mokreš • Nova Lipovica • Nova Ljeskovica • Novi Zdenkovac • Paka • Ruševo • Sapna • Sibokovac • Sovski Dol • Stara Ljeskovica • Stari Zdenkovac • Stojčinovac • Veliki Bilač • Vlatkovac • Vukojevica |
| Velika | 154 | 5,607 | Antunovac • Biškupci • Bratuljevci • Doljanci • Draga • Gornji Vrhovci • Kantrovci • Klisa • Lučinci • Markovac • Milanovac • Milivojevci • Nježić • Oljasi • Ozdakovci • Poljanska • Potočani • Radovanci • Smoljanovci • Stražeman • Toranj • Trenkovo • Trnovac • Velika |
| Jakšić | 43.70 | 4,058 | Bertelovci • Cerovac • Eminovci • Granje • Jakšić • Radnovac • Rajsavac • Svetinja • Tekić • Treštanovci |
Demographics

|
| |||||||||||||||||||||||||||||||||||||||||||||||||||||||||
| Source: Naselja i stanovništvo Republike Hrvatske 1857–2001, Croatian Bureau of Statistics, Zagreb, 2005 | ||||||||||||||||||||||||||||||||||||||||||||||||||||||||||
As of the 2021 census, the county had 64,420 residents. The population density is 35 people per km2.
| population | 47877 | 53532 | 54183 | 68101 | 79141 | 91272 | 91076 | 99657 | 89646 | 94761 | 99340 | 101745 | 99096 | 99334 | 85831 | 78034 | 64420 |
| 1857 | 1869 | 1880 | 1890 | 1900 | 1910 | 1921 | 1931 | 1948 | 1953 | 1961 | 1971 | 1981 | 1991 | 2001 | 2011 | 2021 |
Ethnic Croats form the majority with 90.4% of the population, followed by Serbs at 6.0%.[4]
Politics
Minority councils and representatives
Directly elected minority councils and representatives are tasked with consulting tasks for the local or regional authorities in which they are advocating for minority rights and interests, integration into public life and participation in the management of local affairs.
See also
References
- ISSN 1333-3305. Retrieved 27 December 2015.
- ^ "Population by Age and Sex, by Settlements, 2011 Census: County of Požega-Slavonia". Census of Population, Households and Dwellings 2011. Zagreb: Croatian Bureau of Statistics. December 2012.
- ^ "Sub-national HDI - Area Database - Global Data Lab". hdi.globaldatalab.org. Retrieved 2021-07-19.
- ^ "Stanovništvo prema narodnosti po gradovima/općinama, Popis 2011". Croatian Bureau of Statistics. Retrieved 4 December 2014.
- ^ "Manjinski izbori prve nedjelje u svibnju, kreću i edukacije". T-portal. 13 March 2023. Retrieved 2 May 2023.
- ^ a b "Informacija o konačnim rezultatima izbora članova vijeća i izbora predstavnika nacionalnih manjina 2023. XI. POŽEŠKO-SLAVONSKA ŽUPANIJA" (PDF) (in Croatian). Državno izborno povjerenstvo Republike Hrvatske. 2023. p. 3-4. Retrieved 3 June 2023.
External links
- Official website
 (in Croatian)


