Political spectrum
| Part of the Politics series |
| Party politics |
|---|
|
|
A political spectrum is a system to characterize and classify different
Most long-standing spectra include the
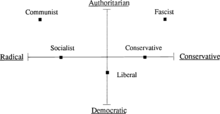
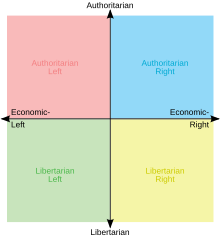
Some political scientists have noted that a single left–right axis is too simplistic and insufficient for describing the existing variation in political beliefs and include other axes to compensate for this problem.[1][9] Although the descriptive words at polar opposites may vary, the axes of popular biaxial spectra are usually split between economic issues (on a left–right dimension) and socio-cultural issues (on an authority–liberty dimension).[1][10]
Historical origin of the terms

The terms right and left refer to political affiliations originating early in the French Revolutionary era of 1789–1799 and referred originally to the seating arrangements in the various legislative bodies of France.[6] As seen from the Speaker's seat at the front of the Assembly, the aristocracy sat on the right (traditionally the seat of honor) and the commoners sat on the left, hence the terms right-wing politics and left-wing politics.[6]
Originally, the defining point on the ideological spectrum was the
The reason for this apparent contradiction lies in the fact that those
As capitalist economies developed, the aristocracy became less relevant and were mostly replaced by capitalist representatives. The size of the working class increased as capitalism expanded and began to find expression partly through trade unionist, socialist, anarchist, and communist politics rather than being confined to the capitalist policies expressed by the original Left. This evolution has often pulled parliamentary politicians away from laissez-faire economic policies, although this has happened to different degrees in different countries, especially those with a history of issues with more authoritarian-left countries, such as the Soviet Union or China under Mao Zedong.[citation needed] Thus, the word "Left" in American political parlance may refer to "liberalism" and be identified with the Democratic Party, whereas in a country such as France these positions would be regarded as relatively more right-wing, or centrist overall, and "left" is more likely to refer to "socialist" or "social-democratic" positioned rather than "liberal" ones.[citation needed]
Academic investigation
For almost a century, social scientists have considered the problem of how to best describe political variation.
Leonard W. Ferguson
In 1950, Leonard W. Ferguson analyzed political values using ten scales measuring attitudes toward:
This system was derived empirically, as rather than devising a political model on purely theoretical grounds and testing it, Ferguson's research was exploratory. As a result of this method, care must be taken in the interpretation of Ferguson's three factors, as factor analysis will output an abstract factor whether an objectively real factor exists or not.[11] Although replication of the nationalism factor was inconsistent, the finding of religionism and humanitarianism had a number of replications by Ferguson and others.[12][13]
Hans Eysenck

Shortly afterward,
Such analysis produces a factor whether or not it corresponds to a real-world phenomenon and so caution must be exercised in its interpretation. While Eysenck's R-factor is easily identified as the classical "left–right" dimension, the T-factor (representing a factor drawn at right angles to the R-factor) is less intuitive, as high-scorers favored pacifism, racial equality, religious education and restrictions on abortion, while low-scorers had attitudes more friendly to militarism, harsh punishment, easier divorce laws and companionate marriage.
According to social scientist Bojan Todosijevic, radicalism was defined as positively viewing evolution theory, strikes, welfare state, mixed marriages, student protests, law reform, women's liberation, United Nations, nudist camps, pop-music, modern art, immigration, abolishing private property, and rejection of patriotism. Conservatism was defined as positively viewing white superiority, birching, death penalty, antisemitism, opposition to nationalization of property, and birth control. Tender-mindedness was defined by moral training, inborn conscience, Bible truth, chastity, self-denial, pacifism, anti-discrimination, being against the death penalty, and harsh treatment of criminals. Tough-mindedness was defined by compulsory sterilization, euthanasia, easier divorce laws, racism, antisemitism, compulsory military training, wife swapping, casual living, death penalty, and harsh treatment of criminals. [15]
Despite the difference in
Eysenck's dimensions of R and T were found by factor analyses of values in Germany and Sweden,[17] France[16] and Japan.[18]
One interesting result Eysenck noted in his 1956 work was that in the
Relationship between Eysenck's political views and political research
Eysenck's political views related to his research: Eysenck was an outspoken opponent of what he perceived as the
Eysenck left
Subsequent criticism of Eysenck's research
Eysenck's conception of tough-mindedness has been criticized for a number of reasons.
- Virtually no values were found to load only on the tough/tender dimension.
- The interpretation of tough-mindedness as a manifestation of "authoritarian" versus tender-minded "democratic" values was incompatible with the Frankfurt School's single-axis model, which conceptualized authoritarianism as being a fundamental manifestation of conservatism and many researchers took issue with the idea of "left-wing authoritarianism".[25]
- The theory which Eysenck developed to explain individual variation in the observed dimensions, relating tough-mindedness to extroversion and psychoticism, returned ambiguous research results.[26]
- Eysenck's finding that Nazis and communists were more tough-minded than members of mainstream political movements was criticised on technical grounds by Milton Rokeach.[27]
- Eysenck's method of analysis involves the finding of an abstract dimension (a factor) that explains the spread of a given set of data (in this case, scores on a political survey). This abstract dimension may or may not correspond to a real material phenomenon and obvious problems arise when it is applied to human psychology. The second factor in such an analysis (such as Eysenck's T-factor) is the second best explanation for the spread of the data, which is by definition drawn at right angles to the first factor. While the first factor, which describes the bulk of the variation in a set of data, is more likely to represent something objectively real, subsequent factors become more and more abstract. Thus one would expect to find a factor that roughly corresponds to "left" and "right", as this is the dominant framing for politics in our society, but the basis of Eysenck's "tough/tender-minded" thesis (the second, T-factor) may well represent nothing beyond an abstract mathematical construct. Such a construct would be expected to appear in factor analysis whether or not it corresponded to something real, thus rendering Eysenck's thesis unfalsifiable through factor analysis.[28][29][30]
Milton Rokeach
Dissatisfied with Hans J. Eysenck's work,
Rokeach claimed that the defining difference between the left and right was that the left stressed the importance of equality more than the right. Despite his criticisms of Eysenck's tough–tender axis, Rokeach also postulated a basic similarity between communism and Nazism, claiming that these groups would not value freedom as greatly as more conventional social democrats, democratic socialists and capitalists would and he wrote that "the two value model presented here most resembles Eysenck's hypothesis".[31]
To test this model, Rokeach and his colleagues used content analysis on works exemplifying Nazism (written by Adolf Hitler), communism (written by Vladimir Lenin), capitalism (by Barry Goldwater) and socialism (written by various authors). This method has been criticized for its reliance on the experimenter's familiarity with the content under analysis and its dependence on the researcher's particular political outlooks.
Multiple raters made frequency counts of sentences containing
- Socialists (socialism) — freedom ranked 1st, equality ranked 2nd
- Hitler (Nazism) – freedom ranked 16th, equality ranked 17th
- Goldwater (capitalism) — freedom ranked 1st, equality ranked 16th
- Lenin (communism) — freedom ranked 17th, equality ranked 1st
Later studies using samples of American
Later research
In further research,[34] Eysenck refined his methodology to include more questions on economic issues. Doing this, he revealed a split in the left–right axis between social policy and economic policy, with a previously undiscovered dimension of socialism-capitalism (S-factor).
While factorially distinct from Eysenck's previous R factor, the S-factor did positively
Most research and
Another replication came from
Though not directly related to Eysenck's research, evidence suggests there may be as many as 6 dimensions of political opinions in the United States and 10 dimensions in the United Kingdom. This conclusion was based on two large datasets and uses a Bayesian approach rather than the traditional factor analysis method.[36]
Other double-axis models
Greenberg and Jonas: left–right, ideological rigidity
In a 2003 Psychological Bulletin paper,[37] Jeff Greenberg and Eva Jonas posit a model comprising the standard left–right axis and an axis representing ideological rigidity. For Greenberg and Jonas, ideological rigidity has "much in common with the related concepts of dogmatism and authoritarianism" and is characterized by "believing in strong leaders and submission, preferring one's own in-group, ethnocentrism and nationalism, aggression against dissidents, and control with the help of police and military". Greenberg and Jonas posit that high ideological rigidity can be motivated by "particularly strong needs to reduce fear and uncertainty" and is a primary shared characteristic of "people who subscribe to any extreme government or ideology, whether it is right-wing or left-wing".
Inglehart: traditionalist–secular and self expressionist–survivalist

In its 4 January 2003 issue,
Pournelle: liberty–control, irrationalism–rationalism
This very distinct two-axis model was created by
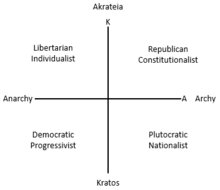
Mitchell: Eight Ways to Run the Country

- Republican constitutionalism = pro archy, anti kratos
- Libertarian individualism = anti archy, anti kratos
- Democratic progressivism = anti archy, pro kratos
- Plutocratic nationalism= pro archy, pro kratos
Mitchell charts these traditions graphically using a vertical axis as a scale of kratos/
From the four main political traditions, Mitchell identifies eight distinct political perspectives diverging from a populist center. Four of these perspectives (Progressive, Individualist, Paleoconservative, and Neoconservative) fit squarely within the four traditions; four others (Paleolibertarian, Theoconservative, Communitarian, and Radical) fit between the traditions, being defined by their singular focus on rank or force.
Nolan: economic freedom, personal freedom

The
Spatial model
The spatial model of voting plots voters and candidates in a multi-dimensional space where each dimension represents a single political issue[39][40] sub-component of an issue,[a] or candidate attribute.[41] Voters are then modeled as having an "ideal point" in this space and voting for the nearest candidates to that point. The dimensions of this model can also be assigned to non-political properties of the candidates, such as perceived corruption, health, etc.[39]
Most of the other spectra in this article can then be considered projections of this multi-dimensional space onto a smaller number of dimensions.[42] For example, a study of German voters found that at least four dimensions were required to adequately represent all political parties.[42]
Other proposed dimensions


In 1998, political author
Other proposed axes include:
- Focus of political concern: communitarianon this axis, but is not totalitarian or undemocratic.
- Responses to conflict: according to the political philosopher Charles Blattberg, in his essay Political Philosophies and Political Ideologies, those who would respond to conflict with conversation should be considered as on the left, with negotiation as in the centre, and with force as on the right.[44]
- Role of the church: clericalism vs. anti-clericalism. This axis is less significant in the United States (where views of the role of religion tend to be subsumed into the general left–right axis) than in Europe (where clericalism versus anti-clericalism is much less correlated with the left–right spectrum).
- Urban vs. rural: this axis is significant today in the Federalists and Jeffersonian Republicans.
- Foreign policy: interventionism (the nation should exert power abroad to implement its policy) vs. non-interventionism (the nation should keep to its own affairs). Similarly, multilateralism (coordination of policies with other countries) vs. isolationism and unilateralism
- Geopolitics: relations with individual states or groups of states may also be vital to Canadian history relations with Britain were a central theme, although this was not "foreign policy" but a debate over the proper place of Canada within the British Empire.
- International action: multilateralism (states should cooperate and compromise) versus unilateralism (states have a strong, even unconditional, right to make their own decisions).
- Political violence: doves" and "hawks", respectively.
- Foreign trade: Commonwealth of Australia, this was the major political continuum. At that time it was called free trade vs. protectionism.
- Trade freedom vs. trade equity: free trade (businesses should be able trade across borders without regulations) vs. fair trade (international trade should be regulated on behalf of social justice).
- Diversity: assimilationism or nationalism(the nation should primarily represent, or forge, a majority culture).
- Participation: philosopher, resulting in the tyrant pursuing his own desires rather than the common good.
- Freedom: positive liberty (having rights which impose an obligation on others) vs. negative liberty (having rights which prohibit interference by others).
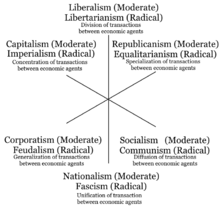
- Social power: totalitarianism vs. anarchism (control vs. no control) Analyzes the fundamental political interaction among people, and between individuals and their environment. Often posits the existence of a moderate system as existing between the two extremes.
- Change: radical revolutionaries (who believe in rapid change in support of an ideology) vs. progressives (who believe in advancing change to the status quo) vs. liberals (who passively accept change) vs. conservatives (who believe in moderating change to preserve the status quo) vs. radical reactionaries(who believe in changing things to a previous state, i.e. status quo ante).
- Political moderates oppose radical (revolutionary or reactionary) policies, but they may have progressive, conservative, or liberal tendencies.
- Origin of state authority: organic state philosophy (the state as an original and essential authority) vs. the view held in anarcho-primitivism that "civilization originates in conquest abroad and repression at home".[45]
- Levels of sovereignty: centralism vs. regionalism. Especially important in societies where strong regional or ethnic identities are political issues.
- European federalism; nation state vs. multinational state.
- Globalization: Nationalism or Patriotism vs. Cosmopolitanism or Internationalism; sovereignty vs. global governance.
- Openness: closed (culturally conservative and protectionist) vs. open (socially liberal and globalist). Popularised as a concept by Tony Blair in 2007 and increasingly dominant in 21st century European and North American politics.[46][47]
- Propertarianism: Support or opposition to "sticky" private property.
Political-spectrum-based forecasts
As shown by Russian political scientist Stepan S. Sulakshin,[48] political spectra can be used as a forecasting tool. Sulakshin offered mathematical evidence that stable development (positive dynamics of the vast number of statistic indices) depends on the width of the political spectrum: if it is too narrow or too wide, stagnation or political disasters will result. Sulakshin also showed that in the short run the political spectrum determines the statistic indices dynamic and not vice versa.
Biological variables
A number of studies have found that biology can be linked with political orientation.[49] Many of the studies linking biology to politics remain controversial and unreplicated, although the overall body of evidence is growing.[50]
Studies have found that subjects with
See also
|
|
References
Notes
- ^ If voter preferences have more than one peak along a dimension, it needs to be decomposed into multiple dimensions that each only have a single peak. "We can satisfy our assumption about the form of the loss function if we increase the dimensionality of the analysis — by decomposing one dimension into two or more"
Citations
- ^ OCLC 988218349.
- ^ doi:10.4119/jsse-541. Archived from the originalon 22 June 2019. Retrieved 27 June 2019.
- ^ .
- S2CID 144774197.
- S2CID 143494130.
- ^ ISBN 978-0-203-40260-3.]
France invented the terms Left and Right early in the great Revolution of 1789– 94 which first limited the powers of, and then overthrew, the Bourbon monarchy.
[dead link - ISBN 978-0-19-289249-2.
- ISBN 978-0-415-24359-9.
- ^ OCLC 1021804010.
- ^ OCLC 893684473.
- ^ SAS(R) 3.11 Users Guide, Multivariate Analysis: Factor Analysis
- .
- doi:10.1037/h0093615.
- ^ "politics". Retrieved 5 May 2016.
- ^ Todosijevic, Bojan (2013). Political Attitudes and Mentalities. Eastern European Political Cultures: Modeling Studies. ArsDocendi-Bucharet University Press. pp. 23–52.
- ^ a b c d Eysenck, H.J. (1956). Sense and nonsense in psychology. London: Penguin Books.
- PMID 13108438.
- ISBN 978-0-19-631779-3.
- ^ Eysenck, H.J. (1981). "Left-Wing Authoritarianism: Myth or Reality?, by Hans J. Eysenck" Political Psychology
- ^ "An Interview with Prof. Hans Eysenck", Beacon February 1977
- ^ Stephen Rose, "Racism" Nature 14 September 1978, volume 275, page 86
- ^ Billig, Michael. (1979) "Psychology, Racism and Fascism", Chapter 6, footnote #70. Published by A.F. & R. Publications.
- ^ Stephen Rose, "Racism Refuted", Nature 24 August 1978, volume 274, page 738
- ^ Stephen Rose, "Racism", Nature 14 September 1978, volume 275, page 86
- JSTOR 3790998.
- .
- PMID 13297921.
- ^ Wiggins, J.S. (1973) Personality and Prediction: Principles of Personality Assessment. Addison-Wesley
- ^ Lykken, D. T. (1971) Multiple factor analysis and personality research. Journal of Experimental Research in Personality 5: 161–170.
- ^ Ray JJ (1973) Factor analysis and attitude scales. The Australian and New Zealand Journal of Sociology 9(3):11–12.
- ^ a b Rokeach, Milton (1973). The nature of human values. Free Press.
- .
- S2CID 145103089. Archived from the originalon 14 May 2013.
- S2CID 145323731. Archived from the originalon 14 May 2013.
- ^ a b Inglehart, Ronald; Welzel, Christian. "The WVS Cultural Map of the World". World Values Survey. Archived from the original on 31 October 2011. Retrieved 18 December 2013.
- ^ Lewenberg, Yoad (June 2016). "Political dimensionality estimation using a probabilistic graphic model". Proceedings of the Thirty-Second Conference on Uncertainty in Artificial Intelligence: 447–456.
- PMID 12784935. Archived from the original(PDF) on 7 April 2008. Retrieved 24 April 2008.
- ISBN 978-0-275-99358-0.
- ^ S2CID 1161006.
Since our model is multi-dimensional, we can incorporate all criteria which we normally associate with a citizen's voting decision process — issues, style, partisan identification, and the like.
- ISSN 1047-1987.
The spatial model of voting is the work horse for theories and empirical models in many fields of political science research, such as the equilibrium analysis in mass elections ... the estimation of legislators' ideal points ... and the study of voting behavior. ... Its generalization to the multidimensional policy space, the Weighted Euclidean Distance (WED) model ... forms the stable theoretical foundation upon which nearly all present variations, extensions, and applications of multidimensional spatial voting rest.
- ^ Tideman, T; Plassmann, Florenz (June 2008). "The Source of Election Results: An Empirical Analysis of Statistical Models of Voter Behavior".
Assume that voters care about the "attributes" of candidates. These attributes form a multi-dimensional "attribute space."
- ^ hdl:1765/111247.
The analysis reveals that the underlying political landscapes ... are inherently multidimensional and cannot be reduced to a single left-right dimension, or even to a two-dimensional space. ... From this representation, lower-dimensional projections can be considered which help with the visualization of the political space as resulting from an aggregation of voters' preferences. ... Even though the method aims to obtain a representation with as few dimensions as possible, we still obtain representations with four dimensions or more.
- S2CID 141074567.
- SSRN 1755117.
- ^ Diamond, Stanley, In Search Of The Primitive: A Critique Of Civilization, (New Brunswick: Transaction Books, 1981), p. 1.
- ^ "The new political divide". The Economist. 30 July 2016. Retrieved 24 April 2017.
- ^ Pethokoukis, James (1 July 2016). "The Closed Party vs. the Open Party". American Enterprise Institute. Retrieved 24 April 2017.
- doi:10.18848/1833-1882/CGP/v05i04/51654. Archived from the originalon 18 August 2011. Retrieved 4 May 2011.
- ^ S2CID 10675844.
- PMID 23099382.
- ^ PMID 21474316.
- S2CID 7411404.
- ^ "Brains of Liberals, Conservatives May Work Differently". Psych Central. 20 October 2007. Archived from the original on 13 October 2016.
- ^ S2CID 59571553.
- PMID 17032067.
- S2CID 1778256.
- ^ Carey, Benedict (21 June 2005). "Some Politics May Be Etched in the Genes". The New York Times. Retrieved 25 September 2012.
- S2CID 3820911.
- ISBN 9780199586073.
