
Pressure–volume diagram
| Thermodynamics |
|---|
 |


A pressure–volume diagram (or PV diagram, or volume–pressure loop)
PV diagrams, originally called indicator diagrams, were developed in the 18th century as tools for understanding the efficiency of steam engines.
Description
A PV diagram plots the change in pressure P with respect to volume V for some process or processes. Typically in thermodynamics, the set of processes forms a cycle, so that upon completion of the cycle there has been no net change in state of the system; i.e. the device returns to the starting pressure and volume.[citation needed]
The figure shows the features of an idealized PV diagram. It shows a series of numbered states (1 through 4). The path between each state consists of some process (A through D) which alters the pressure or volume of the system (or both).

A key feature of the diagram is that the amount of energy expended or received by the system as work can be measured because the net work is represented by the area enclosed by the four lines. In the figure, the processes 1-2-3 produce a work output, but processes from 3-4-1 require a smaller energy input to return to the starting position / state; so the net work is the difference between the two. This figure is highly idealized, in so far as all the lines are straight and the corners are right angles. A diagram showing the changes in pressure and volume in a real device will show a more complex shape enclosing the work cycle. [citation needed] (§ Applications).
History

The PV diagram, then called an indicator diagram, was developed in 1796 by
Applications
Thermodynamics

[3] Specifically, the diagram records the pressure of steam versus the volume of steam in a cylinder, throughout a piston's cycle of motion in a steam engine. The diagram enables calculation of the work performed and thus can provide a measure of the power produced by the engine.[4]
To exactly calculate the work done by the system it is necessary to calculate the integral of the pressure with respect to volume. One can often quickly calculate this using the PV diagram as it is simply the area enclosed by the cycle.[citation needed]
Note that in some cases specific volume will be plotted on the x-axis instead of volume, in which case the area under the curve represents work per unit mass of the working fluid (i.e. J/kg).[citation needed]
Medicine
In
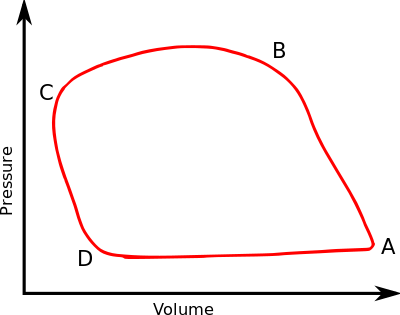
The sequence of events occurring in every heart cycle is as follows. The left figure shows a PV loop from a real experiment; letters refer to points.
-
 Example PV loop diagram of a mouse left ventricle
 -
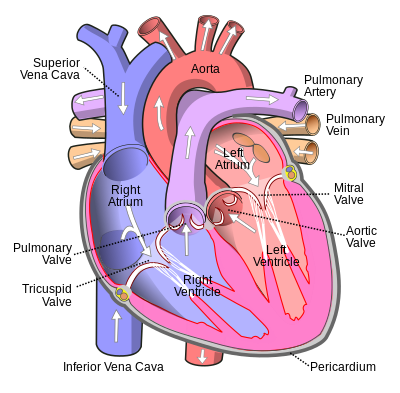 Human heart

.svg)
- A is the end-diastolic point; this is the point where contraction begins. Pressure starts to increase, becomes rapidly higher than the atrial pressure, and the mitral valve closes. Since pressure is also lower than the aortic pressure, the aortic valve is closed as well.
- Segment AB is the contraction phase. Since both the mitral and aortic valves are closed, volume is constant. For this reason, this phase is called isovolumic contraction.
- At point B, pressure becomes higher than the aortic pressure and the aortic valve opens, initiating ejection.
- BC is the ejection phase, volume decreases. At the end of this phase, pressure lowers again and falls below aortic pressure. The aortic valve closes.
- Point C is the end-systolicpoint.
- Segment CD is the isovolumic relaxation. During this phase, pressure continues to fall. The mitral valve and aortic valve are both closed again so volume is constant.
- At point D pressure falls below the atrial pressure and the mitral valve opens, initiating ventricular filling.
- DA is the diastolic filling period. Blood flows from the left atrium to the left ventricle. Atrial contraction completes ventricular filling.
As it can be seen, the PV loop forms a roughly rectangular shape and each loop is formed in an anti-clockwise direction.
Very useful information can be derived by examination and analysis of individual loops or series of loops, for example:
- the horizontal distance between the top-left corner and the bottom-right corner of each loop is the stroke volume[5]
- the line joining the top-left corner of several loops is the contractile or inotropic state.[6]
See external links for a much more precise representation.
See also
- Indicator diagram
- Temperature–entropy diagram
- Wiggers diagram
- Stroke volume
- Cyclic process
- Pressure–volume loop experiments
- Pressure–volume loop analysis in cardiology
References
- ^ Nosek, Thomas M. "Section 3/3ch5/s3ch5_16". Essentials of Human Physiology. Archived from the original on 2016-03-24.
- ISBN 0-8018-9359-3
- ^ Walter, John (2008). "The Engine Indicator" (PDF). pp. xxv–xxvi. Archived from the original (PDF) on 2012-03-10.
- ^ Richard L. Hills and A. J. Pacey (January 1972) "The measurement of power in early steam-driven textile mills," Technology and Culture, vol. 13, no. 1, pages 25–43.
- ^ "Diagram at uc.edu". Archived from the original on 2008-06-22. Retrieved 2006-12-12.
- ^ Systolic dysfunction
Bibliography
- Cardwell, D. S. L. (1971). From Watt to Clausius: The Rise of Thermodynamics in the Early Industrial Age. Heinemann: London. pp. 79–81. ISBN 0-435-54150-1.
- Miller, D. P. (2011). "The Mysterious Case of James Watt's '"1785" Steam Indicator': Forgery or Folklore in the History of an Instrument?". International Journal for the History of Engineering & Technology. 81: 129–150. S2CID 109538193.
- Pacey, A. J. & Fisher, S. J. (1967) "Daniel Bernoulli and the vis viva of compressed air", The British Journal for the History of Science 3 (4), p. 388–392,
- British Transport Commission (1957) Handbook for Railway Steam Locomotive Enginemen, London : B.T.C., p. 81, (facsimile copy publ. Ian Allan (1977), ISBN 0-7110-0628-8)
External links
- Walter, John. "The Engine Indicator. A collectors' guide to mechanical and optical/mechanical designs, 1800 to date". Canadian Museum of Making.
- Diagram at cvphysiology.com
- Interactive demonstration at davidson.edu
- Lohff B (1999). "1899: the first mathematical description of the pressure-volume diagram by PMID 10705804.