
Renewable energy in the United States

Renewable energy sources in 2022. Renewables were 8.4% of total energy, or 8.3 quads.[1]
Renewable electricity sources in 2022. Renewables were 21% of total electricity, or 907 TWh.[2]
| Part of a series on |
| Renewable energy |
|---|
 |
According to data from the US Energy Information Administration, renewable energy accounted for 8.4% of total primary energy production[1] and 21% of total utility-scale electricity generation in the United States in 2022.[3]
Since 2019,
Solar power provides a growing share of electricity in the country, with over 111.6 GW of installed capacity generating about 3.4% of the country's total electricity supply in 2022, up from 2.8% the previous year. As of 2020, more than 260,000 people worked in the solar industry and
Other renewable energy sources include geothermal, with The Geysers in Northern California the largest geothermal complex in the world.
The development of renewable energy and energy efficiency marked "a new era of energy exploration" in the United States, according to former President
Rationale for renewables
Renewable energy technologies encompass a broad, diverse array of technologies, including
The report
America needs energy that is secure, reliable, improves public health, protects the environment, addresses climate change, creates jobs, and provides technological leadership. America needs renewable energy. If renewable energy is to be developed to its full potential, America will need coordinated, sustained federal and state policies that expand renewable energy markets; promote and deploy new technology; and provide appropriate opportunities to encourage renewable energy use in all critical energy market sectors: wholesale and distributed electricity generation, thermal energy applications, and transportation.[15]
Another benefit of some renewable energy technologies, like wind and solar photovoltaics (PV) is that they require little or no water to generate electricity whereas thermoelectric (fossil fuel-based) power plants require vast amounts of water for operation.
In 2009, President Barack Obama in the inaugural address called for the expanded use of renewable energy to meet the twin challenges of energy security and climate change. Those were the first references ever to the nation's energy use, to renewable resources, and to climate change in an inauguration speech of a United States president. President Obama looked to the near future, saying that as a nation, the United States will "harness the sun and the winds and the soil to fuel our cars and run our factories."[16]
The president's
In his
As of 2011, new evidence has emerged that there are considerable risks associated with traditional energy sources, and that major changes to the mix of energy technologies is needed:
Several mining tragedies globally have underscored the human toll of the coal supply chain. New EPA initiatives targeting air toxins, coal ash, and effluent releases highlight the environmental impacts of coal and the cost of addressing them with control technologies. The use of fracking in natural gas exploration is coming under scrutiny, with evidence of groundwater contamination and greenhouse gas emissions. Concerns are increasing about the vast amounts of water used at coal-fired and nuclear power plants, particularly in regions of the country facing water shortages. Events at the
Fukushima nuclear plant have renewed doubts about the ability to operate large numbers of nuclear plants safely over the long term. Further, cost estimates for “next generation” nuclear units continue to climb, and lenders are unwilling to finance these plants without taxpayer guarantees.[18]
Renewable energy and carbon dioxide emissions
Between 2010 and 2020, the cost of wind, solar, and natural gas dropped dramatically.[19] In 2018, EIA expected that, after rising by 2.7% in 2018, U.S. energy-related carbon dioxide (CO2) emissions would decrease by 2.5% in 2019 and by 1.0% in 2020[20] due to a shift away from coal and toward renewables and natural gas.
Renewable energy has the potential to reduce CO2 emissions in three key energy use sectors: transport, heating and cooling (including building heating and air conditioning, industrial heat usage, etc.), and electricity. The year 2018 had been a peak year for the use of air conditioning, which was expected to decline.[20]
Current trends
Renewable energy in the electricity sector


Renewable energy accounted for 14.94% of the domestically produced electricity in 2016 in the United States.
The United States has some of the best renewable energy resources in the world, with the potential to meet a rising and significant share of the nation's energy demand. A quarter of the country's land area has winds strong enough to generate electricity at the same price as natural gas and coal.[28]
Many of the new technologies that harness renewables—including wind, solar, geothermal, and biofuels—are, or soon will be, economically competitive with the fossil fuels that meet 85% of United States energy needs. Dynamic growth rates are driving down costs and spurring rapid advances in technologies.[28] Wind power and solar power are becoming increasingly important relative to the older and more established hydroelectric power source. By 2016 wind power covered 37.23% of total renewable electricity production against 43.62% for hydroelectric power. The remaining share of power was generated by biomass at 10.27%, solar power at 6.03% and geothermal with 2.86% of total renewable generation.
In 2015, Georgetown, Texas became one of the first American cities to be powered entirely by renewable energy, choosing to do so for financial stability reasons.[29]
The United States consumed about 4,000 TWh of electricity in 2012, and about 30,000 TWh (98 quadrillion BTU) of primary energy. Efficiency improvements are expected to reduce usage to 15,000 TWh by 2050.

| Source | Capacity (GW) |
Capacity factor |
Generation (TWh) |
Share of | |||
|---|---|---|---|---|---|---|---|
| renew. | total | ||||||
| Wind | 136.7 | 0.36 | 434.3 | 45.1% | 10.1% | ||
| Hydro | 80.1 | 0.36 | 254.8 | 26.5% | 5.9% | ||
| Solar | 111.2 | 0.24 | 205.1 | 21.3% | 4.8% | ||
| Biomass | 12.2 | 0.59 | 51.8 | 5.4% | 1.2% | ||
| Geothermal | 2.6 | 0.59 | 16.1 | 1.7% | 0.4% | ||
| Total | 342.8 | 0.31 | 962.1 | 100% | 22.4% | ||
| Note: Solar includes estimated small scale. Biomass includes wood and wood-derived fuel, landfill gas, biogenic municipal solid waste and other waste biomass. | |||||||
Future projections
Using data from Electric Power Annual 2018
Renewable electricity sources
Hydroelectricity

| Name | Year of completion | Total capacity ( MW )
|
|---|---|---|
| Grand Coulee | 1942/1980 | [32] 6,809 |
| Bath County PSP | 1985 | 3,003 |
| Robert Moses Niagara Power Plant | 1961 | 2,675 |
| Chief Joseph Dam | 1958/73/79 | 2,620 |
| John Day Dam | 1949 | 2,160 |
| The Dalles Dam | 1981 | 2,160 |
| Hoover Dam | 1936/1961 | 2,080 |
-
 HYDRO Generated Electric Energy Profile 2022-2021
 -
 10 Yr Hydro Generated Electric Energy Profile 2022-2012
 -
 10 Year Hydro Generation for the Top Ten Hydro States
 -
 10 Years of Hydro Generation by States outside the Top Ten


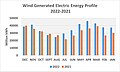
Wind power

Wind power capacity in the United States tripled from 2008 to 2016, at which time it supplied over 5% of the country's total electricity generation. Wind power overtook hydroelectric as the largest source of renewable electricity generation in 2019, and accounted for 10.25% of the country's total electricity generation by in 2022.[34] Wind and solar accounted for two-thirds of new energy installations in the United States in 2015.[35] United States wind power installed capacity exceeds 141 GW as of 2023.[2] This capacity is exceeded only by China.
The 1550MW Alta Wind Energy Center is the largest wind farm in the United States and the second largest in the world behind the Gansu Wind Farm.[36]
There were 90,000 wind operations jobs in the United States in 2015. The wind industry in the United States generates tens of thousands of jobs and billions of dollars of economic activity.[37] Wind projects boost local tax bases, and revitalize the economy of rural communities by providing a steady income stream to farmers with wind turbines on their land.[33]
In 2013, wind power received $5.936 billion in federal funding, which is 37% of all federal funding for electricity generation.[38]
The United States has the potential of installing 10
Wind power has particularly surged, with Colorado producing 16,000 GWh in 2023, a testament to the state's investment in this clean energy source.[42]
-
 Wind Generated Electric Energy Profile 2022-2021
 -
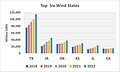 Top Six Wind States
 -
 Top Ten Wind State 2022
 -
 10 Years of Wind Generation by State
 -
 10 Years of Wind Generation 2022
 -
 Wind Farm Generation 2022
 -
 Wind Farm Capacity Factor 2022


| Wind farm | State | Current capacity ( MW )
|
Notes |
|---|---|---|---|
| Alta (Oak Creek-Mojave) | California | 1,320 | [43] |
| Buffalo Gap Wind Farm | Texas | 523 | [44][45] |
| Capricorn Ridge Wind Farm | Texas | 663 | [44][45] |
| Cedar Creek Wind Farm | Colorado | 551 | |
| Fowler Ridge Wind Farm | Indiana | 600 | [46] |
| Horse Hollow Wind Energy Center | Texas | 736 | [44][45] |
| Meadow Lake Wind Farm | Indiana | 500 | [46] |
| Roscoe Wind Farm | Texas | 782 | [47] |
| Shepherds Flat Wind Farm | Oregon | 845 | |
| Sweetwater Wind Farm | Texas | 585 | [44] |
Solar power
- Solar PV utility-scale
- Solar thermal utility-scale
- Estimated distributed solar PV
The United States is one of the world's largest producers of solar power. The country pioneered solar farms and many key developments in concentrated solar and photovoltaics came out of national research.
In 2022, utility scale solar contributed 145.6 TWh to the grid, with 142.6 TWh from photovoltaics and 3.0 TWh from thermal systems.[2] In 2020, 2021, and 2022, EIA estimated that distributed solar generated 41.522 TWh, 49.164 TWh and 58.512 TWh respectively.[2] While utility-grade systems have well documented generation, distributed systems contributions to user electric power needs are not measured or controlled. Therefore, quantitative evaluation of distributed solar to the country's electric power sector has been lacking. Recently, the Energy Information Administration has begun estimating that contribution.[48][2] Before 2008, most solar-generated electric energy was from thermal systems, however by 2011 photovoltaics had overtaken thermal.
-
 Top Six Solar States
 -
 10 Years of Solar Generation including Small Scale
 -
 Top Ten States for Utility Solar 2022
 -
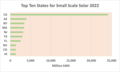 Top Ten States for Small Scale Solar
 -
 Major Solar Farms Generation 2022


Photovoltaics

At the end of 2022, the United States had 70.6
Many schools and businesses have
Beginning with the 2014 data year, Energy Information Administration has estimated distributed solar photovoltaic generation and distributed solar photovoltaic capacity.[48] These non-utility scale estimates that the United States, generated the following additional electric energy from such distributed solar PV systems.[2]
Concentrated solar power
.jpg)
At the end of 2016 there were 1.76 GW total installed capacity of solar thermal power across the United States.[2] Solar thermal power is generally utility-scale. Prior to 2012, in six southwestern states (Arizona, California, Colorado, Nevada, New Mexico, and Utah) the US Bureau of Land Management owned nearly 98 million acres (400,000 km2) (an area larger than the state of Montana) that was open to proposals for solar power installations. To streamline consideration of applications, the BLM produced a Programmatic Environmental Impact Statement (PEIS). By the subsequent Record of Decision in October 2012, the BLM withdrew 78% of its land from possible solar development, leaving 19 million acres (77,000 km2) still open to applications for solar installations, an area nearly as large as South Carolina. Of the area left open to solar proposals, the BLM has identified 285 thousand acres in 17 highly favorable areas it calls Solar Energy Zones.[56][57][58]
Solar thermal power plants designed for solar-only generation are well matched to summer noon peak loads in prosperous areas with significant cooling demands, such as the south-western United States. Using thermal energy storage systems, solar thermal operating periods can even be extended to meet base-load needs.[59]
A 2013 study by the US National Renewable Energy Laboratory concluded that utility-scale solar power plants directly disturb an average of 2.7 to 2.9 acres per gigawatt-hour/year, and use from 3.5 to 3.8 acres per gW-hr/year for the entire sites. According to a 2009 study, this intensity of land use is less than that of the country's average power plant using surface-mined coal.[60] Some of the land in the eastern portion of the Mojave Desert is to be preserved, but the solar industry is more interested in areas of the western desert, "where the sun burns hotter and there is easier access to transmission lines".[61]
Some of the largest solar thermal power plants in the United States are in the south-west of the country, especially in the Mojave Desert.
The
Geothermal power
The United States is the world leader in online capacity and the generation of electricity from geothermal energy.[66] According to 2022 state energy data, geothermal energy provided approximately 16
The most significant catalyst behind new industry activity is the Energy Policy Act of 2005. This Act made new geothermal plants eligible for the full federal production tax credit, previously available only to wind power projects. It also authorized and directed increased funding for research by the Department of Energy, and gave the Bureau of Land Management new legal guidance and secure funding to address its backlog of geothermal leases and permits.[66]


| State | Capacity (MW) |
% of Capacity |
Electric generation (MWh) |
Capacity factor |
|---|---|---|---|---|
| California | 1838 | 74% | 11,559,591 | 0.718 |
| Nevada | 498.2 | 20% | 3,291,874 | 0.754 |
| Utah | 73 | 3% | 480,928 | 0.752 |
| Hawaii | 43 | 1.7% | 322,592 | 0.856 |
| Oregon | 19.5 | 0.8% | 174,381 | 1.0 |
| Idaho | 10 | 0.4% | 84,436 | 0.964 |
| New Mexico | 1.6 | 0.06% | 12,963 | 0.925 |
| Total | 2483.3 | 100% | 15,926,765 | 0.732 |
Biomass
In 2022,


Biomass electric generation data combines two basic categories:
- Wood and wood-derived fuels including wood/wood waste solids (including paper pellets, railroad ties, utility poles, wood chips, bark and wood waste solids), wood waste liquids (red liquor, sludge wood, spent sulfite liquor, and other wood-based liquids), and black liquor;
- Other biomass fuels include municipal solid waste, landfill gas, sludge waste agricultural byproducts, other biomass solids, other biomass liquids, and other biomass gases (including digester gases, methane, and other biomass gases)
Wave power
Wave power in the United States is under development in several locations off the east and west coasts as well as Hawaii. It has moved beyond the research phase and is producing reliable energy. Its use to-date has been for situations where other forms of energy production are not economically viable and as such, the power output is currently modest. But major installations are planned to come on-line within the next few years.[citation needed]
Solar water heating
The U.S. Department of Energy stated (in 2006) that more than 1.5 million homes and businesses were currently using solar water heating in the United States, representing a capacity of over 1,000 megawatts (MW) of thermal energy generation. It predicted that another 400 MW was likely to be installed over the next 3–5 years.
Assuming that 40 percent of existing homes in the United States have adequate access to sunlight, 29 million solar water heaters could be installed.[68]
Solar water heaters can operate in any climate. Performance varies depending on how much solar energy is available at the site, as well as how cold the water coming into the system is. The colder the water, the more efficiently the system operates.[68]
Solar water heaters reduce the need for conventional water heating by about two-thirds and pay for their installation within 4 to 8 years with electricity or natural gas savings. Compared to those with electric water heaters, Florida homeowners with solar water heaters save 50 to 85 percent on their water heating bills, according to the Florida Solar Energy Center.[68]
Biofuels

Many cars sold in the U.S. since 2001 are able to run on blends of up to 15% ethanol.[69] Older cars in the United States can run on blends of up to 10%
Ninety-five percent of gasoline sold in the U.S.(2016) is blended with 10% ethanol.[71] There are challenges in moving to higher blends, however. Flex-fuel vehicles are assisting in this transition because they allow drivers to choose different fuels based on price and availability. The Energy Independence and Security Act of 2007, which calls for 15.2 billion US gallons (58,000,000 m3) of biofuels to be used annually by 2012, will also help to expand the market.[70] The USDA in 2015 began offering grants to help gasoline retailers install blender pumps for dispensing mid-level ethanol blends.[72]
The expanding ethanol and biodiesel industries are providing jobs in plant construction, operations, and maintenance, mostly in rural communities. According to the Renewable Fuels Association, the ethanol industry created almost 154,000 jobs in 2005 alone, boosting household income by $5.7 billion. It also contributed about $3.5 billion in tax revenues at the local, state, and federal levels.[70] On the other hand, in 2010, the biofuel industry received $6.64 billion in federal government support.[73]
Renewable energy research
There are numerous organizations within the academic, federal, and commercial sectors conducting large-scale advanced research in the field of renewable energy. This research spans several areas of focus across the renewable energy spectrum. Most of the research is targeted at improving efficiency and increasing overall energy yields.[74] Multiple federally supported research organizations have focused on renewable energy in recent years. Two of the most prominent of these labs are Sandia National Laboratories (SNL) and the National Renewable Energy Laboratory (NREL), both of which are funded by the United States Department of Energy and supported by various corporate partners.[75] Sandia has a total budget of $2.4 billion[76] while NREL has a budget of $375 million.[77]
Both the SNL and the NREL, have heavily funded solar research programs.
Wind energy research dates back several decades to the 1970s when NASA developed an analytical model to predict wind turbine power generation during high winds.[84] Today, both the SNL and NREL have programs dedicated to wind research. Sandia's laboratory focuses on the advancement of materials, aerodynamics, and sensors.[85] The NREL wind projects are centered on improving wind plant power production, reducing their capital costs, and making wind energy more cost effective overall.[86] The Field Laboratory for Optimized Wind Energy (FLOWE) at
As the primary source of biofuels in North America, many organizations are conducting research in the area of
Over $1 billion of federal money has been spent on the research and development of hydrogen fuel in the United States.[94] Both the NREL[95] and SNL[96] have departments dedicated to hydrogen research.
White hydrogen

Employment
Accurate estimates regarding job creation as a result of an increasing reliance on renewable energy in the United States are challenging to predict due to unforeseen technological developments, uncertainty surrounding the United States’ future import/export levels of renewable energy technology, and ambiguity regarding
Research done on countries in the European Union has affirmed this positive net employment notion. Towards a green energy economy? Tracking the employment effects of low-carbon technologies in the European Union, a study done by Markandya et al. used a multi-regional input-output model in conjunction with the World Input-Output Database to analyze data from 1995 - 2009 in search of net employment impacts.[100] These years were specifically considered as the European Union's energy structure was shifting significantly towards gas and other renewable forms of energy during this time. Although the country specific affects varied, it was found that 530,000 jobs overall were netted from the transition during this timeframe.[100] Another study done on Germany by Lehr, Lutz, and Edler used the PANTA RHEI model to evaluate the German energy situation by taking positive and negative renewable energy impacts into account.[101] The model considered different assumptions for fossil fuel prices, domestic installations, international trade, and German exports to developing renewable energy world markets. Under almost all of the scenarios, positive net employment effects were exhibited.[101]
Public opinion
According to a 2019 CBS News poll on 2,143 U.S. residents, 42% of American adults under 45 years old thought that the U.S. could realistically transition to 100% renewable energy by 2050 while 29% deemed it unrealistic and 29% were unsure. Those numbers for older Americans are 34%, 40%, and 25%, respectively. Differences in opinion might be due to education as younger Americans are more likely to have been taught about climate change in schools than their elders.[105]
Policy and promotion
The
Some jurisdictions go one step further and have instituted feed-in tariff, which allows any power customer to actually make money by producing more renewable energy than is consumed locally.
From 2006 to 2014, US households received more than $18 billion in federal income tax credits for weatherizing their homes, installing solar panels, buying hybrid and electric vehicles, and other "clean energy" investments. These tax expenditures went predominantly to higher-income Americans. The bottom three income quintiles received about 10% of all credits, while the top quintile received about 60%. The most extreme is the program aimed at electric vehicles, where the top income quintile received about 90% of all credits. Market mechanisms have less skewed distributional effects.[107]
The
In his January 24, 2012,
Some Environmental Protection Agency facilities in the United States use renewable energy for all or part of their supply at the following facilities.[112]
Energy technologies receive government subsidies. In 2016, federal government energy-specific subsidies and supports for renewables, fossil fuels, and nuclear energy were $6,682 million, $489 million and $365 million, respectively. [113] All but a few U.S. states now have incentives in place to promote renewable energy, while more than a dozen have enacted new renewable energy laws in recent years.[when?][28] Renewable energy suffered a political setback in the United States in September 2011 with the bankruptcy of Solyndra, a company that had received a $535 million federal loan guarantee.[114][115]
Net metering

Net metering is a policy by many states in the United States designed to help the adoption of renewable energy. Net metering was pioneered in the United States as a way to allow solar and wind to provide electricity whenever available and allow use of that electricity whenever it was needed, beginning with utilities in Idaho in 1980, and in Arizona in 1981.[116] In 1983, Minnesota passed the first state net metering law.[117] As of March 2015, 44 states and Washington, D.C. have developed mandatory net metering rules for at least some utilities.[118] However, although the states' rules are clear, few utilities actually compensate at full retail rates.[119]
Net metering policies are determined by states, which have set policies varying on a number of key dimensions. TheInitiatives
SunShot
In February 2011, the U.S. Department of Energy (DOE) launched its
Wind Powering America
WPA has focused on states with strong potential for wind energy generation but with few operational projects. WPA provides information about the challenges, benefits, and impacts of wind technology implementation.
Solar America Initiative
The
The DOE Solar Energy Technology Program (SETP) intended to achieve the goals of the SAI through partnerships and strategic alliances by focusing primarily on four areas:
- Market Transformation — activities that address marketplace barriers
- Device and Process Proof of Concept — R&D activities that address novel devices or processes with significant performance or cost advantages
- Component Prototype and Pilot-Scale Production — R&D activities emphasizing development of prototype photovoltaic (PV) components or systems at pilot-scale with demonstrated cost, reliability or performance advantages
- System Development and Manufacturing — collaborative R&D activities among industry and university partners
California Solar Initiative
As part of former Governor Arnold Schwarzenegger's Million Solar Roofs Program, California set a goal to create 3,000 megawatts of new, solar-produced electricity by 2017, with funding of $2.8 billion.[127]
The
Green Power Partnership
The EPA named the top 20 partners in its Green Power Partnership that are generating their own renewable energy on-site. Combined, they generate more than 736 million kilowatt-hours of renewable energy on-site each year, enough to power more than 61,000 average U.S. homes.[129]
.png)
Renewable portfolio standards
A
Bans and moratoriums
By February 2024, at least 15% of counties in the United States had imposed bans or other restrictions to prevent construction of wind and solar projects.[130]
Renewable energy organizations
The
The
An important part of the mission of the National Renewable Energy Laboratory (NREL) is the transfer of NREL-developed technologies to renewable energy markets. NREL's Technology Transfer Office supports laboratory scientists and engineers in the successful and practical application of their expertise and the technologies they develop. R&D staff and facilities are recognized and valued by industry, as demonstrated through many collaborative research projects and licensed technologies with public and private partners. NREL's innovative technologies have also been recognized with 39 R&D 100 Awards.
The
Community renewable energy
Community renewable energy efforts incorporate calls for energy democracy to place the responsibility of the planning and implementation processes of a renewable energy project within a community.[134] Community based renewable energy projects are expected to have a wide range of positive social impacts on top of decreasing fossil fuel usage, such as “acceptance of renewable energy developments; awareness of renewable and sustainable energy technologies and issues; uptake of low carbon technologies; and sustainable/pro-environmental behavior”.[135] However, in a survey conducted within a community about community renewable energy projects, results showed that while there was widespread support for implementation, there were low levels of desire for personal involvement, meaning many people shied away from potentially serving as project leaders.[135] Often times, the degree of ownership is debated within the planning process.[136]
Community renewable energy projects prioritize the participation of the end-user communities, challenging the traditional power structures of renewable energy projects. Community renewable energy projects, and the slew of positive social impacts often associated with them, are only successful with institutional support.[135] Scholarships highlights the prevalence of institutional support in the EU and the UK for community based renewable energy, and not surprisingly, there are many more successful projects in Europe than there are in the United States.[137] Existing literature shows a clear lack of institutional support for community-based renewable energy projects within the United States. However, market-based investments in fields such as community-based solar and wind projects are evident in the US. The private sector has especially increased interest in community solar energy projects within the past couple of years.[138] The differing approaches to community-based renewable energy projects globally may be attributed to the differences within the liberal welfare states of Europe compared to the United States.
Potential resources
The United States has the potential of installing 11
A 2012 report by the National Renewable Energy Laboratory evaluates the potential energy resources for each state of the United States.[140][141]
| Total technical potential | |||
|---|---|---|---|
| Type | Resource | Potential capacity (GW) | Potential generation (TWh) |
| Solar | Urban utility-scale PV | 1,200 | 2,200 |
| Rural utility-scale PV | 153,000 | 280,600 | |
| Rooftop PV | 664 | 800 | |
| Concentrating solar power | 38,000 | 116,100 | |
| Total | 192,922 | 399,810 | |
| Wind | Onshore wind power | 11,000 | 32,700 |
| Offshore wind power | 4,200 | 17,000 | |
| Total | 15,178 | 49,760 | |
| Bioenergy | Biomass/biofuel/methane | 62 | 488 |
| Total | 62 | 488 | |
| Geothermal | Hydrothermal power systems | 38 | 300 |
| Enhanced geothermal systems | 3,976 | 31,300 | |
| Total | 4,014 | 31,653 | |
| Hydro | Hydropower | 60 | 259 |
| Total | 60 | 259 | |
| Total | 212,236 | 481,970 | |
| ||||||||||||||||||||||||||||||||||||||||||||||||||||||||||||||||||||||||||||||||||||||||||||||||||||||||||||||||||||||||||||||||||||||||||||||||||||||||||||||||||||||||||||||||||||||||||||||||||||||||||||||||||||||||||||||||||||||||||||||||||||||||||||||||||||||||||||||||||||||||||||||||||||||||||||||||||||||||||||||||||||||||||||||||||||||||||||||||||||||||||||||||||||||||||||||||||||||||||||||||||||||||||||||||||||||||||||||||||||||||||||||||||||||||||||||||||||||||||||||||||||||||||||||||||||||||||||||||||||||||||||||||||||||||||||||||||||||||||||||||||||||||||||||||||||||||||||||||||||||||||||||||||||||||||||||||||||||||||||||||||||||||||||||||||||||||||||||||||||||||||||||||||||||||||||||||||||||||||||||||||||||||||||||||||||||||||||||||||||||||||||||||||||||||||||||||
| ||||||||||||||||||||||||||||||||||||||||||||||||||||||||||||||||||||||||||||||||||||||||||||||||||||||||||||||||||||||||||||||||||||||||||||||||||||||||||||||||||||||||||||||||||||||||||||||||||||||||||||||||||||||||||||||||||||||||||||||||||||||||||||||||||||||||||||||||||||||||||||||||||||||||||||||||||||||||||||||||||||||||||||||||||||||||||||||||||||||||||||||||||||||||||||||||||||||||||||||||||||||||||||||||||||||||||||||||||||||||||||||||||||||||||||||||||||||||||||||||||||||||||||||||||||||||||||||||||||||||||||||||||||||||||||||||||||||||||||||||||||||||||||||||||||||||||||||||||||||||||||||||||||||||||||||||||||||||||||||||||||||||||||||||||||||||||||||||||||||||||||||||||||||||||||||||||||||||||||||||||||||||||||||||||||||||||||||||||||||||||||||||||||||||||||||||
Note: Total use is inflated to create an oil equivalence.
See also
- American Council on Renewable Energy
- Catching the Sun (film)
- Energy conservation in the United States
- Efficient energy use
- Energy policy of the United States
- Lists of renewable energy topics
- List of wind farms in the United States
- List of U.S. states by electricity production from renewable sources
- Renewable energy by country
- Renewable energy commercialization
- Little Box Challenge
References
- ^ a b "Primary Energy Production by Source" (PDF). EIA. February 3, 2024.
- ^ a b c d e f g h i j k l m n "Electric Power Monthly". EIA.
- ^ "Electricity Net Generation: Total (All Sectiors)" (PDF). EIA. January 29, 2024. Retrieved February 3, 2024.
- ^ "ACP Clean Power Quarterly Report Q3 2021" (PDF). cleanpower.org. American Clean Power Association. Archived from the original (PDF) on November 29, 2021. Retrieved November 29, 2021.
- ^ "U.S. Installed and Potential Wind Power Capacity and Generation". WINDExchange. United States Department of Energy. Retrieved November 29, 2021.
- ^ Editorial Board (April 26, 2014). "The Koch Attack on Solar Energy". New York Times.
- ^ "National Solar Jobs Census". The Solar Foundation.
- ^ a b c "SEGS I, II, III, IV, V, VI, VII, VIII & IX". fplenergy.com. Archived from the original on August 5, 2014.
- ^ "President Obama Touts Clean Energy on Earth Day". Archived from the original on April 29, 2009.
- ^ Ron Pernick and Clint Wilder (2012). "Clean Tech Nation" (PDF). p. 5.
- ^ "Total Energy". US Energy Information Administration.
- ^ a b – via Wikisource.
- ^ 43 U.S.C. § 3004
- ^ Grandoni, Dino (May 9, 2023). "Biden's energy goals run up against painful WWII legacy". The Washington Post. pp. A3.
- ^ American Council On Renewable Energy, (2007). The Outlook on Renewable Energy in America volume II: Joint Summary Report[permanent dead link] page 7
- ^ a b President Obama Calls for Greater Use of Renewable Energy Archived August 27, 2012, at the Wayback Machine
- National Archives.
- ^ Synapse Energy Economics (November 16, 2011). "Toward a Sustainable Future for the U.S. Power Sector: Beyond Business as Usual 2011" (PDF). Archived from the original (PDF) on July 17, 2016. Retrieved December 4, 2011.
- ISSN 0362-4331. Retrieved May 31, 2020.
- ^ a b "Short-Term Energy Outlook - U.S. Energy Information Administration (EIA)". www.eia.gov.
- ^ Gearino, Dan (March 10, 2022). "Inside Clean Energy: Three Charts to Help Make Sense of 2021, a Year Coal Was Up and Solar Was Way Up". Inside Climate News. Archived from the original on March 13, 2022. Credited data source: Energy Information Administration.
- ^ "Chapter 1 / Clean Power at a Glance / Annual Installations (from 2022 Annual Market Report)". CleanPower.org. American Clean Power. May 2023. Archived from the original on May 24, 2023. — From page 10 of the Clean Power Annual Market Report 2022 (archive)
- ^ Rivera, Alfredo; King, Ben; Larsen, John; Larsen, Kate (January 10, 2023). "Preliminary US Greenhouse Gas Emissions Estimates for 2022". Rhodium Group. Archived from the original on January 10, 2023. Figure 4. (Archive including images) Also presented in The New York Times.
- ^ Gearino, Dan (March 9, 2023). "One State Generates Much, Much More Renewable Energy Than Any Other, and It's Not California / Here's a state-by-state tally of the leaders and laggards for wind, solar and other renewable energy in 2022". Inside Climate News. Archived from the original on March 9, 2023. (archive of chart) Gearino cites IEA as data source, crediting Paul Horn for a related bar chart. ● Population data from "Table 2: Resident Population for the 50 States, the District of Columbia, and Puerto Rico: 2020 Census" (PDF). Census.gov. United States Census Bureau. 2021. Archived (PDF) from the original on March 6, 2023.
- ^ "Renewable energy explained". eia.gov. U.S. Energy Information Administration. April 2022. Archived from the original on March 13, 2023.
Data source: U.S. Energy Information Administration, Monthly Energy Review, Appendix D.1, and Tables 1.3 an 10.1, April 2022, preliminary data for 2021. / Wood includes wood and wood waste; Renewables includes biofuels, geothermal, solar and wind.
- ^ "Electric Power Monthly" (PDF). US Energy Information Administration.
- ^ "Renewables Portfolio Standard Quarterly Report 1st and 2nd Quarter 2012" (PDF). California Public Utilities Commission. Archived from the original (PDF) on February 3, 2013. Retrieved March 26, 2013.
- ^ a b c "Renewables Becoming Cost-Competitive With Fossil Fuels in the U.S." Worldwatch Institute. Archived from the original on August 6, 2012. Retrieved August 4, 2012.
- ^ "Texas City Leads The Way On Renewable Energy". NPR.org.
- ^ "Planned Generating Capacities". US Energy Information Administration. Retrieved June 17, 2020.
- ^ "Wind has overtaken the top position for renewable generation in the U.S., EIA says". February 27, 2020. Archived from the original on May 26, 2022. Retrieved April 7, 2021.
- ^ "Generation Records Fall at Grand Coulee Dam". U.S. Bureau of Reclamation. Archived from the original on October 7, 2006. Retrieved November 18, 2006.
- ^ a b c American Wind Energy Association (2009). Annual Wind Industry Report, Year Ending 2008 Archived 2009-04-20 at the Wayback Machine pp. 9–10.
- ^ "Electric Power Monthly - U.S. Energyy Information Administration".
- ^ DOE charts show why climate doom and gloom isn't needed 3.10.2016 Guardian
- ^ "Alta Wind Energy Center (AWEC), California)". October 2020.
- ^ a b "Strengthening America's Energy Security with Offshore Wind" (PDF). U.S. Department of Energy. April 2012.
- ^ "Direct Federal Financial Interventions and Subsidies in Energy in Fiscal Year 2013". Energy Information Administration. Retrieved November 10, 2015.
- ^ "Industry Statistics". Archived from the original on July 27, 2012.
- ^ "Farm Progress - Effective solutions & advertising for US agriculture marketers". Farm Progress Agricultural Marketing. Archived from the original on August 2, 2012. Retrieved July 30, 2012.
- ^ "24 governors ask President to focus on wind energy deployment". Renewable Energy World. August 25, 2011.
- ^ Alvarez, Alayna; Fitzpatrick, Alex; Beheraj, Kavya (April 8, 2024). "Colorado's solar and wind production blows away 2014 records". www.axios.com. Retrieved April 10, 2024.
- ^ Terra-Gen Press Release Archived 2015-09-02 at the Wayback Machine, 17 April 2012
- ^ a b c d "Drilling Down: What Projects Made 2008 Such a Banner Year for Wind Power?". Archived from the original on July 15, 2011. Retrieved March 7, 2013.
- ^ a b c "AWEA: U.S. Wind Energy Projects – Texas". Archived from the original on December 29, 2007.
- ^ a b "AWEA: U.S. Wind Energy Projects – Indiana". Archived from the original on September 18, 2010.
- ^ "News Archives". May 30, 2023. Archived from the original on March 12, 2023. Retrieved March 15, 2023.
- ^ a b "Electric Power Annual". US Energy Information Administration. Retrieved November 4, 2022.
- ^ "Solar Star, Largest PV Power Plant in the World, Now Operational". GreenTechMedia.com. June 24, 2015.
- ^ "The Solar Star Projects". September 20, 2016. Archived from the original on November 5, 2015. Retrieved December 10, 2015.
- ^ "Solar Star I & II Solar". www.mortenson.com.
- ^ "DOE Closes on Four Major Solar Projects". Renewable Energy World. September 30, 2011. Archived from the original on November 11, 2011. Retrieved November 13, 2011.
- ^ Steve Leone (December 7, 2011). "Billionaire Buffett Bets on Solar Energy". Renewable Energy World.
- ^ Million Solar Roofs Initiative Archived April 2, 2012, at the Wayback Machine
- ^ "Washington State Passes Progressive Renewable Energy Legislation". Archived from the original on February 13, 2007. Retrieved December 16, 2007.
- ^ US Bureau of Land Management, Solar Energy Program, 29 Nov. 2014.
- ^ "Solar Energy Zones". solareis.anl.gov/sez. Solar Energy Development PEIS Information Center. Retrieved August 24, 2016.
- ^ "Solar PEIS Maps". solareis.anl.gov.
- ^ "Spain pioneers grid-connected solar-tower thermal power" (PDF). Archived from the original (PDF) on September 27, 2007.
- ^ NREL report firms up land-use requirements for solar Archived 2015-09-07 at the Wayback Machine, National Renewable Energy Laboratory, 30 July 2013.
- ^ A Mojave power failure A shortfall in Mojave protection bill, Los Angeles Times, editorial, December 26, 2009.
- ^ "Nevada: Solar energy advances discussed". Archived from the original on May 23, 2011.
- Washington Post, February 23, 2010.
- ^ Michael R. Blood and Brian Skolof, "Huge thermal plant opens as solar industry grows" Archived February 22, 2014, at the Wayback Machine, Associated Press, February 13, 2014.
- ^ "DOE Finalizes $737 Million Loan Guarantee to Tonopah Solar Energy for Nevada Project" (Press release). Loan Programs Office (LPO), Dept. of Energy (DOE). September 28, 2011. Archived from the original on October 15, 2011. Retrieved September 29, 2011.
- ^ a b c Geothermal Energy Association, 6 Million American Households to be Powered by Geothermal Energy, New Survey Reports Archived 2007-05-27 at the Wayback Machine
- ^ <"Electric Power Monthly"[1] retrieved 2020-6-14
- ^ a b c Environmental and Energy Study Institute, Solar water heating
- ^ "Alternative Fuels Data Center: Ethanol Fuel Basics". afdc.energy.gov.
- ^ a b c Worldwatch Institute and Center for American Progress (2006). American energy: The renewable path to energy security
- ^ Ethanol Opportunities and Challenges: A State-by-State Look at Higher Blends [2]
- ^ "USDA Blender Pump Grants Aimed at Increasing Availability of Mid-Level Blends | Article | EESI". www.eesi.org.
- ^ "Direct Federal Financial Interventions and Subsidies in Energy in Fiscal Year 2010". Energy Information Administration. Retrieved April 29, 2012.
- ^ S.C.E. Jupe; A. Michiorri; P.C. Taylor (2007). "Increasing the energy yield of generation from new and renewable energy sources". Renewable Energy. 14 (2): 37–62.
- ^ "Defense-scale supercomputing comes to renewable energy research". Sandia National Laboratories. Retrieved April 16, 2012.
- ^ "Sandia National Laboratories" (PDF). Sandia National Laboratories. Archived from the original (PDF) on October 20, 2011. Retrieved April 16, 2012.
- ^ *Chakrabarty, Gargi, April 16th, 2009. "Stimulus leaves NREL in cold" Denver Post"
- ^ a b Chumley, Cheryl. "BP Gives Up on Solar Power". Heartlander Magazine. Retrieved November 28, 2012.
- ^ "Stimulus leaves NREL in cold". Denver Post. April 15, 2009. Retrieved April 16, 2012.
- ^ "Solar Research". NREL. Retrieved April 16, 2012.
- ^ "Photovoltaics". Sandia. Archived from the original on November 1, 2014. Retrieved April 16, 2012.
- ^ "'Major discovery' from MIT primed to unleash solar revolution". MIT News. Archived from the original on March 28, 2014. Retrieved April 17, 2012.
- ^ "Breakthrough: World's most efficient solar panel". SmartPlanet. Retrieved April 17, 2012.
- ^ "Wind energy research reaps rewards". NASA. Retrieved April 17, 2012.
- ^ "Wind energy". Sandia. Retrieved April 17, 2012.
- ^ "Wind research". NREL. Retrieved April 17, 2012.
- ^ "Wind resource evaluation at the Caltech Field Laboratory for Optimized Wind Energy (FLOWE)" (PDF). Caltech. Archived from the original (PDF) on December 16, 2011. Retrieved April 17, 2012.
- ^ American Coalition for Ethanol (June 2, 2008). "Responses to Questions from Senator Bingaman" (PDF). American Coalition for Ethanol. Archived from the original (PDF) on October 4, 2011. Retrieved April 2, 2012.
- ^ National Renewable Energy Laboratory (March 2, 2007). "Research Advantages: Cellulosic Ethanol" (PDF). National Renewable Energy Laboratory. Archived from the original (PDF) on January 25, 2012. Retrieved April 2, 2012.
- PMID 18180449.
- PMID 17320227.
- ^ Sandia National Laboratories. "Biomass". Sandia National Laboratories. Archived from the original on May 10, 2012. Retrieved April 17, 2012.
- ^ Joint BioEnergy Initiative. "About JBEI". Sandia National Laboratories. Archived from the original on May 25, 2012. Retrieved April 17, 2012.
- ^ Jeff Wise (November 2006). "The Truth about hydrogen". Popular Mechanics. Retrieved April 17, 2012.
- ^ NREL. "Hydrogen". NREL. Retrieved April 17, 2012.
- ^ Sandia. "Hydrogen". Sandia. Retrieved April 17, 2012.
- ^ "The Potential for Geologic Hydrogen for Next-Generation Energy | U.S. Geological Survey".
- ^ Alderman, Liz (December 4, 2023). "It Could be a Vast Source of Clean Energy, Buried Deep Underground". The New York Times.
- ISSN 0301-4215.
- ^ ISSN 0306-2619.
- ^ ISSN 0301-4215.
- ^ "2019 Report". 2020 U.S. Energy and Employment Report (USEER). Retrieved March 1, 2021.
- ^ "U.S. energy facts explained - consumption and production - U.S. Energy Information Administration (EIA)". www.eia.gov. Retrieved March 1, 2021.
- ^ Chiu, Allyson; Guskin, Emily; Clement, Scott (October 3, 2023). "Americans don't hate living near solar and wind farms as much as you might think". The Washington Post. Archived from the original on October 3, 2023.
- ^ De Pinto, Jennifer; Backus, Fred (September 15, 2019). "Younger Americans views' on climate change: More serious, yet more optimistic". CBS News. Retrieved September 15, 2019.
- ^ "Net Metering". Archived from the original on May 21, 2009.
- ^ "Working Paper Abstract 257 – Energy Institute at Haas - University of California Berkeley, Haas School of Business". ei.haas.berkeley.edu. Retrieved August 29, 2015.
- ^ Clean Edge (2009). Clean Energy Trends 2009 Archived 2009-03-18 at the Wayback Machine pp. 1-4.
- ^ Mulkern, Anne C. (September 6, 2011). "Solyndra Bankruptcy Reveals Dark Clouds in Solar Power Industry". The New York Times. Retrieved September 3, 2015.
- ^ Casey, Tina (October 25, 2013). "$60 Million More For Low Cost Solar Power". Clean Technica. Sustainable Enterprises Media, Inc. Retrieved September 3, 2015.
- ^ "California: SunShot-Supported Technology Maximizes Taxpayer's Investment". U.S. Department of Energy. January 24, 2014. Retrieved September 3, 2015.
- ^ U.S. Environmental Protection Agency, Onsite Renewable Technologies
- ^
 This article incorporates public domain material from Direct Federal Financial Interventions and Subsidies in Energy in Fiscal Year 2016. United States Department of Energy.
- ^ John Broder (October 10, 2011). "The Year of Peril and Promise in Energy Production". New York Times.
- ^ "U.S. Rejected Solyndra Restructuring Before Shutdown, Memo Says". Bloomberg.com. September 12, 2011 – via www.bloomberg.com.
- ^ "Current Experience With Net Metering Programs (1998)" (PDF). Archived from the original (PDF) on May 21, 2013. Retrieved December 15, 2013.
- ^ "Minnesota". Dsireusa.org. Archived from the original on October 19, 2012. Retrieved December 15, 2013.
- ^ "Net Metering" (PDF). ncsolarcen-prod.s3.amazonaws.com. North Carolina Clean Energy Technology Center. March 1, 2015. Retrieved May 30, 2015.
- .
- ^ "Public Utility Regulatory Policies Act of 1978 (PURPA)". U.S. Department of Energy. Retrieved May 30, 2015.
- ^ "Database of State Incentives for Renewables & Efficiency". North Carolina Clean Energy Technology Center. Retrieved May 31, 2015.
- ^ DOE's SunShot Program Aims to Reach Competitive Solar By 2020. Fast Company, Feb. 4, 2011.
- ^ "SunShot Initiative About page, Accessed Jan. 20, 2012". .eere.energy.gov. November 16, 2011. Retrieved March 30, 2012.
- ^ "Sunshot Catalyst Challenge Series on Topcoder". Retrieved May 2, 2017.
- ^ "SunShot $1 per Watt Solar Cost Goal: Mission Accomplished, Years Ahead of Schedule". January 25, 2017. Retrieved January 30, 2017.
- ^ EERE: Solar Energy Technologies Program Home Page[ Archived December 19, 2011, at the Wayback Machine
- ^ a b California Public Utilities Commission, The California Solar Initiative Archived 2013-03-07 at the Wayback Machine
- ^ Database of State Incentives for Renewables and Efficiency, Financial Incentives in the USA Archived 2008-01-09 at the Wayback Machine
- ^ "Los Angeles County Sanitation Districts | Home". www.lacsd.org.
- ^ "Across America, clean energy plants are being banned faster than they're being built". USA TODAY. Retrieved February 7, 2024.
- ^ American Council on Renewable Energy, Member Benefits Archived 2010-12-04 at the Wayback Machine
- ^ American Council On Renewable Energy, (2007). The Outlook On Renewable Energy In America Archived 2007-05-13 at the Wayback Machine
- ^ 635 GW Possible with U.S. Political Shift Archived 2007-09-26 at the Wayback Machine Renewable Energy Access, 2 May 2007.
- .
- ^ S2CID 154810770.
- S2CID 245728415.
- S2CID 149604257.
- ISSN 2214-6296.
- ^ Annual Energy Outlook 2012 [failed verification] Archived 2013-02-24 at the Wayback Machine
- ^ "U.S. Renewable Energy Technical Potentials" (PDF). National Renewable Energy Laboratory. Retrieved December 1, 2016.
- ^ "NREL Study Shows Renewable Energy Potential in Every State". www.nrel.gov. Archived from the original on August 1, 2012.
- ^ "Electricity Consumption". Energy Information Agency. Retrieved December 28, 2016.
- ^ "Total Energy Consumption 2010". Energy Information Agency. Retrieved December 28, 2016.
Further reading
- GA Mansoori, N Enayati, LB Agyarko (2016), Energy: Sources, Utilization, Legislation, Sustainability, Illinois as Model State, World Sci. Pub. Co., ISBN 978-981-4704-00-7
- Clean Tech Nation: How the U.S. Can Lead in the New Global Economy (2012) by Ron Pernick and Clint Wilder
- Deploying Renewables 2011 (2011) by the International Energy Agency
- Reinventing Fire: Bold Business Solutions for the New Energy Era (2011) by Amory Lovins
- Renewable Energy and Energy Efficiency Incentives: A Summary of Federal Programs (December 14, 2016) by the Congressional Research Service
- IPCC
- Solar Energy Perspectives (2011) by the International Energy Agency
External links
| Africa |
| ||||
|---|---|---|---|---|---|
| Asia |
| ||||
| Europe |
| ||||
| North America | |||||
| Oceania | |||||
| South America | |||||