
Retreat of glaciers since 1850


The retreat of glaciers since 1850 is well documented and is one of the
Mid-latitude mountain ranges such as the Himalayas, Rockies, Alps, Cascades, Southern Alps, and the southern Andes, as well as isolated tropical summits such as Mount Kilimanjaro in Africa, are showing some of the largest proportionate glacial losses.
The retreat of glaciers has impacts on the availability of fresh water for irrigation and domestic use, mountain recreation, animals and plants that depend on glacier-melt, and, in the longer term, the sea level. For example, in the Andes and Himalayas, the demise of glaciers has the potential to affect water supplies.[2]
Scale at the global level

Excluding peripheral glaciers of ice sheets, the total cumulated global glacial losses over the 26-year period from 1993 to 2018 were likely 5500 gigatons, or 210 gigatons per yr.[1]: 1275
Timeline
The Little Ice Age was a period from about 1550 to 1850 when certain regions experienced relatively cooler temperatures compared to the time before and after. Subsequently, until about 1940, glaciers around the world retreated as the climate warmed substantially. Glacial retreat slowed and even reversed temporarily, in many cases, between 1950 and 1980 as global temperatures cooled slightly.[4]
Since 1980, climate change has led to glacier retreat becoming increasingly rapid and ubiquitous, so much so that some glaciers have disappeared altogether, and the existence of many of the remaining glaciers is threatened.[5]
Causes


The mass balance, or difference between
Glacier retreat results in the loss of the low-elevation region of the glacier. Since higher elevations are cooler, the disappearance of the lowest portion decreases overall ablation, thereby increasing mass balance and potentially reestablishing equilibrium. If the mass balance of a significant portion of the accumulation zone of the glacier is negative, it is in disequilibrium with the climate and will melt away without a colder climate and/or an increase in frozen precipitation.[10][11]
For example, Easton Glacier in Washington state, U.S. will likely shrink to half its size but at a slowing rate of reduction and stabilize at that size despite the warmer temperature over a few decades. However, the Grinnell Glacier in Montana, U.S. will shrink at an increasing rate until it disappears. The difference is that the upper section of Easton Glacier remains healthy and snow-covered, while even the upper section of the Grinnell Glacier is bare, is melting and has thinned. Small glaciers with minimal altitude range are most likely to fall into disequilibrium with the climate.[11]
Measurement techniques
Methods for measuring retreat include staking
Impacts
Water supply
The continued retreat of glaciers will have a number of different quantitative effects. In areas that are heavily dependent on water runoff from glaciers that melt during the warmer summer months, a continuation of the current retreat will eventually deplete the glacial ice and substantially reduce or eliminate runoff. A reduction in runoff will affect the ability to
Ecosystems
Many species of freshwater and saltwater plants and animals are dependent on glacier-fed waters to ensure the cold water habitat to which they have adapted. Some species of freshwater fish need cold water to survive and to reproduce, and this is especially true with

Glacial lake outburst floods
One major concern is the increased risk of
Sea level rise
The potential for major sea level rise depends mostly on a significant melting of the polar ice caps of Greenland and Antarctica, as this is where the vast majority of glacial ice is located. If all the ice on the polar ice caps were to melt away, the oceans of the world would rise an estimated 70 m (230 ft).[19] Although previously it was thought that the polar ice caps were not contributing heavily to sea level rise (IPCC 2007), recent studies have confirmed that both Antarctica and Greenland are contributing 0.5 millimetres (0.020 in) a year each to global sea level rise.[20][21][22] The Thwaites Glacier alone, in Western Antarctica is "currently responsible for approximately 4 percent of global sea level rise. It holds enough ice to raise the world ocean a little over 2 feet (65 centimeters) and backstops neighboring glaciers that would raise sea levels an additional 8 feet (2.4 meters) if all the ice were lost."[23][24] The fact that the IPCC estimates did not include rapid ice sheet decay into their sea level predictions makes it difficult to ascertain a plausible estimate for sea level rise but a 2008 study found that the minimum sea level rise will be around 0.8 metres (2.6 ft) by 2100.[25]
Middle latitude
Northern hemisphere – Eurasia
Europe
All the glaciers in the French alps are retreating. On Mont Blanc, the highest peak in the Alps, the Argentière Glacier has receded 1,150 m (3,770 ft) since 1870.[28] Other Mont Blanc glaciers have also been in retreat, including the Mer de Glace, which is the largest glacier in France at 12 km (7.5 mi) in length but retreated 500 m (1,600 ft) between 1994 and 2008.[29][30] The glacier has retreated 2,300 m (7,500 ft) since the end of the Little Ice Age.[30] The Argentière and Mer de Glace glaciers are expected to disappear completely by end of the 21st century if current climate trends persist.[31] The Bossons Glacier once extended from the summit of Mont Blanc at 4,807 m (15,771 ft) to an elevation of 1,050 m (3,440 ft) in 1900. By 2008 Bossons Glacier had retreated to a point that was 1,400 m (4,600 ft) above sea level.[32]
Other researchers have found that glaciers across the Alps appear to be retreating at a faster rate than a few decades ago. In a paper published in 2009 by the University of Zurich, the Swiss glacier survey of 89 glaciers found 76 retreating, 5 stationary and 8 advancing from where they had been in 1973.[33] The Trift Glacier had the greatest recorded retreat, losing 350 m (1,150 ft) of its length between the years 2003 and 2005.[33] The Grosser Aletsch Glacier is the largest glacier in Switzerland and has been studied since the late 19th century. Aletsch Glacier retreated 2.8 km (1.7 mi) from 1880 to 2009.[34] This rate of retreat has also increased since 1980, with 30%, or 800 m (2,600 ft), of the total retreat occurring in the last 20% of the time period.[34]
The Morteratsch Glacier in Switzerland has had one of the longest periods of scientific study with yearly measurements of the glacier's length commencing in 1878. The overall retreat from 1878 to 1998 has been 2 km (1.2 mi) with a mean annual retreat rate of approximately 17 m (56 ft) per year. This long-term average was markedly surpassed in recent years with the glacier receding 30 m (98 ft) per year during the period between 1999 and 2005. Similarly, of the glaciers in the Italian Alps, only about a third were in retreat in 1980, while by 1999, 89% of these glaciers were retreating. In 2005, the Italian Glacier Commission found that 123 glaciers in Lombardy were retreating.[35] A random study of the Sforzellina Glacier in the Italian Alps indicated that the rate of retreat from 2002 to 2006 was much higher than in the preceding 35 years.[36] To study glaciers located in the alpine regions of Lombardy, researchers compared a series of aerial and ground images taken from the 1950s through the early 21st century and deduced that between the years 1954–2003 the mostly smaller glaciers found there lost more than half of their area.[37] Repeat photography of glaciers in the Alps indicates that there has been significant retreat since studies commenced.[38]
Research, published in 2019 by ETH Zurich, says that two-thirds of the ice in the glaciers of the Alps is doomed to melt by the end of the century due to climate change.[39][40] In the most pessimistic scenario, the Alps will be almost completely ice-free by 2100, with only isolated ice patches remaining at high elevation.[41]

Though the glaciers of the Alps have received more attention from glaciologists than in other areas of Europe, research indicates that glaciers in northern Europe are also retreating. Since the end of World War II, Storglaciären in Sweden has undergone the longest continuous mass balance study in the world conducted from the Tarfala research station. In the Kebnekaise Mountains of northern Sweden, a study of 16 glaciers between 1990 and 2001 found that 14 glaciers were retreating, one was advancing and one was stable.[42] In Norway, glacier studies have been performed since the early 19th century, with systematic surveys undertaken regularly since the 1990s. Inland glaciers have had a generally negative mass balance, whereas during the 1990s, maritime glaciers showed a positive mass balance and advanced.[43] The maritime advances have been attributed to heavy snowfall in the period 1989–1995.[43] However, reduced snowfall since has caused most Norwegian glaciers to retreat significantly.[43] A survey of 31 Norwegian glaciers in 2010 indicated that 27 were in retreat, one had no change and three advanced.[44] Similarly, in 2013, of 33 Norwegian glaciers surveyed, 26 were retreating, four showed no change and three advanced.[44]
Engabreen Glacier in Norway, an outlet glacier of the

In the Spanish Pyrenees, recent studies have shown important losses in extent and volume of the glaciers of the Maladeta massif during the period 1981–2005. These include a reduction in area of 35.7%, from 2.41 km2 (600 acres) to 1.55 km2 (380 acres), a loss in total ice volume of 0.0137 km3 (0.0033 cu mi) and an increase in the mean altitude of the glacial termini of 43.5 m (143 ft).[49] For the Pyrenees as a whole 50–60% of the glaciated area has been lost since 1991. The Balaitus, Perdigurero and La Munia glaciers have disappeared in this period. Monte Perdido Glacier has shrunk from 90 hectares to 40 hectares.[50]
As initial cause for glacier retreat in the alps since 1850, a decrease of the glaciers' albedo, caused by industrial black carbon can be identified. According to a report, this may have accelerated the retreat of glaciers in Europe which otherwise might have continued to expand until approximately the year 1910.[51]
West Asia
All the glaciers in Turkey are in retreat and glaciers have been developing proglacial lakes at their terminal ends as the glaciers thin and retreat.[52][53] Between the 1970s and 2013, the glaciers in Turkey lost half their area, going from 25 km2 (9.7 sq mi) in the 1970s to 10.85 km2 (4.19 sq mi) in 2013. Of the 14 glaciers studied, five had disappeared altogether.[54] Mount Ararat has the largest glacier in Turkey, and that is forecast to be completely gone by 2065.[55]
Siberia and the Russian Far East
In the more maritime and generally wetter
Details on the retreat of Siberian and Russian Far East glaciers have been less adequate than in most other glaciated areas of the world. There are several reasons for this, the principal one being that since the collapse of Communism there has been a large reduction in the number of monitoring stations.[60] Another factor is that in the Verkhoyansk and Cherskiy Ranges it was thought glaciers were absent before they were discovered during the 1940s, whilst in ultra-remote Kamchatka and Chukotka, although the existence of glaciers was known earlier, monitoring of their size dates back no earlier than the end of World War II.[58] Nonetheless, available records do indicate a general retreat of all glaciers in the Altai Mountains with the exception of volcanic glaciers in Kamchatka. Sakha's glaciers, totaling seventy square kilometers, have shrunk by around 28 percent since 1945 reaching several percent annually in some places, whilst in the Altai and Chukotkan mountains and non-volcanic areas of Kamchatka, the shrinkage is considerably larger.[60]
Himalayas and Central Asia
The Himalayas and other mountain chains of central Asia support large glaciated regions. An estimated 15,000 glaciers can be found in the greater Himalayas, with double that number in the Hindu Kush and Karakoram and Tien Shan ranges, and comprise the largest glaciated region outside the poles.[61] These glaciers provide critical water supplies to arid countries such as Mongolia, western China, Pakistan, Afghanistan and India. As with glaciers worldwide, those of the greater Himalayan region are experiencing a decline in mass, and researchers claim that between the early 1970s and early 2000s, there had been a 9 percent reduction in ice mass,[62] while there has been a significant increase in mass loss since the Little Ice Age with a 10-fold increase when compared to rates seen currently.[63] Change in temperature has led to melting and the formation and expansion of glacial lakes which could cause an increase in the number of glacial lake outburst floods (GLOFs). If the present trends persist the ice mass will gradually be reduced, and will affect the availability of water resources, though water loss is not expected to cause problems for many decades.[64]
In the Wakhan Corridor of Afghanistan 28 of 30 glaciers examined retreated significantly between 1976 and 2003, with an average retreat of 11 m (36 ft) per year.[65] One of these glaciers, the Zemestan Glacier, retreated 460 m (1,510 ft) during this period, not quite 10% of its 5.2 km (3.2 mi) length.[66] In examining 612 glaciers in China between 1950 and 1970, 53% of the glaciers studied were retreating. After 1990, 95% of these glaciers were measured to be retreating, indicating that retreat of these glaciers was becoming more widespread.[67] Glaciers in the Mount Everest region of the Himalayas are all in a state of retreat. The Rongbuk Glacier, draining the north side of Mount Everest into Tibet, has been retreating 20 m (66 ft) per year. In the Khumbu region of Nepal along the front of the main Himalaya of 15 glaciers examined from 1976 to 2007 all retreated significantly and the average retreat was 28 m (92 ft) per year.[68] The most famous of these, the Khumbu Glacier, retreated at a rate of 18 m (59 ft) per year from 1976 to 2007.[68] In India, the Gangotri Glacier retreated 1,147 m (3,763 ft) between the years 1936 and 1996 with 850 m (2,790 ft) of that retreat occurring in the last 25 years of the 20th century.[69][70] However, the glacier is still over 30 km (19 mi) long.[70] In Sikkim, 26 glaciers examined between the years 1976 and 2005 were retreating at an average rate of 13.02 m (42.7 ft) per year.[71]
Overall, glaciers in the Greater Himalayan region that have been studied are retreating an average of between 18 and 20 m (59 and 66 ft) annually.

With the retreat of glaciers in the Himalayas, a number of glacial lakes have been created. A growing concern is the potential for
Glaciers in the
The
Northern hemisphere – North America

North American glaciers are primarily located along the spine of the Rocky Mountains in the United States and Canada, and the Pacific Coast Ranges extending from northern
Cascade Range
The


As recently as 1975 many North Cascade glaciers were advancing due to cooler weather and increased precipitation that occurred from 1944 to 1976. By 1987 the North Cascade glaciers were retreating and the pace had increased each decade since the mid-1970s. Between 1984 and 2005 the North Cascade glaciers lost an average of more than 12.5 metres (41 ft) in thickness and 20–40 percent of their volume.[11]
Glaciologists researching the North Cascades found that all 47 monitored glaciers are receding while four glaciers—Spider Glacier, Lewis Glacier, Milk Lake Glacier and Mt. David Glacier—are almost completely gone. The White Chuck Glacier (near Glacier Peak) is a particularly dramatic example. The glacier area shrank from 3.1 km2 (1.2 sq mi) in 1958 to 0.9 km2 (0.35 sq mi) by 2002. Between 1850 and 1950, the Boulder Glacier on the southeast flank of Mount Baker retreated 8,700 feet (2,700 m). William Long of the United States Forest Service observed the glacier beginning to advance due to cooler/wetter weather in 1953. This was followed by a 743 metres (2,438 ft) advance by 1979.[84] The glacier again retreated 450 m (1,480 ft) from 1987 to 2005, leaving barren terrain behind. This retreat has occurred during a period of reduced winter snowfall and higher summer temperatures. In this region of the Cascades, winter snowpack has declined 25% since 1946, and summer temperatures have risen 0.7 °C (1.2 °F) during the same period. The reduced snowpack has occurred despite a small increase in winter precipitation—thus, it reflects warmer winter temperatures leading to rainfall and melting on glaciers even during the winter. As of 2005, 67% of the North Cascade glaciers observed are in disequilibrium and will not survive the continuation of the present climate. These glaciers will eventually disappear unless temperatures fall and frozen precipitation increases. The remaining glaciers are expected to stabilize, unless the climate continues to warm, but will be much reduced in size.[85]
U.S. Rocky Mountains
On the sheltered slopes of the highest peaks of
-
 1938T.J. HilemanGNP
 -
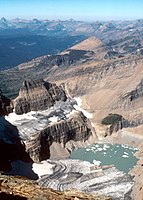 1981 Carl Key (USGS)
 -
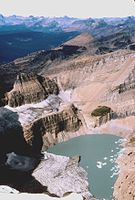 1998 Dan Fagre (USGS)
 -
 2009 Lindsey Bengtson (USGS)


The semiarid climate of
Canadian Rockies and Coast and Columbia Mountains

In the Canadian Rockies, glaciers are generally larger and more widespread than to the south in the Rocky Mountains. One of the more accessible in the Canadian Rockies is the Athabasca Glacier, which is an outlet glacier of the 325 km2 (125 sq mi) Columbia Icefield. The Athabasca Glacier has retreated 1,500 m (4,900 ft) since the late 19th century. Its rate of retreat has increased since 1980, following a period of slow retreat from 1950 to 1980. The Peyto Glacier in Alberta covers an area of about 12 km2 (4.6 sq mi), and retreated rapidly during the first half of the 20th century, stabilized by 1966, and resumed shrinking in 1976.[91] The Illecillewaet Glacier in British Columbia's Glacier National Park (Canada), part of the Selkirk Mountains (west of the Rockies) has retreated 2 km (1.2 mi) since first photographed in 1887.
In Garibaldi Provincial Park in Southwestern British Columbia over 505 km2 (195 sq mi), or 26%, of the park, was covered by glacier ice at the beginning of the 18th century. Ice cover decreased to 297 km2 (115 sq mi) by 1987–1988 and to 245 km2 (95 sq mi) by 2005, 50% of the 1850 area. The 50 km2 (19 sq mi) loss in the last 20 years coincides with negative mass balance in the region. During this period all nine glaciers examined have retreated significantly.[92]
Alaska

There are thousands of glaciers in Alaska but only few have been named. The Columbia Glacier near Valdez in Prince William Sound retreated 15 km (9.3 mi) in the 25 years from 1980 to 2005. Its calved icebergs partially caused the Exxon Valdez oil spill, when the tanker changed course to avoid the ice tips. The Valdez Glacier is in the same area, and though it does not calve, has also retreated significantly. "A 2005 aerial survey of Alaskan coastal glaciers identified more than a dozen glaciers, many former tidewater and calving glaciers, including Grand Plateau, Alsek, Bear, and Excelsior Glaciers that are rapidly retreating. Of 2,000 glaciers observed, 99% are retreating."[18] Icy Bay in Alaska is fed by three large glaciers—Guyot, Yahtse, and Tyndall Glaciers—all of which have experienced a loss in length and thickness and, consequently, a loss in area. Tyndall Glacier became separated from the retreating Guyot Glacier in the 1960s and has retreated 24 km (15 mi) since, averaging more than 500 m (1,600 ft) per year.[93]
The Juneau Icefield Research Program has monitored outlet glaciers of the Juneau Icefield since 1946. On the west side of the ice field, the terminus of the Mendenhall Glacier, which flows into suburban Juneau, Alaska, has retreated 580 m (1,900 ft). Of the nineteen glaciers of the Juneau Icefield, eighteen are retreating, and one, the Taku Glacier, is advancing. Eleven of the glaciers have retreated more than 1 km (0.62 mi) since 1948 – Antler Glacier, 5.4 km (3.4 mi); Gilkey Glacier, 3.5 km (2.2 mi); Norris Glacier, 1.1 km (0.68 mi) and Lemon Creek Glacier, 1.5 km (0.93 mi).[94] Taku Glacier has been advancing since at least 1890, when naturalist John Muir observed a large iceberg calving front. By 1948 the adjacent fjord had filled in, and the glacier no longer calved and was able to continue its advance. By 2005 the glacier was only 1.5 km (0.93 mi) from reaching Taku Point and blocking Taku Inlet. The advance of Taku Glacier averaged 17 m (56 ft) per year between 1988 and 2005. The mass balance was very positive for the 1946–88 period fueling the advance; however, since 1988 the mass balance has been slightly negative, which should in the future slow the advance of this mighty glacier.[95]

Long-term mass balance records from
Southern hemisphere
Andes and Tierra del Fuego

A large region of population surrounding the central and southern Andes of
Oceania

In New Zealand, mountain glaciers have been in general retreat since 1890, with an acceleration since 1920. Most have measurably thinned and reduced in size, and the snow accumulation zones have risen in elevation as the 20th century progressed. Between 1971 and 1975 Ivory Glacier receded 30 m (98 ft) from the glacial terminus, and about 26% of its surface area was lost. Since 1980 numerous small glacial lakes formed behind the new terminal moraines of several of these glaciers. Glaciers such as Classen, Godley and Douglas now all have new glacial lakes below their terminal locations due to the glacial retreat over the past 20 years. Satellite imagery indicates that these lakes are continuing to expand. There has been significant and ongoing ice volume losses on the largest New Zealand glaciers, including the Tasman, Ivory, Classen, Mueller, Maud, Hooker, Grey, Godley, Ramsay, Murchison, Therma, Volta and Douglas Glaciers. The retreat of these glaciers has been marked by expanding proglacial lakes and terminus region thinning. The loss in Southern Alps total ice volume from 1976 to 2014 is 34 percent of the total.[104]
Several glaciers, notably the much-visited
Polar regions
Despite their proximity and importance to human populations, the mountain and valley glaciers of tropical and mid-latitude glaciers amount to only a small fraction of glacial ice on the Earth. About 99 percent of all freshwater ice is in the great ice sheets of polar and subpolar Antarctica and Greenland. These continuous continental-scale ice sheets, 3 km (1.9 mi) or more in thickness, cap much of the polar and subpolar land masses. Like rivers flowing from an enormous lake, numerous outlet glaciers transport ice from the margins of the ice sheet to the ocean.[106]
Iceland
The northern Atlantic island nation of Iceland is home to Vatnajökull, which is the largest ice cap in Europe. The Breiðamerkurjökull glacier is one of Vatnajökull's outlet glaciers, and receded by as much as 2 km (1.2 mi) between 1973 and 2004. In the early 20th century, Breiðamerkurjökull extended to within 250 m (820 ft) of the ocean, but by 2004 its terminus had retreated 3 km (1.9 mi) further inland. This glacier retreat exposed a rapidly expanding lagoon, Jökulsárlón, which is filled with icebergs calved from its front. Jökulsárlón is 110 m (360 ft) deep and nearly doubled its size between 1994 and 2004. Mass-balance measurements of Iceland's glaciers show alternating positive and negative mass balance of glaciers during the period 1987–1995, but the mass balance has been predominantly negative since. On Hofsjökull ice cap, mass balance has been negative each year from 1995 to 2005.[107]
Most of the Icelandic glaciers retreated rapidly during the warm decades from 1930 to 1960, slowing down as the climate cooled during the following decade, and started to advance after 1970. The rate of advance peaked in the 1980s, after which it slowed down until about 1990. As a consequence of rapid warming of the climate that has taken place since the mid-1980s, most glaciers in Iceland began to retreat after 1990, and by 2000 all monitored non-surge type glaciers in Iceland were retreating. An average of 45 non-surging termini were monitored each year by the Icelandic Glaciological Society from 2000 to 2005.[108]
Canada
The
Other studies show that between 1960 and 1999, the Devon Ice Cap lost 67 km3 (16 cu mi) of ice, mainly through thinning. All major outlet glaciers along the eastern Devon Ice Cap margin have retreated from 1 km (0.62 mi) to 3 km (1.9 mi) since 1960.[113] On the Hazen Plateau of Ellesmere Island, the Simmon Ice Cap has lost 47% of its area since 1959.[114] If the current climatic conditions continue, the remaining glacial ice on the Hazen Plateau will be gone around 2050. On August 13, 2005, the Ayles Ice Shelf broke free from the north coast of Ellesmere Island. The 66 km2 (25 sq mi) ice shelf drifted into the Arctic Ocean.[115] This followed the splitting of the Ward Hunt Ice Shelf in 2002. The Ward Hunt has lost 90% of its area in the last century.[116]
Northern Europe
Arctic islands north of Norway, Finland and Russia have all shown evidence of glacier retreat. In the Svalbard archipelago, the island of Spitsbergen has numerous glaciers. Research indicates that Hansbreen (Hans Glacier) on Spitsbergen retreated 1.4 km (0.87 mi) from 1936 to 1982 and another 400 m (1,300 ft) during the 16-year period from 1982 to 1998.[117] Blomstrandbreen, a glacier in the King's Bay area of Spitsbergen, has retreated approximately 2 km (1.2 mi) in the past 80 years. Since 1960 the average retreat of Blomstrandbreen has been about 35 m (115 ft) a year, and this average was enhanced due to an accelerated rate of retreat since 1995.[118] Similarly, Midre Lovenbreen retreated 200 m (660 ft) between 1977 and 1995.[119] In the Novaya Zemlya archipelago north of Russia, research indicates that in 1952 there was 208 km (129 mi) of glacier ice along the coast. By 1993 this had been reduced by 8% to 198 km (123 mi) of glacier coastline.[120]
Greenland

In
Jakobshavn Isbræ in west Greenland, a major outlet glacier of the Greenland Ice Sheet, was the fastest moving glacier in the world over the past half century. It had been moving continuously at speeds of over 24 m (79 ft) per day with a stable terminus since at least 1950. In 2002 the 12 km (7.5 mi) long floating terminus of the glacier entered a phase of rapid retreat, with the ice front breaking up and the floating terminus disintegrating and accelerating to a retreat rate of over 30 m (98 ft) per day. No longer. The glacier has "slammed the brakes" and is now getting thicker (growing in height) 20 meters each year.[123]
On a shorter timescale, portions of the main trunk of Kangerdlugssuaq Glacier that were flowing at 15 m (49 ft) per day from 1988 to 2001 were measured to be flowing at 40 m (130 ft) per day in the summer of 2005. Not only has Kangerdlugssuaq retreated, it has also thinned by more than 100 m (330 ft).[124]
The rapid thinning, acceleration and retreat of Helheim, Jakobshavns and Kangerdlugssuaq glaciers in Greenland, all in close association with one another, suggests a common triggering mechanism, such as enhanced surface melting due to regional climate warming or a change in forces at the glacier front. The enhanced melting leading to lubrication of the glacier base has been observed to cause a small seasonal velocity increase and the release of meltwater lakes has also led to only small short term accelerations.
According to one study, in the years 2002–2019 Greenland lost 4,550 gigaton of ice, 268 gigaton per year, on average. In 2019 Greenland lost 600 gigaton of ice in two months contributing 2.2 mm to global sea level rise[129]
Antarctica

Antarctica is intensely cold and arid. Most of the world's freshwater ice is contained within its sheets. Its most dramatic example of glacier retreat is the loss of large sections of the Larsen Ice Shelf on the Antarctic Peninsula. The recent collapse of Wordie Ice Shelf, Prince Gustav Ice Shelf, Mueller Ice Shelf, Jones Ice Shelf, Larsen-A and Larsen-B Ice Shelf on the Antarctic Peninsula has raised awareness of how dynamic ice shelf systems are.
The Antarctic sheet is the largest known single mass of ice. It covers almost 14 million km2 and some 30 million km3 of ice. Around 90% of the fresh water on the planet's surface is held in this area and if melted would raise sea levels by 58 metres.[130] The continent-wide average surface temperature trend of Antarctica is positive and significant at >0.05 °C/decade since 1957.[131]
The Antarctic sheet is divided by the
Ice shelves are not stable when surface melting occurs. The situation with some notable ice shelves is explained below:
- The collapse of Larsen Ice Shelf has been caused by warmer melt season temperatures that have led to surface melting and the formation of shallow ponds of water on the ice shelf. The Larsen Ice Shelf lost 2,500 km2 (970 sq mi) of its area from 1995 to 2001. In a 35-day period beginning on January 31, 2002, about 3,250 km2 (1,250 sq mi) of shelf area disintegrated. The ice shelf is now 40% the size of its previous minimum stable extent.[132]
- In 2015 a study concluded that the remaining Larsen B ice-shelf will disintegrate by the end of the decade, based on observations of faster flow and rapid thinning of glaciers in the area.[133] Jones Ice Shelf had an area of 35 km2 (14 sq mi) in the 1970s but by 2008 it had disappeared.[134]
- Wordie Ice Shelf has gone from an area of 1,500 km2 (580 sq mi) in 1950 to 1,400 km2 (540 sq mi) in 2000.[134]
- Prince Gustav Ice Shelf has gone from an area of 1,600 km2 (620 sq mi) to 1,100 km2 (420 sq mi) in 2008.[134] After their loss the reduced buttressing of feeder glaciers has allowed the expected speed-up of inland ice masses after shelf ice break-up.[135]
- The Ross Ice Shelf is the largest ice shelf of Antarctica (an area of roughly 487,000 square kilometres (188,000 sq mi) and about 800 kilometres (500 mi) across: about the size of France).[136]
- Wilkins Ice Shelf is another ice shelf that has suffered substantial retreat. The ice shelf had an area of 16,000 km2 (6,200 sq mi) in 1998 when 1,000 km2 (390 sq mi) was lost that year.[137] In 2007 and 2008 significant rifting developed and led to the loss of another 1,400 km2 (540 sq mi) of area and some of the calving occurred in the Austral winter. The calving seemed to have resulted from preconditioning such as thinning, possibly due to basal melt, as surface melt was not as evident, leading to a reduction in the strength of the pinning point connections. The thinner ice then experienced spreading rifts and breakup.[138] This period culminated in the collapse of an ice bridge connecting the main ice shelf to Charcot Island leading to the loss of an additional 700 km2 (270 sq mi) between February and June 2009.[139]
Dakshin Gangotri Glacier, a small outlet glacier of the Antarctic ice sheet, receded at an average rate of 0.7 m (2.3 ft) per year from 1983 to 2002. On the Antarctic Peninsula, which is the only section of Antarctica that extends well north of the Antarctic Circle, there are hundreds of retreating glaciers. In one study of 244 glaciers on the peninsula, 212 have retreated an average of 600 m (2,000 ft) from where they were when first measured in 1953.[140]
Pine Island Glacier is an Antarctic outflow glacier that flows into the Amundsen Sea. A study from 1998 concluded that the glacier thinned 3.5 m (11 ft)± 0.9 m (3.0 ft) per year and retreated a total of 5 km (3.1 mi) in 3.8 years. The terminus of the Pine Island Glacier is a floating ice shelf, and the point at which it starts to float retreated 1.2 km (0.75 mi) per year from 1992 to 1996. This glacier drains a substantial portion of the West Antarctic Ice Sheet.[141]
A study published in 2014 found, rapid grounding line retreat in the years 1992–2011.[142] Based on a study from 2005, the greatest retreat was seen in Sjogren Glacier, which is now 13 km (8.1 mi) further inland than where it was in 1953. There are 32 glaciers that were measured to have advanced; however, these glaciers showed only a modest advance averaging 300 m (980 ft) per glacier, which is significantly smaller than the massive retreat observed.[143]
Thwaites Glacier, which has also shown evidence of thinning, has been referred to as the weak underbelly of the West Antarctic Ice Sheet.[141] A study published in 2014 found rapid grounding line retreat in the years 1992–2011.[142] More recently, new satellite imaging data led to calculations of Thwaites Glacier "ice shelf melt rate of 207 m/year in 2014–2017, which is the highest ice shelf melt rate on record in Antarctica."[24]
Totten Glacier is a large glacier draining a major portion of the East Antarctic Ice Sheet. A study in 2008 concluded that Totten Glacier is currently losing mass.[144] A study published in 2015 concluded that Totten Glacier, has the largest contribution of ice thinning rate on the East Antarctic continent, and that the thinning is driven by enhanced basal melting, because of ocean processes, and affected by polynya activity. Additionally, warm Circumpolar Deep Water, has been observed during summer and winter months at the nearby continental shelf below 400 to 500 meters of cool Antarctic Surface Water.[145]
A 2019 study showed that Antarctica is losing ice six times faster than it was 40 years ago. Another study showed that two glaciers, Pine Island and Thwaites, are melting five times faster than "in the early 1990s".[146]
In February 2020, it was reported from Esperanza Base, the Antarctic Peninsula reached a temperature of 18.3 °C (64.9 °F), the hottest on record to date for continental Antarctica. In the past 50 years, temperatures in the Antarctic Peninsula have surged 5 degrees and about 87% of the glaciers along the peninsula's west coast have retreated.[147][148][149]
Tropics
Tropical glaciers are the most uncommon of all glaciers for a variety of reasons. Firstly, the regions are the warmest part of the planet. Secondly, the seasonal change is minimal with temperatures warm year round, resulting in a lack of a colder winter season in which snow and ice can accumulate. Thirdly, few taller mountains exist in these regions upon which enough cold air exists for the establishment of glaciers. Overall, tropical glaciers are smaller than those found elsewhere and are the most likely glaciers to show rapid response to changing climate patterns. A small temperature increase of only a few degrees can have almost immediate and adverse effect on tropical glaciers.[151]
Near the Equator, ice is still found in East Africa, the Andes of South America and New Guinea. The retreat of equatorial glaciers has been documented via maps and photographs covering the period from the late 1800s to nearly the present.[152] 99.64% of tropical glaciers are in Andean mountains of South America, 0.25% on the African glaciers of Rwenzori, Mount Kenya and Kilimanjaro, and 0.11% in the Irian Jaya region in New Guinea.[153]
Africa
Almost all Africa is in
The Furtwängler Glacier is located near the summit of Kilimanjaro. Between 1976 and 2000, the area of Furtwängler Glacier was cut almost in half, from 113,000 m2 (1,220,000 sq ft) to 60,000 m2 (650,000 sq ft).[159] During fieldwork conducted early in 2006, scientists discovered a large hole near the center of the glacier. This hole, extending through the 6 m (20 ft) remaining thickness of the glacier to the underlying rock, was expected to grow and split the glacier in two by 2007.[154]
To the north of Kilimanjaro lies
South America
A study by glaciologists of two small glaciers in South America reveals another retreat. More than 80% of all glacial ice in the northern Andes is concentrated on the highest peaks in small plains of approximately 1 km2 (0.39 sq mi) in size. A 1992 to 1998 observation of the Chacaltaya Glacier in Bolivia and Antizana Glacier in Ecuador indicate that between 0.6 m (2.0 ft) and 1.9 m (6.2 ft) of ice was lost per year on each glacier. Figures for Chacaltaya show a loss of 67% of its volume and 40% of its thickness over the same period. Chacaltaya Glacier has lost 90% of its mass since 1940 and was expected to disappear altogether sometime between 2010 and 2015. Antizana is also reported to have lost 40% of its surface area between 1979 and 2007.[162] Research also indicates that since the mid-1980s, the rate of retreat for both of these glaciers has been increasing.[163] In Colombia, the glaciers atop Nevado del Ruiz have lost more than half their area in the last 40 years.[164]
Further south in Peru, the Andes are at a higher altitude overall, and host around 70% of all tropical glaciers. A 1988 glacier inventory based upon data from 1970 estimated, that at that time glaciers covered an area of 2,600 km2 (1,000 sq mi).[165][166] Between 2000 and 2016, 29% of the glacierized area was lost, the remaining area estimated at around 1,300 km2 (500 sq mi).[166] The Quelccaya Ice Cap is the second largest tropical icecap in the world after the Coropuna ice cap,[167] and all of the outlet glaciers from the icecap are retreating.[168] In the case of Qori Kalis Glacier, which is one of Quelccayas' outlet glaciers, the rate of retreat had reached 155 m (509 ft) per year during the three-year period of 1995 to 1998. The melting ice has formed a large lake at the front of the glacier since 1983, and bare ground has been exposed for the first time in thousands of years.[169]
Oceania


In 1913, 4,550 m (14,930 ft) high Prins Hendrik peaks (now
For this mountain there is photographic evidence of massive glacial retreat since the region was first extensively explored by airplane in 1936 in preparation for the
Management approaches
Reducing greenhouse gas emissions (i.e. climate change mitigation measures) is the only solution that addresses the root cause of glacier retreat since industrialization.
To retard melting of the glaciers some Austrian ski resorts partially covered portions of the Stubai and Pitztal Glaciers with plastic.[177] In Switzerland plastic sheeting is also used to reduce the melt of glacial ice used as ski slopes.[178] While covering glaciers with plastic sheeting may prove advantageous to ski resorts on a small scale, this practice is not expected to be economically practical on a much larger scale.
See also
- List of glaciers
- Effects of climate change
- Extreme Ice Survey
- Permafrost carbon cycle
- Post-glacial rebound
References
- ^ a b Fox-Kemper, B., H.T. Hewitt, C. Xiao, G. Aðalgeirsdóttir, S.S. Drijfhout, T.L. Edwards, N.R. Golledge, M. Hemer, R.E. Kopp, G. Krinner, A. Mix, D. Notz, S. Nowicki, I.S. Nurhati, L. Ruiz, J.-B. Sallée, A.B.A. Slangen, and Y. Yu, 2021: Chapter 9: Ocean, Cryosphere and Sea Level Change. In Climate Change 2021: The Physical Science Basis. Contribution of Working Group I to the Sixth Assessment Report of the Intergovernmental Panel on Climate Change [Masson-Delmotte, V., P. Zhai, A. Pirani, S.L. Connors, C. Péan, S. Berger, N. Caud, Y. Chen, L. Goldfarb, M.I. Gomis, M. Huang, K. Leitzell, E. Lonnoy, J.B.R. Matthews, T.K. Maycock, T. Waterfield, O. Yelekçi, R. Yu, and B. Zhou (eds.)]. Cambridge University Press, Cambridge, United Kingdom and New York, NY, US, doi:10.1017/9781009157896.011.
- PMID 34931039.
- ^ ISSN 1994-0416. Abstract; Fig. 4.
- ^ Pelto, Mauri. "Recent Global Glacier Retreat Overview". North Cascade Glacier Climate Project. Retrieved February 14, 2015.
- S2CID 233446479.
- ^ "Global Glacier State". WGMS.ch. World Glacier Monitoring Service under the auspices of ISC (WDS), IUGG (IACS), UN environment, UNESCO, WMO. 2020. Archived from the original on 4 August 2022.
- ^ S2CID 255441012.
- ^ . Retrieved November 23, 2020.
- S2CID 206547524. Retrieved November 23, 2020.
- ^ ISBN 978-0470844274. Retrieved November 23, 2020.
- ^ . Retrieved November 23, 2020.
- ^ ISBN 9781437915693.
- ^ "2013 State of the climate: Mountain glaciers". NOAA. July 12, 2014. Retrieved November 23, 2020.
- ^ "Melting glaciers threaten Peru". BBC News. October 9, 2003. Retrieved January 7, 2021.
- ISBN 978-92-64-09036-1. Retrieved 2011-10-15.
- ^ a b "Global Warming Triggers Glacial Lakes Flood Threat" (Press release). United Nations Environment Programme. 16 April 2002. Archived from the original on 26 May 2005. Retrieved 14 November 2015.
- ^ An Overview of Glaciers, Glacier Retreat, and Subsequent Impacts in Nepal, India and China (PDF) (Report). WWF Nepal Program. March 2005. p. 3.
- ^ a b c Mauri S. Pelto. "Recent Global Glacier Retreat Overview". Retrieved August 7, 2016.
- ^ "How would sea level change if all glaciers melted? | U.S. Geological Survey". www.usgs.gov. Retrieved 2023-04-23.
- S2CID 34008905.
- S2CID 14374232.
- S2CID 6054006.
- ^ Team, By Carol Rasmussen, NASA's Earth Science News. "Huge cavity in Antarctic glacier signals rapid decay". Climate Change: Vital Signs of the Planet. Retrieved 2019-02-05.
{{cite web}}: CS1 maint: multiple names: authors list (link) - ^ PMID 30729155.
- S2CID 15284296.
- ISBN 978-3540200147.
- ISBN 9781843537113.
- ISBN 978-0312546281.
- ISBN 9789400770218.
- ^ a b Pelto, Mauri (April 4, 2010). "Mer de Glace, Glacier Retreat-A Receding Sea". From a Glacier's Perspective. Retrieved March 1, 2015.
- ^ Vaughn, Adam (September 18, 2019). "Special report: How climate change is melting France's largest glacier". New Scientist. Retrieved February 3, 2021.
- ^ "Glacier des Bossons and Glacier de Taconnaz". Glaciers Online. Swiss Education. March 7, 2011. Retrieved March 1, 2015.
- ^ a b "The Swiss Glaciers Glaciological Report (Glacier) No. 125/126" (PDF). University of Zurich. 2009. pp. 14–17. Retrieved April 11, 2015.
- ^ S2CID 55879630. Retrieved April 11, 2015.
- ^ Malinverni, Eva; Croci, Claudia; Sgroi, Fabrizio (February 2008). "Glacier Monitoring by Remote Sensing and GIS Techniques in Open Source Environment" (PDF). EARSeL eProceedings. Archived from the original (PDF) on February 14, 2019. Retrieved April 18, 2015.
- PMID 18488623. Archived from the original(PDF) on April 18, 2015. Retrieved April 18, 2015.
- S2CID 129844246.
- ^ "Glaciers Online". Swiss Education. Retrieved April 18, 2015.
- ^ Two-thirds of glacier ice in the Alps 'will melt by 2100'
- ^ Modelling the future evolution of glaciers in the European Alps under the EURO-CORDEX RCM ensemble
- ^ "Almost all glaciers in the Alps could disappear by 2100: study". Deutsche Welle. Retrieved February 2, 2021.
- ^ Wikland, Maria; Holmlund, Per (2002). "Swedish Glacier front monitoring program – compilation of data from 1990 to 2001" (PDF). Stockholm: Tarfala Research Station, University of Stockholm. pp. 37–40. Retrieved June 28, 2015.
- ^ doi:10.1016/j.gloplacha.2006.08.004. Archived from the original(PDF) on 2016-11-07. Retrieved 2015-05-25.
- ^ a b "Glacier length change observations". Norwegian Water Resources and Energy Directorate. September 16, 2014. Archived from the original on May 26, 2015. Retrieved May 25, 2015.
- ^ "Engabreen". Norwegian Water Resources and Energy Directorate. September 16, 2014. Archived from the original on May 26, 2015. Retrieved May 25, 2015.
- ^ "Hardangerjøkulen". Norwegian Water Resources and Energy Directorate. September 16, 2014. Archived from the original on May 26, 2015. Retrieved May 25, 2015.
- S2CID 129921361.
- ^ S2CID 128490189.
- .
- ^ Serrano, E.; E. Martinez; F. Lampre (2004). "Desaparición de Glaciares Pirenaicos Españoles". Retrieved July 1, 2015.
- PMID 24003138.
- ^ "Glacier loss may cost political instability". Anadolu Agency. Retrieved 2020-04-15.
- ^ "Glaciers melting faster in southeast Turkey, sparking concerns". Daily Sabah. 2019-07-30. Retrieved 2020-04-15.
- ^ Rocchio, Laura (July 1, 2015). "Turkish glaciers shrink by half". NASA. Retrieved November 23, 2020.
- .
- ^ .
- ^ a b Dyurgerov, Mark B.; Meier, Mark F. (2005). "Glaciers and the Changing Earth System: A 2004 Snapshot" (PDF). University of Colorado. Archived from the original (PDF) on September 30, 2009. Retrieved July 6, 2015.
- ^ .
- .
- ^ a b "Global Glacier Changes: facts and figures Northern Asia" (PDF). United Nations Environment Programme. Archived from the original (PDF) on September 24, 2015. Retrieved July 17, 2015.
- ^ "Himalayas Facts". Nature. February 11, 2011. Retrieved August 26, 2015.
- PMID 24180016.
- PMID 34931039.
- ^ "Narrowing the Knowledge Gap on Glaciers in High Mountain Asia". International Symposium on Glaciology in High Mountain Asia. International Centre for Integrated Mountain Development. March 9, 2015. Retrieved August 26, 2015.
- S2CID 155024036.
- ^ Pelto, Mauri (December 23, 2009). "Zemestan Glacier, Afghanistan Retreats". American Geophysical Union. Retrieved November 15, 2015.
- ^ Sandeep Chamling Rai; Trishna Gurung ia; et al. "An Overview of Glaciers, Glacier Retreat and Subsequent Impacts in Nepal, India and China" (PDF). WWF Nepal Program. Retrieved November 15, 2015.
- ^ a b Bajracharya, Mool. "Glaciers, glacial lakes and glacial lake outburst floods in the Mount Everest region, Nepal" (PDF). International Centre for Integrated Mountain Development. Archived from the original (PDF) on January 24, 2014. Retrieved January 10, 2010.
- ^ Naithani, Ajay K.; Nainwal, H. C.; Sati, K. K.; Prasad, C. (2001). "Geomorphological evidences of retreat of the Gangotri Glacier and its characteristics" (PDF). Current Science. 80 (1): 87–94. Retrieved November 15, 2015.
- ^ a b "Retreat of the Gangotri Glacier". NASA Earth Observatory. June 23, 2004. Retrieved November 15, 2015.
- ^ Raina, V. K. (2010). "Himalayan Glaciers A State-of-Art Review of Glacial Studies, Glacial Retreat and Climate Change" (PDF). Ministry of Environment and Forests. Retrieved November 15, 2015.
- ^ Anthwal, Ashish; Joshi, Varun; Sharma, Archana; Anthwal, Smriti (2006). "Retreat of Himalayan Glaciers – Indicator of Climate Change". Nature and Science. 4 (4): 53–59. Retrieved November 16, 2015.
- S2CID 55060060.
- ^ "Glacial Lakes and Glacial Lake Outburst Floods in Nepal" (PDF). International Centre for Integrated Mountain Development. 2011. p. 31. Archived from the original (PDF) on January 24, 2014. Retrieved November 22, 2015.
- ISBN 978-0203020777. Retrieved November 22, 2015.
- ^ United Nations Environment Programme. "Global Warming Triggers Glacial Lakes Flood Threat – April 16, 2002". UNEP News Release 2002/20. Archived from the original on June 3, 2016. Retrieved November 22, 2015.
- OSTI 813623.
- ^ Kirby, Alex (September 4, 2003). "Kazakhstan's glaciers 'melting fast'". BBC News.
- ^ a b c Kayumov, A. "Glaciers Resources of Tajikistan in Condition of the Climate Change" (PDF). State Agency for Hydrometeorology of Committee for Environmental Protection under the Government of the Republic of Tajikistan. Retrieved January 31, 2016.
- ^ Novikov, V. "Tajikistan 2002, State of the Environment Report". Climate Change. Research Laboratory for Nature Protection (Tajikistan). Archived from the original on September 28, 2011. Retrieved January 31, 2016.
- ISBN 978-0-89997-473-6. Retrieved 2011-10-15.
- ^ Price, Jonathan G. (2004). "Geology of Nevada". In Stephen B. Castor; Keith G. Papke; Richard O. Meeuwig (eds.). Proceedings of the 39th Forum on the Geology of Industrial Minerals, Nevada. Nevada Bureau of Mines and Geology. p. 192. Retrieved 2011-10-15.
- ^ Pelto, Mauri S. "Recent Global Glacier Retreat Overview". Retrieved 2011-10-15.
- .
- ^ Mauri S. Pelto. "North Cascade Glacier Terminus Behavior". Nichols College. Retrieved August 7, 2016.
- ^ U.S. Geological Survey. "Glacier Monitoring in Glacier National Park". Archived from the original on February 18, 2013. Retrieved April 25, 2003.
- ^ U.S. Geological Survey, U.S. Department of the Interior. "Glacier Retreat in Glacier National Park, Montana". Retrieved January 21, 2020.
- .
- ^ Wyoming Water Resources Data System Library (July 11, 1990). "Glacial Icemelt in the Wind River Range, Wyoming".
- ^ Storrow, Benjamin (2017-09-13). "The Rocky Mountains' Largest Glaciers Are Melting with Little Fanfare". Scientific American. Retrieved 2023-09-27.
- ^ Canadian Cryospheric Information Network. "Past Variability of Canadian Glaciers". Retrieved February 14, 2006.
- .
- ^ Bruce F. Molnia. "Fast-flow advance and parallel rapid retreat of non-surging tidewater glaciers in Icy Bay and Yakutat Bay, Alaska 1888–2003". Archived from the original on November 25, 2003. Retrieved September 6, 2003.
- ^ Mauri S. Pelto & Maynard M. Miller. "Terminus Behavior of Juneau Icefield Glaciers 1948–2005". North Cascade Glacier Climate Project. Retrieved August 7, 2016.
- .
- ^ Maynard M. Miller; Mauri S. Pelto. "Mass Balance Measurements of the Lemon Creek Glacier, Juneau Icefield, Alaska, 1953–2005". Archived from the original on August 13, 2016. Retrieved August 7, 2016.
- S2CID 16796327.
- ^ Guy W. Adema; et al. "Melting Denali: Effects of Climate Change on the Glaciers of Denali National Park and Preserve" (PDF). Retrieved September 9, 2007.
- ^ "Patagonian ice in rapid retreat". BBC News. April 27, 2004. Retrieved January 7, 2021.
- .
- .
- ^ EORC (July 15, 2005). "Huge glaciers retreat on a large scale in Patagonia, South America". Earth Observation research Center. Retrieved June 13, 2009.
- S2CID 6319942.
- ^ Salinger, Jim; Fitzharris, Blair; Chinn, Trevor (July 29, 2014), "New Zealand's Southern Alps have lost a third of their ice", The Conversation, retrieved February 18, 2015
- ^ United States Department of the Interior (May 4, 2000). "Glaciers of New Zealand". Archived from the original on June 3, 2008. Retrieved January 16, 2006.
- ISBN 978-0-8160-7005-3. Retrieved 2011-10-15.
- ^ Sveinsson, Óli Gretar Blondal (August 11–13, 2008). "XXV Nordic Hydrological Conference" (PDF). Nordic Association for Hydrology. Retrieved 2011-10-15.
- ^ Sigurdsson O, Jonsson T, Johannesson T. "Relation between glacier-termini variations and summer temperature in Iceland since 1930" (PDF). Hydrological Service, National Energy Authority. Archived from the original (PDF) on 2007-09-28. Retrieved September 7, 2007.
- S2CID 39219770.
- S2CID 130713775.
- hdl:2060/20040171503. Archived from the original(PDF) on 2023-07-11. Retrieved 2019-10-19.
- S2CID 205224896.[permanent dead link]
- S2CID 130350311.
- S2CID 7512251.
- ^ National Geographic. "Giant Ice Shelf Breaks Off in Canadian Arctic". Archived from the original on January 1, 2007. Retrieved August 7, 2016.
- S2CID 16548879.
- ^ Glowacki, Piotr. "Glaciology and environmental monitoring". Research in Hornsund. Archived from the original on September 4, 2005. Retrieved February 14, 2006.
- ^ GreenPeace (2002). "Arctic environment melts before our eyes". Global Warming—Greenpeace Pictures in Spitsbergen. Archived from the original on June 3, 2016. Retrieved February 14, 2006.
- S2CID 140630489.
- S2CID 131523457. Archived from the original(PDF) on 2012-03-05. Retrieved 2006-02-08.
- S2CID 22389368.
- ^ Ian Howat. "Rapidly accelerating glaciers may increase how fast the sea level rises". UC Santa Cruz, November 14–27, 2005 Vol. 10, No. 14. Retrieved November 27, 2007.
- ^ Jonathan Amos (14 May 2019). "Jakobshavn Isbrae: Mighty Greenland glacier slams on brakes". BBC. Retrieved 1 July 2019.
Where previously this was dropping in height by 20m a year, it's now thickening by 20m a year.
- ^ M Truffer; M Fahnestock. "The Dynamics of Glacier System Response: Tidewater Glaciers and the Ice Streams and Outlet Glaciers of Greenland and Antarctica I". Archived from the original on April 22, 2006.
- S2CID 41582882.
- ^ a b M. Pelto (18 April 2008). "Moulins, Calving Fronts and Greenland Outlet Glacier Acceleration". Retrieved August 7, 2016.
- .
- PMID 31031446.
- ^ "Greenland Lost 600 Billion Tons of Ice In 2 Months, Enough to Raise Global Sea Levels 2.2mm". SciTechDaily. UNIVERSITY OF CALIFORNIA – IRVINE. 20 April 2020. Retrieved 10 July 2020.
- ^ "Physical characteristics of ice on Earth, Climate Change 2001: Working Group I: The Scientific Basis. Intergovernmental Panel on Climate Change (IPCC)". Archived from the original on 2007-12-16. Retrieved 2015-05-22.
- S2CID 4410477.
- ^ National Snow and Ice Data Center (March 21, 2002). "Larsen B Ice Shelf Collapses in Antarctica". The Cryosphere, Where the World is Frozen. Archived from the original on April 18, 2014. Retrieved November 5, 2009.
- ^ NASA (14 May 2015). "NASA Study Shows Antarctica's Larsen B Ice Shelf Nearing Its Final Act".
- ^ .
- .
- ^ "Antarctic Hazards – British Antarctic Survey". Archived from the original on 2015-07-11. Retrieved 2015-05-22.
- .
- ^ Mauri S. Pelto (12 June 2008). "Ice Shelf Instability". Retrieved August 7, 2016.
- ^ ESA (June 13, 2009). "Satellite imagery shows fragile Wilkins Ice Shelf destabilised". European Space Agency.
- ^ "New Study in Science Finds Glaciers in Retreat on Antarctic Peninsula". American Association for the Advancement of Science. April 21, 2005. Archived from the original on October 21, 2017. Retrieved March 10, 2006.
- ^ S2CID 35745570.
- ^ S2CID 55646040.
- ^ "Antarctic glaciers show retreat". BBC News. April 21, 2005.
- S2CID 784105.
- doi:10.1038/ngeo2388.
- ^ Rosane, Olivia (May 16, 2019). "Antarctica's Ice Is Melting 5 Times Faster Than in the 90s". Ecowatch. Retrieved 19 May 2019.
- ^ "Antarctica logs hottest temperature on record with a reading of 18.3C". The Guardian. Retrieved January 7, 2021.
- ^ "Antarctica just hit 65 degrees, its warmest temperature ever recorded". Washington Post. February 7, 2020. Retrieved January 7, 2021.
- ^ "An Antarctic base recorded a temperature of 64.9 degrees F. If confirmed, it's a record high". NBC News. February 7, 2020. Retrieved January 7, 2021.
- ISBN 978-0-521-63333-8.
- ^ Pierrehumbert, Raymond (May 23, 2005). "Tropical Glacier Retreat". RealClimate. Retrieved March 8, 2010.
- ISBN 978-0-9729033-3-2. Archived from the originalon 2013-05-15.
- ISBN 978-0-521-63333-8.
- ^ a b "Snows of Kilimanjaro Disappearing, Glacial Ice Loss Increasing". Ohio State University. Archived from the original on September 1, 2006. Retrieved August 31, 2006.
- ^ Andrew Wielochowski (October 6, 1998). "Glacial recession on Kilimanjaro". Archived from the original on February 15, 2011. Retrieved January 7, 2006.
- S2CID 32880316.on March 13, 2004. Retrieved October 3, 2002.
Ohio State University. "African Ice Core Analysis reveals catastrophic droughts, shrinking ice fields and civilization shifts". Ohio State Research News. Archived from the original - ^ Town, Jane Flanagan. "Staying power of Kilimanjaro snow defies al Gore's gloomy forecast".
- ^ Unlimited, Guardian (March 14, 2005). "The peak of Mt Kilimanjaro as it has not been seen for 11,000 years". The Guardian.
Tyson, Peter. "Vanishing into Thin Air". Volcano Above the Clouds. NOVA. Retrieved August 7, 2016. - S2CID 32880316. Retrieved August 31, 2006.
- ^ U.S. Geological Survey. "Glaciers of Africa" (PDF). U.S. Geological Survey Professional Paper 1386-G-3. Archived from the original (PDF) on 2012-10-18. Retrieved 2006-01-30.
- ^ Andrew Wielochowski. "Glacial recession in the Rwenzori". Retrieved July 20, 2007.
- ^ Tegel, Simeon (2012-07-17). "Antisana's Glaciers: Victims of Climate Change". GlobalPost. Retrieved 13 August 2012.
- ^ Bernard Francou. "Small Glaciers Of The Andes May Vanish In 10–15 Years". UniSci, International Science News. Archived from the original on March 9, 2021. Retrieved January 22, 2001.
- S2CID 18144817.
- ^ U.S. Geological Survey, U.S. Department of the Interior. "Glaciers of South America – Glaciers of Peru". Retrieved October 15, 2019.
- ^ .
- ISSN 0022-1430.
- ^ In Sign of Warming, 1,600 Years of Ice in Andes Melted in 25 Years April 4, 2013 New York Times
- ^ Byrd Polar Research Center, The Ohio State University. "Peru – Quelccaya (1974–1983)". Ice Core Paleoclimatology Research Group. Retrieved February 10, 2006.
- ^ E.J. Brill, Tijdschrift van het Koninklijk Nederlandsch Aardrijkskundig Genootschap, 1913, p. 180.
- ^ Ian Allison & James A. Peterson. "Glaciers of Irian Jaya, Indonesia and New Zealand". U.S. Geological Survey, U.S. Department of the Interior. Archived from the original on May 12, 2008. Retrieved April 28, 2009.
- .
- ^ McDowell, Robin (July 1, 2010). "Indonesia's Last Glacier Will Melt 'Within Years'". Jakarta Globe. Archived from the original on August 16, 2011. Retrieved 2011-10-23.
- ^ Joni L. Kincaid & Andrew G. Klein. "Retreat of the Irian Jaya Glaciers from 2000 to 2002 as Measured from IKONOS Satellite Images" (PDF). 61st Eastern Snow Conference Portland, Maine, USA 2004. pp. 153–155. Retrieved August 7, 2016.
- ^ Jakarta Globe (July 2, 2010). "Papua Glacier's Secrets Dripping Away: Scientists". Archived from the original on August 11, 2011. Retrieved 2010-09-14.
- PMID 31818944.
- ^ M. Olefs & A. Fischer. "Comparative study of technical measures to reduce snow and ice ablation in Alpine glacier ski resorts" (PDF). in "Cold Regions Science and Technology, 2007". Archived from the original (PDF) on August 18, 2011. Retrieved September 6, 2009.
- ^ ENN (July 15, 2005). "Glacial Cover-Up Won't Stop Global Warming, But It Keeps Skiers Happy". Environmental News Network. Archived from the original on February 17, 2006.
| Authority control databases: National |
|---|