
San Pascual, Masbate
San Pascual | ||
|---|---|---|
| Municipality of San Pascual | ||
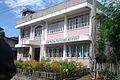
 Downtown area | ||
 Flag | ||
 Map of Masbate with San Pascual highlighted | ||
OpenStreetMap  | ||
.svg) San Pascual Location within the Philippines | ||
| Coordinates: 13°07′43″N 122°58′39″E / 13.1286°N 122.9775°E | ||
| Country | Philippines | |
| Region | Bicol Region | |
| Province | Masbate | |
| District | 1st district | |
| Barangays | 22
(see Vice Mayor Haira L. Rivera | |
| • Representative | Narciso R. Bravo Jr. | |
| • Municipal Council | Members | |
| • ZIP code | 5420 | |
| PSGC | ||
| IDD : area code | +63 (0)56 | |
| Native languages | Central Bikol Tagalog | |
| Website | www | |
San Pascual, officially the Municipality of San Pascual, is a 3rd class
province of Masbate, Philippines. According to the 2020 census, it has a population of 44,449 people.[4]
In addition to the northern part of
Burias Island
, the islands of Busing, Templo (or Iniwaran,) and another six small unpopulated islands belong to the municipality.
Geography
Barangays
San Pascual is politically subdivided into 22
sitios
.
- Boca Chica
- Bolod (Poblacion)
- Busing
- Dangcalan
- Halabangbaybay
- Iniwaran
- Ki-Buaya (Rizal)
- Ki-Romero (Roxas)
- Malaking Ilog
- Laurente
- Mabini
- Mabuhay
- Mapanique
- Nazareno
- Pinamasingan
- Quintina
- San Jose
- Terraplin
- Santa Cruz
- San Rafael
- Makahoy
- Cueva
Climate
| Climate data for San Pascual, Masbate | |||||||||||||
|---|---|---|---|---|---|---|---|---|---|---|---|---|---|
| Month | Jan | Feb | Mar | Apr | May | Jun | Jul | Aug | Sep | Oct | Nov | Dec | Year |
| Mean daily maximum °C (°F) | 27 (81) |
28 (82) |
29 (84) |
31 (88) |
31 (88) |
31 (88) |
30 (86) |
29 (84) |
29 (84) |
29 (84) |
29 (84) |
28 (82) |
29 (85) |
| Mean daily minimum °C (°F) | 22 (72) |
22 (72) |
22 (72) |
24 (75) |
24 (75) |
25 (77) |
25 (77) |
25 (77) |
25 (77) |
24 (75) |
24 (75) |
23 (73) |
24 (75) |
| Average precipitation mm (inches) | 55 (2.2) |
36 (1.4) |
45 (1.8) |
42 (1.7) |
114 (4.5) |
184 (7.2) |
245 (9.6) |
224 (8.8) |
238 (9.4) |
171 (6.7) |
130 (5.1) |
94 (3.7) |
1,578 (62.1) |
| Average rainy days | 13.0 | 9.5 | 11.8 | 12.7 | 21.3 | 25.3 | 28.3 | 26.5 | 26.4 | 24.2 | 19.9 | 16.1 | 235 |
| Source: Meteoblue[7] | |||||||||||||
Demographics
|
| |||||||||||||||||||||||||||||||||||||||||||||||||||
| Source: Philippine Statistics Authority[8][9][10][11] | ||||||||||||||||||||||||||||||||||||||||||||||||||||
In the 2020 census, the population of San Pascual, Masbate, was 44,449 people,[4] with a density of 180 inhabitants per square kilometre or 470 inhabitants per square mile.
Economy
Poverty Incidence of San Pascual
Graphs are unavailable due to technical issues. There is more info on Phabricator and on MediaWiki.org. |
Tourism
One of the popular tourist destinations in the municipality of San Pascual is the Sombrero Island with its pure white sand beach.
Gallery
-
 Municipal Hall
 -
 San Pascual Polytechnic Institute
 -
 Sombrero Island


References
- (DILG)
- (PDF) from the original on May 25, 2021. Retrieved July 16, 2021.
- ^ Error: Unable to display the reference properly. See the documentation for details.
- ^ a b c Census of Population (2020). "Region V (Bicol Region)". Total Population by Province, City, Municipality and Barangay. Philippine Statistics Authority. Retrieved 8 July 2021.
- ^ "PSA Releases the 2018 Municipal and City Level Poverty Estimates". Philippine Statistics Authority. 15 December 2021. Retrieved 22 January 2022.
- ^ "Province:". PSGC Interactive. Quezon City, Philippines: Philippine Statistics Authority. Retrieved 12 November 2016.
- ^ "San Pascual: Average Temperatures and Rainfall". Meteoblue. Retrieved 23 June 2020.
- ^ Census of Population (2015). "Region V (Bicol Region)". Total Population by Province, City, Municipality and Barangay. Philippine Statistics Authority. Retrieved 20 June 2016.
- ^ Census of Population and Housing (2010). "Region V (Bicol Region)" (PDF). Total Population by Province, City, Municipality and Barangay. National Statistics Office. Retrieved 29 June 2016.
- ^ Censuses of Population (1903–2007). "Region V (Bicol Region)". Table 1. Population Enumerated in Various Censuses by Province/Highly Urbanized City: 1903 to 2007. National Statistics Office.
{{cite encyclopedia}}: CS1 maint: numeric names: authors list (link) - ^
"Province of". Municipality Population Data. Local Water Utilities AdministrationResearch Division. Retrieved 17 December 2016.
- ^ "Poverty incidence (PI):". Philippine Statistics Authority. Retrieved December 28, 2020.
- ^ "Estimation of Local Poverty in the Philippines" (PDF). Philippine Statistics Authority. 29 November 2005.
- ^ "2003 City and Municipal Level Poverty Estimates" (PDF). Philippine Statistics Authority. 23 March 2009.
- ^ "City and Municipal Level Poverty Estimates; 2006 and 2009" (PDF). Philippine Statistics Authority. 3 August 2012.
- ^ "2012 Municipal and City Level Poverty Estimates" (PDF). Philippine Statistics Authority. 31 May 2016.
- ^ "Municipal and City Level Small Area Poverty Estimates; 2009, 2012 and 2015". Philippine Statistics Authority. 10 July 2019.
- ^ "PSA Releases the 2018 Municipal and City Level Poverty Estimates". Philippine Statistics Authority. 15 December 2021. Retrieved 22 January 2022.
External links
Wikimedia Commons has media related to San Pascual, Masbate.
- Philippine Standard Geographic Code
- Philippine Census Information
- Local Governance Performance Management System
Places adjacent to San Pascual, Masbate | ||||||||||||||||
|---|---|---|---|---|---|---|---|---|---|---|---|---|---|---|---|---|
| ||||||||||||||||
Masbate City (capital and largest city) | |
| Municipalities | |
| Component city | |
This article about a location in Bicol Region is a stub. You can help Wikipedia by expanding it. |